IJSRR, 7(1) Jan. – March, 2018 Page 18
Research article
Available online www.ijsrr.org
ISSN: 2279–0543
International Journal of Scientific Research and Reviews
Effects of Farm Size and Gender on Technical Efficiency of
Individually-owned and Group-owned Small Tea Growers of Assam
Lama Bondona
1* and Mohapatra Dr. Rangalal
21
Research Scholar, Department of Economics, Sikkim University, Sikkim, India
2
Assistant professor, Department of Economics, Sikkim University, Sikkim, India. Email:[email protected]
ABSTRACT:
The tea growers cultivating tea in small plots of land (less than 10.12 hectares) are called small tea growers. The present study compared the technical efficiency levels of the individually-owned and group-owned small tea growers of Udalguri district of Assam, India. On the basis of 90 randomly selected samples collected through primary survey, stochastic frontier analysis using Cobb-Douglass production function has been used to estimate the parameters of the function as well as the efficiency level of the growers. The result shows that the group-owned small tea growers are relatively more efficient (69%) than the individually-owned small tea growers (55%). As far as the inefficiency components are concerned, farm size has been found to have positively significant effect on both group-owned and individually-owned small tea growers but gender has been found to have no significant impact on the efficiency levels of both. The study suggests for emphasizing on the awareness among the individually-owned growers to form a group which would improve their efficiency. The incentive to the farmers for group loan education and training on farming method, irrigation method etc should be given either through government or NGOs to improve the efficiency and productivity of the small tea growers.
KEY WORDS:
Technical efficiency, group-owned small tea growers, individually-owned small tea growers, stochastic frontier analysis.
* Corresponding Author Bondona Lama
Research scholar, Department of Economics, Sikkim University, Sikkim, India
IJSRR, 7(1) Jan. – March, 2018 Page 19
INTRODUCTION
Plantation crops like tea, coffee, and rubber have great significance in the world economy. Among the four major plantation crops coffee, rubber, tea, and cardamom in India, tea is the most important. The history of Indian tea spans more than 160 years. India has the World’s largest area under tea cultivation, 566.66 million hectares in the year 2015 (Department of Agriculture, Cooperation and Farmer’s Welfare, 2015-16)1. Tea plantation is a major source of GDP in India, in the year 2015, India produced 1233.14 million kgs of tea of which 65.950 million kgs was from Assam. The tea industry in India provides employment to more than 2 million people. It occupies an important role in the Indian economy because of its impacts on the livelihood of a large number of people employed directly and indirectly by the industry.
The small tea gardens of Assam covers 55% of total small tea grower’s area in India and contributes more than 42% of total small tea grower’s production in India (Tea Board of India, 2012)2. The small tea growers (STG) of Assam contribute more than 30% of total tea produced in Assam. As per the records available, the first commercial small tea garden was established in Golaghat District in 1978 (Mudoi and Dutta, 2016)3. Now Assam has the largest area under small tea gardens in India 82805 registered STGs in Assam covering 838800 hectares of land which produced 139491 thousand kg of tea leaves in the year 2015 (Assam Statistical Handbook, 2105)4. Since its beginning, there has been tremendous growth of small tea cultivation in Assam with respect to both area and production. In this context, assessment of the existing level of technical efficiency of the small tea growers assumes an utmost importance which will help in analyzing whether there has been efficient utilization of the available resources or not.
IJSRR, 7(1) Jan. – March, 2018 Page 20
numbers of registered small tea gardens in Udalguri district has substantially increased since its introduction in the district in 1992. After that, many farmers started to cultivate tea in small holdings and in 2016 the number of small tea growers has gone up to more than 6000 registered small tea growers covering more than 7072.20 hectares of land in the district. Despite the rapid growth in numbers as well as area of STGs in the district, its average productivity of tea per hectare is very low (5200 kg/hectare) compared to all Assam average (9728.64 kg/hectare) during the year 2014-15 (Mudoi and Dutta, 2016)3. This low productivity of the small tea growers of Udalguri as the economic theory says may be due to misallocation of input mix, inappropriate use of inputs, untimely use of inputs and inappropriate choice of technology. One way to find out the actual causes behind the low productivity situation of the STGs of Udalguri district is to study the levels of efficiency of the STGs in the district, given the available resources and facilities for tea production.
The efficiency of a management firm, whether it’s an agricultural farm or an industrial unit, is very much important. Small tea growers can benefit from technical efficiency studies which shows how much increase in output is possible by improving their technical efficiency without increasing the resource base or developing new technologies. Since small tea gardens are mostly concentrated in rural areas, increasing the efficiency of the small tea growers of Udalguri district will help in increasing the productivity of the growers that will have positive effects in uplifting the socio-economic status of the rural population engaged in tea cultivation by increasing their revenue. The increased productivity will help in further development of the STGs and development of the district as a whole. Thus, for these reasons, this study will attempt to estimate the technical efficiency levels of small tea growers in Udalguri district of Assam.
IJSRR, 7(1) Jan. – March, 2018 Page 21
Amarnath, 201312; Ambalil, Adegbite, Ayinde and Awotide, 201213; Bashir and Khan, 200514; Akpan et al, 201315, Adeyemo, Oke and Akinola, 201316). Along with these variables, Belbase and Grabowski (1985)17 found labour hours, income and cost of planting material to be positively significant in increasing farm efficiency. On the contrary to this, Daadi, Gazaali, and Amikujunu (2015)18 found age, household size, education level and farming experience have no significant effect on farm efficiency and gender of the farmer and farm management type has a significant effect on efficiency. Adeyemo, Oke, and Akinola (2013)16 found that age and farming experience contributes to the farm inefficiency. Among these variables, the variables which may affect the technical efficiency levels of the small tea growers of Assam are,- age of the farmer, education level, training, farming experience, credit availability, farm size, labour hours, gender of the farmer and farm management type.
The main objective of the study is to estimate the effects of farm size and gender on technical efficiency of the group owned and individually-owned small tea growers of Udalguri district of Assam.
METHODOLOGY
There are two common methods used by most of the studies for empirically estimating the
performance of firms in terms of efficiency, namely non-parametric linear programming approach and parametric econometric approaches. Parametric methods are those for which it is known that the population is approximately normal, or it can be approximated using a normal distribution after invoking the central limit theorem. The stochastic frontier analysis is an example of the parametric model. Non parametric models are statistical techniques for which we do not have to make any
IJSRR, 7(1) Jan. – March, 2018 Page 22
Farrell (1957)9 for the first time investigated the structure of productive efficiency and showed how to define cost efficiency and he also decomposed cost efficiency into technical and allocative efficiency. Farrell (1957)9 defined technical efficiency as a firm’s success in producing maximum output from a given set of inputs while price efficiency as the firm’s success in choosing an optimal set of inputs. SFA originated with the works of Aigner, Lovel, and Schimdt (1977)21 and Meeusen and Van den Broeck (1977)22. Both these SFA models shared the composed error structure with two error components, one is intended to capture the effects of statistical noise and the other is intended to capture the effects of technical inefficiency. Following the specifications of Aigner, Lovell and Schimdt (1977)21 and Meeusen and Van den Broeck (1977)22 the stochastic production frontier can be written as,
yi = F ( x, β) eε i = 1, 2, . . . , N (1.1)
Where yi is the output for the ith firm, xi is a vector of k inputs (or cost of inputs), β is a vector of k unknown parameters, εi is the error term. The error term is composed of as follows-
εi = vi + ui , i =1,………, N (1.2)
After the works of Aigner, Lovell, and Schimdt (1957)21 and Meeusen and Broeck (1957)22, many more improvements have been done upon Farrell (1957)9’s idea of productive efficiency. Both the models of Aigner, Lovell, and Schimdt (1957)21 and Meeusen and Broeck (1957)22 were originally designed for analysis of cross-sectional data. However, subsequently various models were introduced to account for panel data, (e.g. Battese and Coelli, 199523; Kumbhakar and Lovell, 200024). Since in this study the data to be collected are of cross sectional in nature, we will be using the SFA model as introduced by Aigner, Lovell, and Schimdt (1977)21 and Meeusen and Broeck (1977)22. Economists have utilized SFA techniques to examine the efficiency in various areas such as agriculture, (e.g. Battese and Coelli, 199523; Karthik Alagumani and Amarnath, 201312), manufacturing (e.g. Diaz and Sanchez, 200825), health (e.g. Jacobs, 200626; Rosenman 200127), sports (e.g. Young, 201428), banking, (e.g. Ngan, 201429), insurance, (e.g. Rai, 199630) etc.
Study area and method of data collection:
IJSRR, 7(1) Jan. – March, 2018 Page 23
832769 of which 795191 are rural population i.e. 95.5 % of the total population (District Statistical Handbook, Udalguri 2013-148). Small cultivation of tea plays an important role in the economy of Udalguri district. Total area under tea cultivation in Udalguri district is almost 16% of the total net area sown in Udalguri and the share is increasing at a fast rate in the year 2011 it was only 2% of the total agricultural land. Registered small growers alone cover 43.3% of the total tea area. Assam is the largest tea growing state in India. Assam has more than 54% of the total area under tea production in India and contributes 52% of the total tea produced. Small tea cultivation in Assam plays a vital role in its economy. The small tea gardens in Assam provide employment to more than 5.55 lakh workforce (Banerjee and Banerji, 200831). In the year 1992, there was only one small tea garden in Udalguri district, which has become more than 6000 in number in 2016 covering an area of over 7072 hectares. Therefore there arises a need to examine the efficiency levels of the growers of this rapidly growing sector. Another reason for selecting Udalguri district as the study area for this study is, despite the homogeneity of climatic and soil conditions, the average production of small tea growers of Udalguri district, 1650 kg per hectare, is much lower than the average productivity of small tea growers of Assam as a whole which is 2300 kg per hectare. Since productivity is also affected by efficiency levels, this may be an indication of low efficiency levels of the small tea growers of Udalguri district; one way to confirm is to estimate it.
The data required for this study has been collected from registered small tea growers of Udalguri district. A sample of total 90 small tea growers has been collected for this study out of which 21 were group-owned2 owned and 69 were individually-owned3 small tea growers. As this study was done for the partial fulfillment of the requirements for the award of the degree of M Phil, and there was a time limit for the study for which the sample size was decided to be of total 90 samples with 95% confidence level and 10% confidence interval. The sample has been selected randomly from the list of registered small tea growers collected from sub-regional office of Tea Board of India in Udalguri district.
2
In case of group small tea growers, the owners of the garden are a group of individuals, all the production and management decisions of group small tea gardens are taken collectively by the group.
3 In case of individual small tea growers there is only one owner of the garden and all the production and management decisions of the garden are taken by
IJSRR, 7(1) Jan. – March, 2018 Page 24
ANALYTICAL MODEL
The technical efficiency levels of the group owned and individually-owned small tea growers were estimated separately to compare them. Stochastic Frontier Analysis had been used for estimating the technical efficiency levels of the small tea growers of Udalguri district in this study. The stochastic production function of the small tea growers was assumed to be of Cobb-Douglass form. The choice of Cobb-Douglas production function has been made as it is the most used form of production function in the empirical studies especially the studies in the field of agriculture (Li and Li, 201132; Abedullah, Kouser and Mushtaq, 200710; Ambalil, Adegbite, Ayinde and Awotide, 201213; Ayaz and Hussain, 201111).
The technical efficiency and the factors influencing it were jointly estimated with the stochastic frontier production function using maximum likelihood estimation method for both group-owned and individually-owned small tea growers. The log-linear form of the Cobb-Douglas stochastic production function used in this study can be expressed as follows-
lnYi = β0 + β1ln(FERTI))i + β2ln(PESTI)i + β3ln(HERBI)i + β4ln(MANU)i + β5ln(LAB)i+ vi - ui
i=1,2...90 (1.3) Where,
Yi = Total tea leaves produced (quintal/year)
LABi = Annual use of labour by the ith small tea garden (man days4)
MANUi = Annual use of manure by the ith small tea garden (kg)
FERTIi = Annual use of fertilizer by the ith small tea garden (kg). Only NPK has been used for
estimation in this study because only this is common among all the growers.
PESTIi = Annual use of pesticides by the ith small tea garden (ltr). For pesticides Agradut is
common among all the growers, therefore only Agradut is used for estimation in this study.
IJSRR, 7(1) Jan. – March, 2018 Page 25
HERBIi = Annual use of herbicides by the ith small tea garden (ltr). For herbicides glycil is
common among all the growers, therefore only glycil used has been used for estimation in this study. The relationship between the technical inefficiency levels of the small tea growers and the potential socioeconomic factors affecting them was specified with the help of the following inefficiency model-
ui= δ0+ δ1 (FSIZE)i+ δ2(GENDER)i ; i=1,2..90 (1.4)
Where,
FSIZEi = Total area under tea cultivation of the ith small tea grower (bigha5). Area under tea
cultivation has been taken in the local unit of measurement bigha.
GENDERi= Dummy for gender of the ith small tea grower (1=male, 0=female)
The ui in this study follows a half-normal distribution. The inefficiency model and the
stochastic frontier production function are tested using the Generalized Likelihood Ratio test for testing if inefficiency effects are absent in the model. The Generalized Likelihood Ratio is expressed as follows-
LR= -2{LR of restricted model/LR of unrestricted model (1.5)
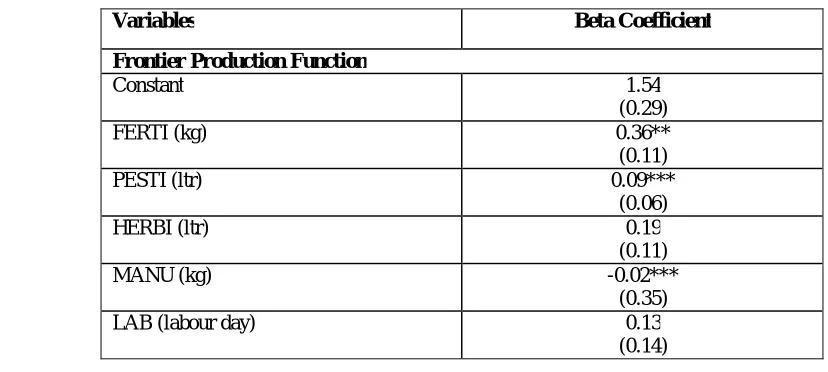
Table No. 1: Maximum Likelihood Estimates of the Parameters of Stochastic Frontier C-D Production Function of
Individually-owned Small Tea Growers
Variables Beta Coefficient
Frontier Production Function
Constant 1.54
(0.29)
FERTI (kg) 0.36**
(0.11)
PESTI (ltr) 0.09***
(0.06)
HERBI (ltr) 0.19
(0.11)
MANU (kg) -0.02***
(0.35)
LAB (labour day) 0.13
(0.14)
IJSRR, 7(1) Jan. – March, 2018 Page 26
Inefficiency Model
Constant 1.30**
(0.51) FSIZE (bigha) -0.07** (-0.02) GENDER (1=male,0=female) 0.04 (0.34)
Sigma squared (σ ) 0.23**
(0.07)
Gamma (γ) 0.78*
(0.19)
LR 14.01*
Mean technical efficiency 0.55
N 69
Note: *, **, *** indicates 1%, 5% and 10% level of significance respectively. And the figures in bracket shows ‘standard error’ value
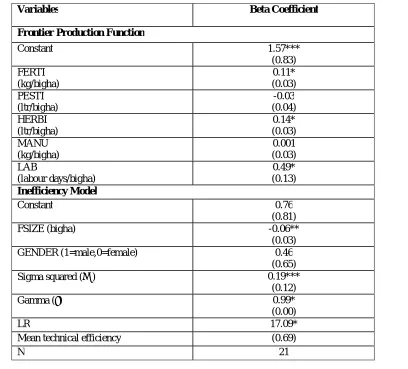
Table No. 2: Maximum Likelihood Estimates of the Parameters of Stochastic Frontier C-D Production Function of
Group-owned Small Tea Growers
Variables Beta Coefficient
Frontier Production Function
Constant 1.57***
(0.83) FERTI (kg/bigha) 0.11* (0.03) PESTI (ltr/bigha) -0.03 (0.04) HERBI (ltr/bigha) 0.14* (0.03) MANU (kg/bigha) 0.001 (0.03) LAB (labour days/bigha) 0.49* (0.13) Inefficiency Model
Constant 0.76
(0.81)
FSIZE (bigha) -0.06**
(0.03)
GENDER (1=male,0=female) 0.46
(0.65)
Sigma squared (σ ) 0.19***
(0.12)
Gamma (γ) 0.99*
(0.00)
LR 17.09*
Mean technical efficiency (0.69)
IJSRR, 7(1) Jan. – March, 2018 Page 27
Note: *, **, *** indicates 1%, 5% and 10% level of significance respectively. And the figures in bracket shows ‘standard error’ value
The maximum likelihood estimates of the stochastic frontier C-D production function for the individually-owned small tea growers are presented in Table 1, and the same for group-owned small tea growers is presented in Table 2. The LR value and the gamma value both are significantly different from zero in both the cases which suggests that the models are a good fit. The mean technical efficiency of the group-owned small tea growers 69% is higher than the individually-owned small tea growers 55%. These results are similar to those found by Daadi, Gazali and Amikuzunu (2014)18 in which it was found that group managed agricultural farms were more technically efficient than the individually managed farms. The gamma value of 0.78 for individually-owned small tea growers found results imply that 78% of the inefficiency is explained by those inefficiency variables. While in case of group-owned small tea growers the same is 99%. The nonparametric test of the difference of mean between individually-owned and group-owned small tea growers is found to be statistically significant at 1% (p= 0.003).
In the production model fertilizer, pesticide, and herbicide have been found as theoretically expected with a positive impact on the total production of the individually-owned small tea growers. This implies that a percentage increase in these variables will result in an increase of the total production of individually-owned small tea growers. The variable labour days (0.13) has been found to have a positive but statistically insignificant impact on the total production. The individually-owned small tea growers are mostly smaller and need less labour to be employed this may be the reason behind the positive but insignificant impact of labour days on production. In the model, manure has been found to have a negative impact on the total production, due to the fact that may be on an average the growers are using excessive amounts of manure, which have resulted in the occurrence of diminishing marginal returns with respect to manure use. Similar results have been found in the case of pesticide use in group-owned small tea growers. The coefficient of pesticide in group-owned small tea growers have been found to have a negatively significant impact on total production, this result also can be attributed to diminishing marginal returns due to excessive use of pesticides among the group-owned small tea growers.
individually-IJSRR, 7(1) Jan. – March, 2018 Page 28
owned small tea growers. In both cases, the coefficient of farm size is negative which implies an increase in farm size results in reducing technical inefficiency in both individually-owned and group-owned small tea growers, which mean that technical efficiency is more in the small tea growers with large farm size. This may because of the increasing returns to scale with respect to land use. This can be one of the reasons for the comparatively more technical efficiency of the group-owned small tea growers than the individually-owned small tea growers.
The dummy for gender has been found to have a positive but statistically insignificant impact on the technical inefficiency of both individually-owned and group-owned small tea growers. The positive value of dummy for gender implies that the female small tea growers are more technically efficient than their male counterparts, but the statistically insignificant result found may be because of the very less number of female growers in the observation. There were only 8 female growers in the total observation of 90 small tea growers among which 5 were individually-owned growers and 3 were group-owned growers.
CONCLUSION
IJSRR, 7(1) Jan. – March, 2018 Page 29
REFERENCES
1. Department of Agriculture, Cooperation and Farmer’s Welfare, Ministry of Agriculture and Farmer’s Welfare, Government of India. Annual Report. Krishi Bhawan, New Delhi. 2015-16. 2. Tea Board of India. Annual Report. 2012.
3. Mudoi Diganta K, Dutta Subit. Potential Factors Behind the Rapid Growth of Small Tea Growers (STGs) in Golaghat District of Assam- An Analysis. International Journal of Business and Administration Research Review, 2016; 2 (1): 98-102.
4. Directorate of Economics and Statistics, Assam. Statistical Handbook Assam. 2005.
5. Reddy and Bhowmik. Small Growers and Co-operative Tea Factories in Nilgiris. Economic and Political Weekly, 1989; 24: A145-A147+A149-A151.
6. Barua P. Problems of Small Tea Growers: A Study in Sonitpur District of Assam. Social Change and Development, 2015; 12: 88-96.
7. Mitra N. Indian Tea Industry: Problems and Policies. Economic and Political Weekly, 1991; 26: M135-M156.
8. District Statistical Handbook, Udalguri, 2013-14.
9. Farrell M J. The Measurement of Productive Efficiency. Journal of the Royal Statistical Society, 1957; 120 (3): 253-290.
10.Abedullah, Kouser S, Mushtaq K. Analysis of Technical efficiency of Rice Production in Punjab (Pakistan) Implications for Future Investment Strategies. Pakistan Economic and Social Review, 2007; 45 (2): 231-244.
11.Ayaz S, Hussain Z. Impact of Institutional Credit on Production Efficiency of Farming Sector: A Case Study of District Faisalabad. Pakistan Economic and Social Review, 2011; 49 (2): 149-162.
12.Karthik V, Alagumani T, Amarnath J S. Resource-use Efficiency and Technical Efficiency of Turmeric Production in Tamil Nadu-A Stochastic Frontier Approach. Agricultural Economics Research Review, 2013; 26 (1): 109-114.
IJSRR, 7(1) Jan. – March, 2018 Page 30
14.Bashir Muhammad, Khan Dilawar, Iqbal Muhammad. An Analysis of Allocative Efficiency of Wheat Growers in Northern Pakistan. The Pakistan Development Review, 2005; 44 (4): 643-657.
15.Akpan Sunday B., Uwemedimo E. Okon, Elizabeth N Jeiol, Kesit K Nkeme, Daniel E John. Economic Efficiency of Cassava Based Farmers in Southern Western Region of Cross River state, Nigeria: A Translog Model Approach. International Journal of Humanities and Social Science, 2013; 3 (12): 173-181.
16.Adeyemo R, Oke J T O, Akinola A. Economic Efficiency of Small Scale Farmers in Ogun State, Nigeria. Tropicultura, 2010; 28 (2): 84-88.
17.Belbase Krishna, Grabowski Richard. Technical Efficiency in Nepalese Agriculture. The Journal of Developing Areas, 1985; 19: 515-526.
18.Daadi B, Gazaali I, Amikujunu J. Technical Efficiency Analysis of Organic Mango Grower Farm Management Types: The Case of Integrated Tamale Fruit Company (ITFC) Out-Growers in Northern Region. African Journal of Agriculture and Rural Development, 2014; 2 (3): 129-137.
19.Charnes A, Cooper W W, Rhodes E. Measuring the Efficiency of Decision Making. European Journal of Operational Research, 1978; 2 (6): 429-444.
20.Banker R D, Charnes A, Cooper WW. Some Models for Estimating of Technical and Scale Inefficiencies in Data Envelopment Analysis. Management Science, 1984; 30 (9): 1078-1092. 21.Aigner D, Lovell C A Knox, Schimdt P. Formulation and Estimation of Stochastic Frontier
Production function Models. Journal of Econometrics, 1977; 6: 21-37.
22.Meeusen W, Broeck Julian van Den. Efficiency Estimation from Cobb-Douglass Production Functions with Composed Error.International Economic Review, 1977; 18: 435-444.
23.Battese G E, Coelli T J. A Model for Technical Inefficiency Effects in a Stochastic Frontier Production Function for Panel Data. Empirical Economics, 1995; 20: 325–332.
24.Kumbhakar S C, Lovell C A Knox. Stochastic frontier Analysis. Cambridge University Press, New York, 2000.
25.Diaz M Angeles, Sanchez R. Firm Size and Productivity in Spain: A Stochastic Frontier Analysis. Springer, Small Business Economics, 2008; 30: 315-323.
IJSRR, 7(1) Jan. – March, 2018 Page 31
27.Rosenman R. Cost Inefficiency in Washington Hospitals: A Stochastic Frontier Approach Using Panel Data. Health Care Management Science, 2001; 4 (2): 3-81.
28.Young Hoon Lee. Stochastic Frontier Analysis in Sports economics. International Journal of Sports Finance, USA, 2014; 9 (4): 360-374.
29.Ngan Le Thi Thanh. Profit and Cost Efficiency Analysis in Banking Sector: A Case of Stochastic Frontier Approach for Vietnam. Journal of Knowledge Management, Economics and Information Technology, 2014; 4 (5): 1-17.
30.Rai A. Cost Efficiency of International Insurance Firms. Journal of Financial Services Research, 1996; 10 (3): 213-233.
31.Banerjee GD, Banerjee S .Tea Industry in Transition. Abhijit Publications, Delhi. 2009