INTRODUCTION
Osmium, the densest natural element, has oxidation states ranging from -2 to +8 1. Osmium is found in nature as an alloy, mostly in platinum ores. Osmium is also used in alloys with platinum, iridium and other platinum group metals. Those alloys are employed in fountain pen tips, electrical contacts and in other applications where extreme durability and hardness are needed2. Because of the volatility and extreme toxicity of its oxide, osmium is rarely used in its pure state, and it is instead often alloyed with other metals. Those alloys are utilized in high-wear applications¹.
The most common compound exhibiting the +8 oxidation state is osmium tetroxide. Osmium tetroxide, a very volatile, water-soluble and toxic compound, is the main source for the contact to the environment and simplicity for med from osmium3.
A simple catalytic kinetic spectrophotometric method
for the determination of osmium in wastewater samples
M. REZA SHISHEHBORE* and HASAN BAGHERI
Department of Chemistry, Islamic Azad University, Yazd Branch, Yazd, P. O. Box 89195-155 (Iran). (Received: May 23, 2010; Accepted: July 06, 2010)
ABSTRACT
This paper reports a new simple, sensitive and selective catalytic kinetic spectrophotometric method for the determination of trace quantities of Os(VIII). Janus Green is oxidized by hydrogen peroxide in borate buffer at pH 9.0 and Os(VIII) catalyzes the reaction. Reaction rate was monitored
spectrophotometrically at 618 nm. The calibration graph is linear for 0.4 – 430.0 ng mL-1 of Os(VIII)
and the detection limit is 0.08 ng mL-1 of Os(VIII). The relative standard deviations (n = 10) varied from
2.75 to 1.32% for 40.0 and 400.0 ng mL-1 of Os(VIII), respectively. The effect of presence of foreign
ions was also investigated. The proposed method was applied in real samples with satisfactory results.
Key words: Janus Green, osmium, kinetic spectrophotometric, wastewater.
Osmium tetroxide has been used in fingerprint detection and in staining fatty tissue for optical and electron microscopy. As a strong oxidant, it cross-links lipids mainly by reacting with unsaturated carbon-carbon bonds, and thereby both fix biological membranes in place in tissue samples and simultaneously stain them. Because osmium atoms are extremely electron dense, osmium staining greatly enhances image contrast in transmission electron microscopy studies of biological materials4.
interferences caused by various types of matrices13. Other conventional methods are spectrophotometric methods (14-16) and catalytic spectrophotometric methods17-21. UV–Vis spectrophotometr y was historically the first instrumental technique used for the quantification of small amounts of noble metals in various materials. The technique requires a quantitative conversion of the analytes into stable complexes that can act as the basis of spectrophotometric measurements22.
Only a few reports have been found for determination of Os(VIII) with kinetic methods17,19,21. They have either long reaction time17, 19, 21) or recommended temperature is higher than room temperature17, 19.
In last decade, only a report was found for kinetic spectrophotometr ic deter mination of Os(VIII)21. In this method, oxidation of carminic acid with hydrogen peroxide catalyses by Os(VIII), but the method suffers from limited linear dynamic range (Table 6).
Therefore, in order to determine trace osmium in real samples, it is necessary to develop a simple, sensitive and selective new method.
In this paper, a new kinetic spectrophotometric method based on the catalytic effect of Os(VIII) on the oxidation of Janus Green (JG) by hydrogen peroxide is proposed. The method is suitable for the selective determination of as low as 0.08 ng mL-1 of Os(VIII). This method was successfully applied for the quantitative determination of Os(VIII) in biological and medical wastewater samples and analysis of reference mineral sample.
EXPERIMENTAL Reagents
All chemicals were of analytical reagents grade or the highest purity available from Fluka and deionized water was used throughout the study.
Os(VIII) stock solution was prepared by dissolving 1.0 g of osmium tetraoxide from a sealed ampoule in about 100 mL of 0.2 mol L-1 sodium hydroxide solution in a glass stoppered one liter
volumetric flask. The solution was then made up to the mark with deionized water and standardized iodometrically23. The working standard solutions were prepared by diluting the stock solution as required.
Janus Green 6.0 × 10⁻⁴ mol L-1 solution was prepared by dissolving 0.0307 g of its powder in 100 mL of water.
The borate, bicarbonate and ammonical buffer solutions with different pH values were prepared by mixing 0.1 mol L-1 NaOH and 0.1 mol L-1 H
3BO3, 0.1 mol L
-1 NaOH and 0.1 mol L-1 NaHCO 3 and 0.1 mol L-1 NH
3 and 0.1 mol L -1 H
2SO4, respectively.
Hydrogen peroxide 0.215 mol L-1 solution was prepared from 30% m/v hydrogen peroxide stock solution and standardized iodometrically24. Apparatus
A Shimadzu spectrophotometer (160-A, Japan) with a glass cell of 1 cm path length was used for obtaining the absorption spectra and the absorbance measurements. A Rikakika thermostated water bath (UA-1, Japan) was used to keep the temperature of all solutions at the working temperature (25 ± 0.1°C). A Metrohm pH-meter (Swiss, 713) was used for pH measurements. A stop-watch was used for recording the reaction time.
Atomic absorption measurements were made with a Nippon Jarrell-Ash AA/AE spectrophotometer (Japan, AA-855) equipped with an auto-background corrector and graphite furnace atomiser (HU-10). An osmium hollow cathode lamp (Hamamatsu Photonics Co.) was used as the radiation source. In addition, all glassware were soaked in dilute nitric acid for 12 h and finally rinsed for three times with deionized water prior to use. Recommended procedure
To a series of 10 mL volumetric flask, 2.0 mL of buffer solution (pH 9.0), 0.5 mL of 6.0 × 10⁻⁴ mol L-1 of JG, 1.0 mL of 100.0 ng mL-1of Os(VIII) were added. The solution was diluted to ca. 8 mL with water. Then, 0.03 mL of 0.215 mol L-1 of H
dilution to 10 mL with water. Time measurement started just after the addition of the oxidant solution. After thorough mixing, a portion of this solution was transferred to a cuvette and the absorbance was measured against water at 618 nm (λmax) and 25°C for fixed times of 30 and 300 s. The measurement was repeated with a solution in the absence of Os(VIII) to obtain the value for the uncatalyzed reaction (blank) and this blank value was subtracted from the catalysed reaction absorbance. The absorbance changes of the catalysed and uncatalyzed reactions were labeled “Ao and “Au, respectively. The calibration graph was constructed by plotting analytical signal (“A=”Ao - “Au) versus the osmium concentration.
Sample treatment for the determination of Os(VIII) using spectrophotometer
Standard mineral sample was treated as recommended by producer
Wastewater samples were filtered by Whatman (No. 1) filter paper. Then, 2 mL of nitric acid 10% was added and analysed as procedure. Procedure for the determination of Os(VIII) using GF-AAS
In order to deter mine osmium in wastewater, graphite furnace atomic absorption spectrometer (GF-AAS) using thiourea as matrix modifier was used because it is simple, accurate and sensitive.
Sample treatment performed as follows. To the 50 mL of sample solution, 5mL of hydrogen peroxide 10 % was added for oxidizing osmium. The solution was treated with 4 mL of hydrochloric acid 12 mol L-1 and 1 mL of thiourea solution 0.1 g mL-1 to for ming soluble red complex, [Os(NH2CSNH2)6]OHCl3. Then, this solution was transferred into a 100 mL volumetric flask and filled up to volume with water. If required for the atomic absorption measurements, the solution was further diluted with thiourea solution.
The operating current was 15 mA and the measuring wavelength as 290.9 nm. The atomiser temperature was monitored with a photodiode using an optical pyrometer for calibrating the temperature. During all measurements, an argon gas flow rate of 2.0 L min-1 was used. The sample was dried at
160 °C for 50 s, ashed at 500 °C for 30 s and atomised at 3180 °C for 10 s. For the atomisation, a ramp mode was used. The atomisation temperature was increased according to a heating rate of 2.9 °C ms-1. The cleanup stage was carried out at 3210 °C for 2 s (6).
RESULTS AND DISCUSSION
JG (3-diethylamino-7-(4-dimethylamino phenylazo)-5-henylphenazinium chloride) is an azo dye (see scheme 1 for molecular structure) that can be oxidized by oxidizing agents such as peroxodisulphate25, bromate26 and hydrogen peroxide to produce a colorless oxidized form. In the presence of traces of Os(VIII), JG is oxidized by hydrogen peroxide in alkaline media, hence increasing the rate of reaction. This reaction proceeds slowly in the absence of osmium as a catalyst. The decrease in absorbance, i.e. decrease in the concentration of JG, was measured at 618 nm.
Optimization of reaction variables
In order to find the optimum conditions, the influence of reagents concentration, pH, temperature and time on the reaction rate was studied based on fixed time method. The optimum conditions used for the final working procedure were chosen as a compromise in order to ensure low blank values, extended linearity and shor t measuring time.
Effect of pH
A total of three buffer solutions (borate, bicarbonate and ammoniacal buffer) were tested for the pH adjustment. In the ammoniacal buffer medium, the catalytic effect of osmium was not observed. The rate of uncatalyzed reaction in presence of bicarbonate buffer solution was very high. In borate buffer media, the rate of uncatalyzed reaction was ver y low, but the reaction was catalyzed at trace level of Os(VIII). Thus, borate buffer selected for the pH adjustment.
The influence of pH on the reaction rate of 3.0 × 10"5 mol L-1 JG in the presence of 1.7 × 10 -3 mol L-1 H
2O2 and 1.0 mL of 10.0 ng mL
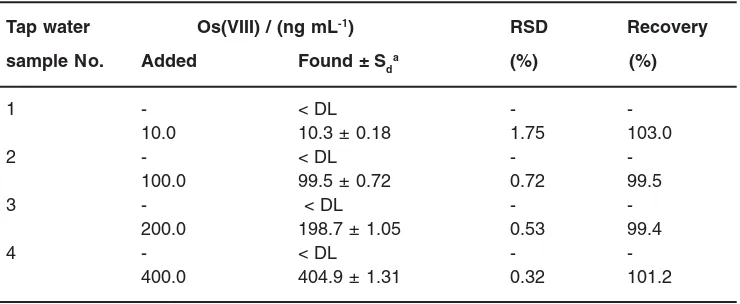
Table 1: Accuracy and precision of proposed method.
Tap water Os(VIII) / (ng mL-1) RSD Recovery
sample No. Added Found ± Sda (%) (%)
1 - < DL -
-10.0 10.3 ± 0.18 1.75 103.0
2 - < DL -
-100.0 99.5 ± 0.72 0.72 99.5
3 - < DL -
-200.0 198.7 ± 1.05 0.53 99.4
4 - < DL -
-400.0 404.9 ± 1.31 0.32 101.2
a Mean±/standard deviation (n= 5).
Table 2: Tolerance limit of interfering species on the determination of 40.0 ng mL-l Os(VIII)
Interfering species Tolerated ratio,
(ion: Os(VIII)) Na+, K+, Mg2+, Ca2+, Hg2+, Ag+, Fe2+, Fe3+ 5000
NO3¯, CO 3
2–, HCO 3
–, S 2O8
2-,SO 4
2–, HSO 4
–, PO 4
3–, CH 3CO2
–, BO 3
3–, CN–, F- 5000
Cl¯, Br¯, I¯ 4500
Zn2+, Cu2+ 2000
Pt4+ 1200
Pd2+ 800
Mn2+, Pb2+, Cd2+ 650
Ni2+, Cr 6+ 50
Cr3+, Co2+ 20
NH4+ 1
Table 3: Determination of Os(VIII) in mineral sample.
Sample Found±Sda Standard value RSD% t testb
(g/T)c (g/T)
Mineral sample of the 0.7552 ± 0.041 0.7500 3.97 0.29 geological system of
China (No. 4251.3)
a Mean±/standard deviation (n= 5).
b Tabulated t-value for 4 degrees of freedom at P (0.95) is 2.776.
c Weight of osmium per ton of ore.
measured at maximum wavelength of JG and at the corresponding pH was recorded as a function of time. The results are expressed graphically in figure 1 and pH 9.0 was selected as optimum.
Effect of buffer volume
Scheme 1: Molecular structure of Janus Green B (3-diethylamino -7- (4- dimethylaminophenylazo)-
5-phenylphenazinium chloride)
0.05 0.09 0.13 0.17
0.2 0.6 1 1. 4 1. 8
[H2O2] / m M
?A
Fig. 3: Effect of hydrogen peroxide concentration on reaction rate. Buffer (pH 9.0); 1.0 mL, Janus Green; 0.5 mL (6.0 × 10⁻⁴
mol L-1), Os(VIII); 1.0 mL (100.0 ng mL-1), temperature; 25 °C, time; 300 s Fig. 1: Effect of pH on reaction rate. Buffer
volume ; 1.0 mL, Janus Green; 0.5 mL (6.0 × 10⁻⁴ mol L-1), Os(VIII); 1.0 mL (100.0 ng mL-1), H
2O2, 0.03 mL (0.215 mol L-1), temperature; 25 °C, time; 300 s
0.04 0.08 0.12 0.16
0 12 24 36 48
[Ja n us G re en ] / µM
?A
Fig. 2. Effect of Janus Green concentration on reaction rate. Buffer (pH 9.0); 1.0 mL, Os(VIII); 1.0 mL (100.0 ng mL-1), H
2O2, 0.03 mL (0.215 mol L-1), temperature; 25 °C, time; 300 s. higher sensitivity and was selected for further works.
Effects of reagents concentrations
The influence of JG concentration on the reaction rate was studied in the range of 6.0 × 10⁻⁶ to 4.2 × 10⁻⁵ mol L-1. Decrease in absorbance increases with increasing JG concentration up to 3.0 × 10 5 mol L-1 of JG. (Fig. 2). This change in absorbance is maybe due to reduce of oxidation rate at higher concentrations of JG that lead to decrease in change in absorbance (∆A).
From the analytical point of view, the JG concentration should be used that provides an absorbance in the range of minimum photometric error. Therefore, 3.0 × 10 5 mol L-1 of JG was chosen as the most suitable concentration.
As shown in Fig. 3, the effect of hydrogen peroxide concentration on the catalyzed and uncatalyzed reactions was monitored in the range of 4.3 × 10 4 to 1.7 × 10 3 mol L-1 of H
of JG increases. O2 as a product of hydrogen peroxide decomposition was observed as bubble on wall cell and “A reduces. Therefore, 1.3 × 10 3 mol L-1 of hydrogen peroxide was chosen as the optimum concentration of oxidant.
Effects of temperature and time
Temperature effect on the rate of reaction was studied in the range of 15 to 45 °C under optimum reagents concentration. Increasing the temperature up to 25 °C caused an increase on the change in absorbance, whereas at higher temperatures, the change in absorbance decreased. The decrease in the reaction rate at higher temperatures may be due to partial decomposition of hydrogen peroxide. Thus, 25 °C was selected as optimum.
Optimized time was found by measuring the absorbance during 30 to 300 s. The decrease in absorbance occurred up to 150 s. At still higher time, the rate was almost constant. Thus, 150 s was selected optimum.
Calibration graph and detection limit
Calibration graph was obtained by applying the fixed time method under the optimum conditions. A plot of the absorbance changes after 150 s versus Os(VIII) concentration in the reaction mixture was linear in the range of 0.4 – 430.0 ng mL-1 of Os(VIII). The linear regression equation is given in Eq. (1).
∆A = 0.0011 [Os (VIII)] + 0.0981
(R2=0.999) ...(1) Experimental detection limit (3Sb/m) was 0.08 ng mL-1 Os(VIII) that S
b is standard deviation of blank for ten replicate and m is the slope of calibration graph.
Accuracy and precision
Standard addition method used for verifying the accuracy and precision of Os (VIII) determination in tap water samples. As can be seen in Table 1, the Os(VIII) recoveries from the tap water are quantitative.
Interference studies
In order to investigate the analytical applicability i.e. selectivity, the effect of most
T
a
ble 4:
Determination of Os(VIII) in waste water Os(VIII) / (ng mL -1) Statistical P roposed method GF-AAS a test Sample Ad ded Found a Reco ver y% RSD% Found a Reco ver y% F test b W aste w ater (1)
-5.2 ± 0.13
-2.50 5.1± 0.10 -1.69 10.0
15.7 ± 0.30
103.3
1.91
15.5 ± 0.32
102.6
1.34
20.0
25.8 ± 0.47
102.4
1.82
25.4 ± 0.40
101.2 1.38 W aste w ater (2)
-16.7 ± 0.49
-2.93
17.2 ± 0.38
-1.66
20.0
37.7 ± 0.51
102.7
1.35
37.4 ± 0.59
100.5
1.34
40.0
55.8 ± 0.49
98.4
0.88
56.4 ± 0.64
98.6 1.70 W aste w ater (3)
-100.8 ± 1.21
-1.20
100.2 ± 0.97
-1.56 100.0 199.8 ±1.94 99.5 0.97
202.1 ± 1.32
100.9
2.16
200.0
302.8 ± 2.09
100.6
0.69
300.1± 2.22
99.9
1.13
a Mean±/standard de
viation (n= 6).
b T
a
b
ulated F-v
alue f
o
r (5,5) deg
rees of freedom at
P
common cations and anions in real samples investigated. A foreign ion was considered to interfere significantly when it gave a Os(VIII) determination error of more than 5.25% (three times of relative standard deviation of blank at 40.0 ng mL-1 of Os (VIII)). The results are given in Table 2. From the results, it is shown 19 ions do not affect on the determination of Os (VIII) when they are present in 5000-fold excess and most of the remaining ions can be present in a 650-fold excess without any significant interferences. The most important interferences are from Co(II) and Cr(III) while Ni(II) and Cr(VI) interfere to a lesser than 50 fold. NH4+ has serious interfering effect on the catalytic determination of Os(VIII).
Also, in order to remove of interfering ions at very high concentrations, a single extraction of osmium as osmium tetraoxide into isobutyl methyl ketone (IBMK) can be used. Osmium tetraoxide can easily be extracted into IBMK in the pH range 2.1 – 9.5; whereas other ions are not extracted. When the organic phase was shaken with sodium hydroxide solution 0.5 mol L-1, osmium tetraoxide was back-extracted into the aqueous phase7. Applications
The proposed method was applied to the determination of osmium in standard mineral sample of geology (Table 3). Results of wastewater (provided from several biological and medical
Table 5: Removal of interfering ions for determination of Os(VIII) in synthetic samples Sample Os(VIII) / ng mL-1 RSD Recovery
(40.0/ µg mL-1 present founda % %
of each species)
Pd+2, Cu+2, Ni+2 40.0 39.82 ± 0.44 1.10 99.55 Pt+2, Co+2, Mn+2 40.0 41.02 ± 0.57 1.39 102.55 Pb+2, Cu+2, Pt+2, Pd+2 40.0 40.78 ± 0.84 0.84 101.95 Cr+3, Cd+2, Pd+4 40.0 39.42 ± 0.69 1.75 98.55
laboratories in Tehran) analysis were compared with analysis by graphite furnace atomic absorption spectrometry. Statistical test (F test) was used for confirming of precision of proposed method. As can be seen, statistical test results have noticeable difference to critical value. Results are given in Table 4. Moreover, the proposed method was applied to the determination of Os(VIII) in four synthetic samples and results are shown in Table 5. In all cases, concentration of foreign species considered 40.0 µg L-1 (1000 fold of presented Os(VIII) concentration).
CONCLUSION
This study reports a very sensitive and
highly specific spectrophotometric method for trace determination of Os(VIII) using JG as a new reagent. The method possesses distinct advantages over existing methods in cost, simplicity, ease of operation and applicable to real samples. The deter mination can be carried out at room temperature and at lower reaction time.
1. Greenwood N.N. and Ear nshaw A., Chemistr y of the Elements, (2nd ed.), Oxford:Butterwor th-Heinemann, 1113 (1997).
2. Barnard C. F. J., Platinum Metals Rev., 48: 157 (2004).
3. Luttrell W. E. and Giles C. B., J. Chem. Heal. and Safety, 14: 5 (2007).
4. Bozzola J.J. and Russell L.D., Electron microscopy: principles and techniques for biologists. Sudbury, Mass. Jones and Bartlett. 21(1999).
5. Rao C. R. M. and Reddi G. S., Trends Anal. Chem., 19: 565 (2000).
6. Suzuki T., Miyada M., Ohta K., Kaneco S. and Mizuno, T. Mikrochim Acta, 129: 259 (1998).
7. Akhoond A., Ensafi A. A., Massoumi, A. and Safavi A., Microchem. J., 45: 365 (1992). 8. Hirata T., Akagi T., Shimizu H. and Masuda
A., Anal. Chem., 61: 2263 (1989).
9. Gregoire D.C., Anal. Chem., 62, 141(1990). 10 Matusiewicz H. and Barnes R. M., Acta Chim.
Hung., 125: 777(1988).
11. Wan J. and Jin Z., Guangpuxue Yu Guangpu Fenxi, 48: 9 (1989).
12. Smolander K., Kauppmen M. and Mauranen R., Analyst, 113: 273(1988).
13. Zolotov Y.A., Varshal G.M. and Ivanov V.M., Analyticheskaya Khimiya Metallov Platinovoi
Gruppy (Analytical Chemistry of Platinum-Group Metals), Editorial URSS, Moscow, 124 (2003).
14. Balcerzak M. and Marczenko Z., Microchem. J., 30: 397 (1984).
15. Balcerzak M., Anal. Chim. Acta, 242: 185(1991).
16. Mori I., Fujita Y., Toyoda M. and Hasegawa Y., Talanta, 39: 535(1992).
17. Ensafi, A. A. and Safavi A., Anal. Chim. Acta, 244: 231(1991).
18. Ensafi A. A. and Shamss - Sollari E. S., Indian J. Chem. A, 34: 1005 (1995).
19. Ensafi A. A. and Shamss - Sollari, E. S. Talanta, 41: 1651 (1994).
20. Ensafi A. A., Anal. Lett., 29: 1177 (1996). 21. Manzoori J. L., Sorouraddin M. H. and Amjadi
M., Talanta, 53: 61 (2000).
22. Balcerzak M., Anal. Sci., 18: 737 (2002). 23. Gowda A. T., Gowda, H.S and Gowda
N.M.M., Analyst, 109: 651 (1984).
24. Kolthoff I.M., Belcher R., Stenger V.A. and Matsuyama G., Volumetric Analysis, vol. 3, InterScience Publishers, Wiley, New York, 698 (1957).
25. Safavi A. and Mirzanjani R., Anal. Sci., 18: 329 (2002).
26. Abbasi S., Esfandyarpour M., Taher, M. A. and Daneshfar, A., Spectrochim. Acta A, 67: 578 (2007).