DOI: 10.14738/abr.79.6922.
Weisgerber, J., & Ahmed, M. S. (2019). Motivation Based on Customer Interaction Are Automotive Product Development Engineers at a Disadvantage? Archives of Business Research, 7(9), 71-88.
Motivation Based on Customer Interaction Are Automotive
Product Development Engineers at a Disadvantage?
John Weisgerber
Graduate Student,
Engineering Management; School of Engineering Eastern Michigan University. Ypsilanti, Michigan, USA.
Muhammad S. Ahmed, Ph.D
Professor,
Engineering Management; School of Engineering Eastern Michigan University. Ypsilanti, Michigan USA
ABSTRACT
Many factors and theories of motivation apply broadly to workers regardless of profession. The prior research has shown that engineers and knowledge workers are highly motivated by intrinsic and non-monetary factors such as challenging work, recognition for good results, and the opportunity for professional growth. Therefore, the nature of their assigned tasks and their ability to complete their work in an efficient and robust way are highly related to motivation. Product Development Engineers (PDEs) play a crucial role in creating value and revenue for companies via the development of useful new products for customers. It is, however, a general observation that PDEs in automotive companies, especially at original equipment manufacturer, OEM, levels, often have minimal or no interaction with the end customer. With the advent of hybrid, electric, and autonomous vehicles, PDE working in automotive industry, APDEs, has seen a shift in their role and responsibilities from traditional automotive PDEs. APDEs mostly receive customer input indirectly from management or through a marketing organization. This is in contrast to other professionals such as doctors, lawyers, and architects who frequently interact directly with their customers. This paper presents the finding of a qualitative research, examining the relationship between APDEs interaction with customers, and achieving clear customer inputs. The paper investigates differences among various types of APDEs and seeks further insights as to the motivational impact of customer inputs on automotive PDEs. It also probes the question if there are any differences among various types of automotive PDEs when it comes to motivation. The paper concludes that, for some types of APDEs, the lack of customer interaction is a motivational disadvantage while for the others it is not. It also conclude that further research needs to be conducted in order to find the reasons for such discrepancies.
Keywords—Product development engineers; automotive; motivations; customer requirements;
INTRODUCTION
Research on motivation and the differences and similarities for engineers vs. other professionals supports a general conclusion that engineers are more highly motivated by intrinsic rather vs. extrinsic factors [1], [2], [3]. Intrinsic motivation is internally derived based on an individual’s own aspirations or the nature of the work, whereas extrinsic motivation would come from external motivation factors like the promise of good pay, or avoiding punishment (the so-called “carrot and stick” approach), [1].
[4], which is in opposition to the desire. Such PDEs have to complete their tasks in a complete vacuum [2], [5], [3]. All PDEs, just like any other problem-solvers, want to provide excellent solutions for customers and achieve recognition for that work. Whether they communicate directly with customers or not, like with automotive PDEs, they should recognize the value of proper customer inputs as key to performing with excellence and therefore a considerable aspect of their motivation. As the automotive industry moves from traditionally driven cars to hybrid, electrical, and autonomous vehicles, there has been a shift in the job descriptions and requirements of PDEs. These Automotive PDEs can be divided into two distinctive categories, those working on artificial intelligence (AI),hardware/software, embedded system, etc. let’s call them AI/Software PDES or ASPDEs and all other PDEs working in the traditional design and manufacturing environment, known as Design and Manufacturing PDEs or DMPDEs.
Clear and realistic customer requirements for product development is an essential motivator for engineers [6], but in their automotive professional life, the authors have witnessed concerns expressed that the level of detail presented by marketing in requirements is not always enough to enable clear product design directions for PDEs. For example, when making machines to inspect circuit boards, (CB), the marketing input would consist of unrealistic requirements of having the CB work twice as fast with the minimum cost. APDs do understand that these are unrealistic or unhelpful requirements; therefore, they would just do what was seen as practical could to improve the CB design, which could have been better designed if the customer requirements were obtained directly. Another example of incomplete customer requirement definition by marketing is in the development of software for an embedded vehicle system where the marketing requirement asks for the “passwords for different users of the software" but does not provide the needed details of how the passwords would be applied or what operations will be performed. The result is a minimal software implementation. When the function was tested, it was clear that the customer would need to be able to read back the existing software users and have a way to manage the users and their passwords. Software was redesign to achieve this requirement and extra functionality. Such modifications result in a waste of time and effort for PDEs while costing companies millions in engineering changes. One can thus theorize that PDEs are not motivated enough, compared to other professionals such as doctors, lawyers, and architects, because they often do not interact directly with the actual customers of their work. In such cases, the PDEs receive their understanding of requirements/goals and the feedback about the results of their work indirectly.
RESEARCH QUESTIONS
This research investigated the lack of Automotive PDE, APDE, interaction with the customer, and the ways such interaction correlates to unclear customers’ inputs. The study further examined if the APDE’s isolation influences their motivation.
Question 1) Is there any difference in how automotive PDEs and other professionals get motivated when it comes to customer interaction levels?
Question 2) Do higher interaction levels between automotive PDE and their customer correlate to the clarity of customer inputs?
Question 3) Is there any difference between various types of automotive PDEs when it comes to the correlation of their higher customer interaction levels and the clarity of customer inputs?
Question 4) Does the isolation of PDEs from the customer result in higher frustration and poor motivation?
To provide further understanding relating to the PDEs isolation from the customer vs. their motivation. The following hypotheses based on expectations from the previous research and some new specific research questions are proposed:
Hypothesis A) Automotive PDEs are motivated in the same way as other professionals.
Hypothesis B) Customer level of interactions will motivate various types of Automotive in the same way.
Hypothesis C) Automotive PDEs will express a positive motivational impact from clear customer inputs independent of their level of customer interaction.
Hypothesis D) The level of interaction between customers and the Automotive PDEs is positively related with clear customer inputs
Hypothesis E) Poorly defined customer requirements causes frustration for automotive PDEs and reduces their motivation.
LITERATURE REVIEW Automotive Engineers
Automotive companies employed several types of engineers. Traditionally, most of these engineers work on how to manufacture a vehicle for a specific price point, considering factors such as weight, gas mileage, cost of materials, and aerodynamics. These engineers usually have mechanical, electrical, chemical, and manufacturing engineering degrees [7]. With the advent of hybrid, electrical, and autonomous vehicles, the job requirements at automotive companies are also changing. In the past decade, apart from automotive companies are hiring engineers with degrees and background in Robotics, Control engineering, hardware and software engineering, machine learning, artificial intelligence industrial engineering, cybersecurity, etc. Finally, autonomous vehicles, although more advanced than traditional automobiles are still cars/vehicles at their core. Therefore, all the skills that were required in traditional automotive manufacturing are still needed.
Engineers are Theory Y
The motivation of employees in the workplace is a highly researched topic. A number of general theories related to motivation have been put forth, and much research on specific aspects of motivation has been published. Numerous motivational theories date back at least as far as Maslow’s well-known “Hierarchy of Needs” from 1954. Maslow stated that as basic needs are met, higher-level or more intrinsic needs become more critical in motivation. Babcock & Morse [1] provide a good summary of some of these critical methods and their application to provide motivation and leadership for engineers. They divide motivational theories into the two broad categories of content theories and process theories. Content theories focus on motivation from people’s desires to fulfill various needs. Process theories assume motivation comes from more rational choices made to achieve specific outcomes.
These categories correlate with the idea of intrinsic vs. extrinsic motivation but also fit well with McGregor’s “Theory X and Theory Y” from 1960. Theory X motivation is basically the approach to motivation which assumes a worker is inherently lazy and must be forced or otherwise cajoled to work (extrinsically), and theory Y motivation is that with the right conditions and enablers in place, people will actually take responsibility for their own work (intrinsically). The well-known management consultant and author Peter Drucker stated that Theory Y is a necessity for dealing with knowledge workers: “The knowledge worker simply does not produce under theory X. Knowledge has to be self-directed; the knowledge worker has to take responsibility.” [1].
Isn’t a Good Salary Enough Motivation?
Quite a bit of the research finds traditional motivation as from necessary salary increases or “Human Resources Management” is not the optimal approach to motivation in the modern workplace. Njoroge & Yazdanifard [5] claim that emotional and social intelligence is the fundamental abilities for leaders to keep in touch with the “values and attitudes” of workers from different generations to help create satisfaction and motivation for the workers. Social intelligence means understanding and getting along well with others and keeping the best interest of others at heart. Emotional intelligence is managing and reacting to emotional states for the best outcome. From their abstract: “...it is crucial for organizations to recognize that employee motivation goes beyond the usual monetary reward systems for a multigenerational workforce. In motivating today's human capital, organizations have to engage their minds and captivate their hearts, which can be achieved by incorporating social and emotional intelligence.” In a paper studying the personal development review (PDR) vs. motivation for engineers, Baldwin et al. [8] found that 83% of engineers did not think their PDR process was a motivator for career skill development. Also seventy-seven percent stated the PDR did not give enough recognition for accomplishments. The PDR process could be motivational but often is not. In fact, it can be a motivational barrier. To make it more motivational, it should help individuals to achieve their career development goals.
expected as “normal,” it is no longer a real motivator. Nujjoo & Meyer [10] surveyed employees throughout South Africa to try to understand the relationship of intrinsic non-monetary rewards, extrinsic non-non-monetary rewards, and extrinsic non-monetary rewards. The conclusion is that primarily intrinsic rewards (emotional satisfaction derived from your work) lead to intrinsic motivation. Their resulting advice was this: “South African employers thus need to take cognizance of the fact that monetary rewards seem to have less relevance in creating and maintaining a motivated and committed workforce in comparison to non-monetary and in particular intrinsic rewards.” In a paper on motivating technical visionaries, Hebda et al. [11] look at motivation strategies for “exceptional, high-performing technologists” - the small subset of exceptional employees that create breakthroughs. They are motivated internally (intrinsically) because they want to have their ideas become a reality. Culture, teamwork, working with other creative people, and recognition of their contribution are essential to them as motivators. An exciting conclusion was that Human Resource Managers were too far removed from the technical visionaries to understand them or how they are motivated. Lord & Farrington [12] consider whether age and generational differences exist in motivational factors for knowledge workers. They uncover some differences; for example, meeting necessities is more critical to the younger worker just becoming financially stable. However, there was no correlation found between job satisfaction and age. Also, across age groups of knowledge workers: “A strong intrinsic motivator for both age groups is the fact that they enjoy and take pride in the job they do.” That conclusion supports the idea that factors that enable doing a good job, like having proper requirements, are motivational for knowledge workers.
Motivating Product Development Engineers?
the topic being researched, they conclude that clarity of project targets and shared knowledge have positive and significant impacts on product development productivity. In the authors’ view, that increased productivity supports the idea that motivation is improved by those factors as well, and it seems possible that adequate access to customer requirements is the key to success in that expanded role. Finally, Ringen & Holtskog [6] looked at whether 1) clear goals as embodied by clear customer requirements, 2) teamwork, and 3) general focus on continuous improvement techniques/activities are motivational for engineers working for Norwegian automotive suppliers. The conclusion from their research was that of those three; only clear customer requirements are highly linked to motivation. As they state, [6]:
“Accomplishing CR [customer requirements] is the primary activity by product developers, and therefore believed to be in closer proximity to an engineer than the other variables.”
RESEARCH METHOD Population and Sample
The aim of the study is to increase understanding of the motivation of Automotive Development Engineers and Management within engineering firms as it relates to capturing customers’ requirements. The population under consideration is Automotive Product Development Engineers. The pilot was conducted on the Engineering Management Program students of Eastern Michigan University, the majority of whom are employed in the automotive industry or by tier-one suppliers who design products for the automotive industry, as well as employees of firm designing products for general industrial automation.
Methodology
During the beta testing, the research method used for the subject study work is a simple online survey instrument tool. Such tools help in collecting essential data within a short time duration while helping to collect respondents’ demographic information. The future study phases, designed to expand the research, will include follow-up questions through interview and further refined testing. The survey starts with demographic questions followed by 12 additional statements which are to be rated on an appropriate Likert scale. The scale range utilized for the study uses values from one to five and is respectively described or categorized over that one to five scoring range using a descriptive scale: (a) strongly disagree, (b) disagree, (c) neutral, (d) agree, and (e) strongly agree. Finally, the approach used with the online survey tool used for testing also provides automatic geographic information as well as completion time and date data to assist with a better assessment of respondent information and response.
DATA ANALYSIS Reliability of the Survey Instrument – Cronbach’s Alpha
Reliability analysis was conducted on the 42 responses in the survey instrument. In Table 1, Cronbach’s alpha showed the survey instrument was reliable, α = 0.8101. Most items merit retention, i.e., resulting in a decrease in alpha, if deleted. There are seven exceptions, and if were removed, even then increase in alpha would be insignificant.
Table 1. Study Reliability Analysis Cronbach’s
Alpha Cronbach’s Alpha Based on Standardized Items Items
Results – Initial Impressions
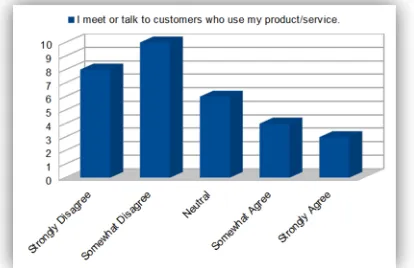
To perform the basic analysis, descriptive statistics were performed. Of approximately 120 individuals surveyed, 42 respondents chose to reply and of those 23 were classified ASPDE, and 19 others as DMPDE. The resulting PDE data evaluations can then be used for comparisons and to help answer the research questions. By inspecting the histograms of the Likert scale responses to the 12 evaluated statements, it can be seen that a substantial number of respondents do not frequently interact with customers (Fig1 and Fig 5).
Figure 1. Response to the question; “I meet or talk to the customer who use my product.
Figure 2. Response to the question; “I talk to the end customer of my product or service directly whenever I need to”.
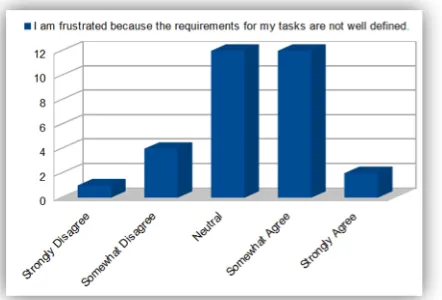
Figure 3. Response to the question; “I am frustrated because the requirements for my task are not well defined”.
Figure 4. Response to the question; “I have a clear understanding of what the customer need”.
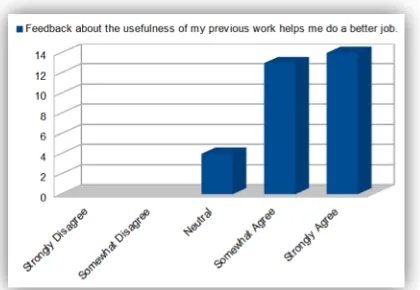
Also, the strongly positive responses from PDE to enjoy their work more when the task is clearly defined. (Fig 5) and when the feedback about the usefulness of my previous is provided to them (Fig 6), are simple validation that well-defined tasks and good feedback are relevant to the engineers’ level of intrinsic motivation.
Figure 6. Response to the question; “Feedback about the usefulness of my previous work helps me to do a better job”.
Analysis
Three composite variables have been derived from the responses to answer the research questions. Positive Impact of Customer Input (PICI) is calculated by averaging the responses from these three related statements:
• Understanding what the customer wants helps me do the best job on my tasks.
• I enjoy my work more when the task is clearly defined.
• Feedback about the usefulness of my previous work helps me do a better job.
The second composite variable is Clarity of Customer Input (CCI). It is calculated for each respondent by averaging the responses from these four related statements:
• I have a clear understanding of what the customer needs.
• I can get more information about the customer’s requirements at any time.
• I get clear feedback on how well my completed tasks are meeting the customer's needs.
• After a project is completed, I find out what the customer thinks of it.
Finally, the third composite variable, Customer Interaction Level (CIL), is defined as the average of the responses from these three related statements:
• I meet or talk to customers who use my product/service.
• I talk to the end customer of my product or service directly whenever I need to.
• My information on customer requirements comes indirectly (as from a marketing group).
The last statement’s result is inverted for the average since it is negatively associated with customer interaction.
Further statistical analysis is performed using those composite variables.
Hypothesis A) Automotive PDEs are motivated in the same way as other professionals:As noted in the literature review professionals usually interact with their customers directly, and their motivation towards work relates to it or by intrinsic and non-monetary factors. For a coefficient, r1 between CIL and PICI, the hypothesis is:
H0: r1 = 0 versus H1: r1 ≠ 0.
motivated when the interaction between customer increases and behave in the same way as other professionals.
Table 2. Pearson Correlation For PDE
PICI CCI
CCI 0.37
0.044
CIL 0.223 0.664
0.236 0.000
Cell Contents: Pearson correlation P-Value
Hypothesis B) Customer level of interactions will motivate various types of Automotive in the same way:The Automotive PDEs data is divided into two major types of automotive PDEs; namely ASPDEs and DMPDEs. Next, hypothesis B is tested through correlation and two-sample t-test methods.
For correlation, ASPDE and DMPDE data were used. The following hypothesis was tested, for ASPDM coefficient, r2 and another one for DMPDE coefficient, r3 between CIL and PICI.
H0: r2 = 0 versus H1: r2 ≠ 0. (for ASPDEs)
H0: r3= 0 versus H1: r3 ≠ 0. (for DMPDEs)
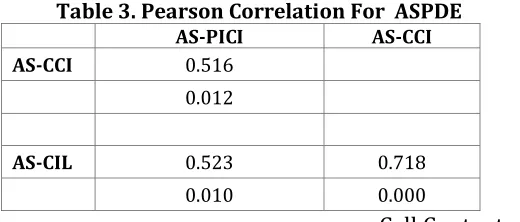
The analysis, table III, suggests that for ASPDEs the hypothesis is rejected (p-value less than 0.05) and ASPDE behave in the same way as any professional.
Table 3. Pearson Correlation For ASPDE AS-PICI AS-CCI AS-CCI 0.516
0.012
AS-CIL 0.523 0.718
0.010 0.000
Cell Contents: Pearson correlation P-Value However, DE-PDE results were very different. It concludes that one cannot reject the null hypothesis, (r3 = 0) as the p-value is greater than 0.05, (0.223), table #. Therefore, the level of customer interaction does not affect DMPDEs motivation.
Table 4. Pearson Correlation For DMPDE DM-PICI DM-CCI DM-CCI 0.269
0.265
DM-CIL 0.286 0.353
0.236 0.138
Next, using the level of customer interaction is a predictor of the quality of customer inputs to their work; it is investigated if the ASPDEs and DMPDEs have similar interaction with the customer.
Ho : Difference = μ CIL(DMPDM)- μ CIL-(ASPDM) = 0 H1: Difference = μ CIL(DMPDM)- μ CIL-(ASPDM) ≠0
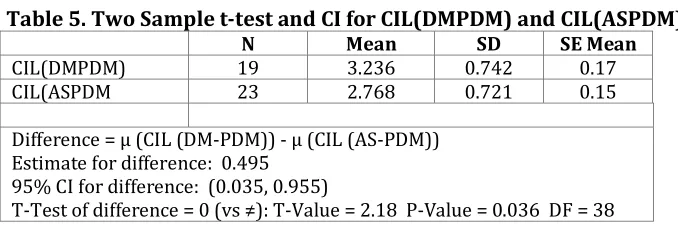
From the tables V, it can be concluded that most ASPDE respondents indicated a somewhat low level of customer interaction, mean of 2.768, compared to DMPDE, mean of 3.263. The 2-sample t-test results suggest that with p-vale < 0.5, there is a significant difference between the customer interaction levels as perceived by these two types of automotive PDEs.
Table 5. Two Sample t-test and CI for CIL(DMPDM) and CIL(ASPDM)
N Mean SD SE Mean
CIL(DMPDM) 19 3.236 0.742 0.17 CIL(ASPDM 23 2.768 0.721 0.15
Difference = μ (CIL (DM-PDM)) - μ (CIL (AS-PDM)) Estimate for difference: 0.495
95% CI for difference: (0.035, 0.955)
T-Test of difference = 0 (vs ≠): T-Value = 2.18 P-Value = 0.036 DF = 38
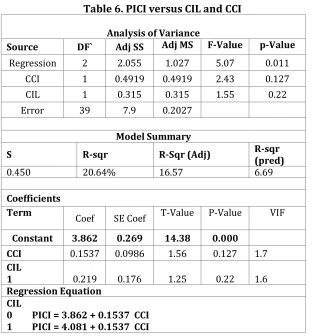
Hypothesis C) PDEs will express a positive motivational impact from clear customer inputs independent of their level of customer interaction: To test hypothesis C, a Linear Regression Model (LRM) was executed using PICI as a response, CCI as a continuous predictor and CIL as the categorical predictor. All CIL greater than 3 are treated as 1 while less than 3 are treated as 0.
The p-value for the regression model in the Analysis of Variance table VI shows that the model estimated by the regression procedure is significant at an -level of 0.05. This indicates that at least one coefficient is different from zero.
Table 6. PICI versus CIL and CCI
Analysis of Variance
Source DF` Adj SS Adj MS F-Value p-Value Regression 2 2.055 1.027 5.07 0.011
CCI 1 0.4919 0.4919 2.43 0.127 CIL 1 0.315 0.315 1.55 0.22 Error 39 7.9 0.2027
Model Summary
S R-sqr R-Sqr (Adj) R-sqr (pred)
0.450 20.64% 16.57 6.69
Coefficients
Term Coef SE Coef T-Value P-Value VIF
Constant 3.862 0.269 14.38 0.000 CCI 0.1537 0.0986 1.56 0.127 1.7 CIL
1 0.219 0.176 1.25 0.22 1.6 Regression Equation
CIL
0 PICI = 3.862 + 0.1537 CCI 1 PICI = 4.081 + 0.1537 CCI
The analysis of variance indicates that p-values for the estimated coefficients of CCI and CIL are both higher than a-level of 0.05, meaning that there is not enough evidence to show that CCI and CIL are significantly related to PICI.
The linear regression model analysis also indicates that CIL and CCI coefficients have p-values higher than 0.05 this their coefficients are zero while the Constant value has a significant effect (p-value = 0.00) on PICI.
The R2 value indicates that the predictors only explain 20.64% of the variance in PICI, which in
the case of human nature is a better prediction. The adjusted R2 is 16.57%, which accounts for the number of predictors in the model. The predicted R2 value is 6.69% that is not close to the
R2 and adjusted R2 values; the model does appear to overfitting and has inadequate predictive
ability.
From the two regression equations, table VI, for PICI, one can conclude that PICI is not effected by CCI at any levels of CIL. The hypothesis is thus rejected, and it is found that PDE/ APDEs will not express a positive motivational impact from clear customer inputs independent of their level of customer interaction.
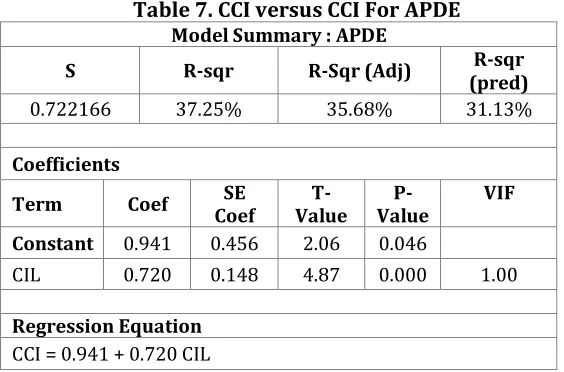
-level of 0.05, indicating that there is enough evidence to show that CCI and CIL are significantly related to each other.
Table 7. CCI versus CCI For APDE Model Summary : APDE
S R-sqr R-Sqr (Adj) (pred) R-sqr 0.722166 37.25% 35.68% 31.13%
Coefficients
Term Coef Coef SE Value T- Value P- VIF
Constant 0.941 0.456 2.06 0.046
CIL 0.720 0.148 4.87 0.000 1.00
Regression Equation CCI = 0.941 + 0.720 CIL
The R2 value indicates that the predictors only explain 37.25% of the variance in PICI, which in
the case of human nature is the right prediction. The adjusted R2 is 35.68%, which accounts for
the number of predictors in the model. The predicted R2 value is 31.13% that is close to the R2
and adjusted R2 values, indicating that the model has adequate predictive ability. The
hypothesis that the interaction between customers and all automotive PDEs is positively related to clear customer inputs.
Linear Regression Analysis, table VIII, for ASPDEs data suggests that the p-values for the estimated coefficients of CIL are less than -level of 0.05, indicating that there is enough evidence to show that CCI and CIL are significantly related to each other. The R2 value indicates
that the predictors only explain 51.49% of the variance in PICI, which in the case of human nature is a better prediction. The adjusted R2 is 49.18%, which accounts for the number of predictors in the model. The predicted R2 value is 41.07% that is close to the R2 and adjusted
R2 values, indicating that the model has adequate predictive ability. The hypothesis that the
interaction between customers and PDEs working on hardware/software, embedded system, etc. are positively related to clear customer inputs.
Linear Regression Analysis, table X1, for DMPDEs data suggests that the p-values, 0.138, for the estimated coefficients of CIL are higher than -level of 0.05, indicating that there is enough evidence to show that CCI and CIL are not significantly related to each other. The R2 value
Table 8. CCI versus CCI For ASPDE Model Summary : ASPDE
S R-sqr R-Sqr (Adj) (pred) R-sqr 0.643069 51.49% 49.18% 41.07%
Coefficients
Term Coef SE Coef T-Value Value P- VIF
Constant 0.329 0.543 0.61 0.551
AS-CIL 0.898 0.190 4.72 0.000 1.00
Regression Equation
AS-CCI = 0.329 + 0.898 AS-CIL
Table 9. CCI versus CCI For ASPDE Model Summary : DMPDE
S R-sqr R-Sqr (Adj) (pred) R-sqr 0.764624 12.47% 7.32% 0.00%
Coefficients
Term Coef SE Coef Value T- Value P- VIF Constant 2.2 0.812 2.71 0.015
DM-CIL 0.378 0.243 1.56 0.138 1.00
Regression Equation
DM-CCI = 2.200 + 0.378 DM-CIL
Hypothesis E) Poorly defined customer requirements causes frustration for PDEs and reduces their motivation:
Here it is required to test if there is a relationship between PDE’s frustration and poor customer requirements and whether PDE’s frustration relates to their motivation? Considering the response to “I am frustrated because the requirements for my tasks are not well defined.”, it can be seen that the majority of PDE respondents feel frustration due to poorly defined requirements for their tasks.
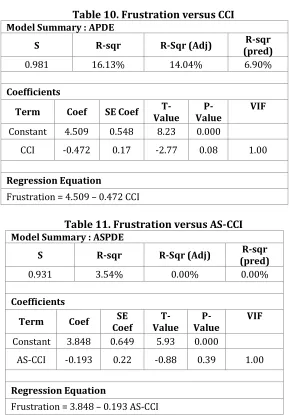
Studying the APDEs data using regression analysis, table X indicates that the coefficient for CCI has a p-value of less than 0.05, concluding that statistically, there is a significant relationship between frustration within APDEs and CCI. The coefficient for CCI is negative suggesting that frustration increases when clear customer inputs are low or when customer inputs are poorly defined.
Table 10. Frustration versus CCI Model Summary : APDE
S R-sqr R-Sqr (Adj) (pred) R-sqr 0.981 16.13% 14.04% 6.90%
Coefficients
Term Coef SE Coef Value T- Value P- VIF Constant 4.509 0.548 8.23 0.000
CCI -0.472 0.17 -2.77 0.08 1.00
Regression Equation
Frustration = 4.509 – 0.472 CCI
Table 11. Frustration versus AS-CCI Model Summary : ASPDE
S R-sqr R-Sqr (Adj) (pred) R-sqr 0.931 3.54% 0.00% 0.00%
Coefficients
Term Coef Coef SE Value T- Value P- VIF Constant 3.848 0.649 5.93 0.000
AS-CCI -0.193 0.22 -0.88 0.39 1.00
Regression Equation
Frustration = 3.848 – 0.193 AS-CCI
Finally, the same linear regression model analysis was applied for DMPDEs dataset for computing relationship between frustration and CCI, table XII. Study indicates that the coefficient for CCI has a p-value of 0.022, less than 0.05, concluding that statistically, there is a significant relationship between frustration within DMPDEs and CCI.
Table 12. Frustration versus AS-CCI Model Summary : DMPDE
S R-sqr R-Sqr (Adj) (pred) R-sqr
1.005 27.37% 23.09% 7.76%
Coefficients
Term Coef SE Coef T-Value P-Value VIF Constant 5.33 1.05 5.07 0.000
DM-CCI -0.756 0.299 -2.56 0.022 1.00
Regression Equation
Frustration = 5.333 – 0.756 DM-CCI
CONCLUSION, RECOMMENDATIONS AND FUTURE RESEARCH
The analysis presented here for Hypothesis C confirms previous research results that automotive engineers, overall, are motivated by clear customer inputs. However, hypothesis D indicated some exciting results. It concluded that although automotive engineers with new skill sets (such as hardware, software, and embedded system engineering) are motivated with a higher customer level of interaction, the traditional PDEs are not. It was also concluded that although the level of customer interaction for ASPDEs is lower than DMPDEs, even then the traditional PDEs are not motivated with more significant customer interactions.
Hypothesis A results are also very unique to APDEs. Hypothesis A was rejected, and it was concluded that clear customer inputs at any level of APDE and customer interactions had no effect on creating a positive impact on APDEs. These results were further investigated for ASPDEs and DMPDEs in hypothesis B. It was concluded that for both APDEs and ASPDEs clear customer inputs are related to the level of customer interactions while no such relationship exists for DMPDEs.
These results indicate that to obtain clear customer inputs, DMPDEs do not depend upon higher customer interactions. One reason can be that the traditional automotive engineer knows many of their customers’ requirements because everyone drives cars are also a customer. They know that for example, in a truck, people want things like power and excellent towing capacity. So maybe for DMPDEs, such customer requirements are clear to them. The question that remains unanswered in this study is what motivates DMPDEs?
Based on the above discussions, it was evident that APDEs and ASPDEs will get frustrated if they are unable to receive clear customer inputs while DMPDM will not. However, hypothesis C concluded otherwise. The analysis suggests that APDEs and ASPDEs won’t get frustrated when they receive less clear customer inputs while DMPDEs do get frustrated in that scenario. The direct survey results show clearly that PDEs often feel they do not have proper customer requirements or feedback for their tasks and that they are sometimes frustrated by poorly defined requirements.
These are surprising results, especially when one considers APDEs who indicated clear customer input might logically be less frequently frustrated by poor requirements. One possibility worth consideration can be the requirements, which are leading to frustration, may not be related to customer feedback. For example, they could be manufacturability, documentation, internal cost, or schedule requirements. Another observation is that while most respondents expressed some level of frustration due to poor requirements, 58% also expressed (somewhat or strongly agree) enjoyment in clarifying the details of a task, yet those PDEs still expressed frustration.
frustration with their requirements, but so do the APDEs who have more significant customer interaction. Question 2 and the further related questions raised by the data can’t be definitively answered by the data from the survey.
Figure 7. Positive responses to “Part of an enjoyable task is trying to clarify the details of what is needed”, graphed with same individuals’ responses to “I am frustrated because the
requirements for my tasks are not well defined”.
Automotive PDEs, as well as other PDEs, have a significant impact on competitiveness because they influence the efficiency of bringing new products to market as well as the quality of those products. The authors recommend that companies, which are structured in a way to isolate the development engineer from customers, should consider the results presented here and improve the availability and clarity of customer inputs to PDEs, especially ASPDEs. However, it is not clear what that best solution would be? Whether it is providing extensive direct interaction between APDEs and customers or some other level would be better? To answer these questions, one should consider the confidentiality concerns, feature creep, or interruptions as customers might seek direct support from APDEs. This lead into a future research question; whether such interaction might even be detrimental because of the APDEs’ personality traits or lack of business acumen? Practical alternatives may include better access to marketing efforts and utilization of lessons learned from past data. Using data analytics on artifacts such as Quality Functional Deployment (QFD), problem-solving documents, social media, etc. can also provide better customer inputs.
The authors also support the better implementation of the principles of Concurrent Engineering such as co-location of marketing personnel [1], or even encouraging limited customer interaction for select development engineers via conferences, trade shows, or focus groups for gathering customer inputs.
The study concludes that the data has not provided any clear guidance on the working of APDEs, especially the motivation aspect of DMPDEs and ASPDEs. Further research needs to be conducted with bigger sample size and by modifying survey questioner. It should be able to answer questions like; what are the reasons a majority of the respondents are frequently frustrated by poorly defined requirements? What aspects of their needs are poorly defined? Can the problem solving and naturally inquisitive nature of engineers be engaged to arrive at better conditions with less frustration? Etc.
References
Babcock, D., & Morse, L. (2014) Managing Engineering and Technology. Upper Saddle River, NJ, Pearson Higher Education, Inc.
Katz, R. (2005). Motivating Technical Professionals Today. Research-Technology Management, 48(6), 19-27. Retrieved from
http://ezproxy.emich.edu/login?url=https://search.proquest.com/docview/213803566?accountid=10650 Petronio, A., & Colacino, P. (2008). motivation strategies for knowledge workers: Evidence and challenges. Journal of Technology Management & Innovation, (3), 21-32. DOI:10.4067/S0718-27242008000100003
Hong, P., Vonderembse, M. A., Doll, W. J., & Nahm, A. Y. (2005). Role change of design engineers in product development. Journal of Operations Management, 24(1), 63-79. DOI:10.1016/j.jom.2005.03.002
Njoroge, C. N., & Yazdanifard, R. (2014). The impact of social and emotional intellegence on employee motivation in a multigenerational workplace. International Journal of Information, Business, and Management, 6(4), 163-170. Retrieved from
http://ezproxy.emich.edu/login?url=https://search.proquest.com/docview/1552838299?accountid=10650 Ringen, G., & Holtskog, H. (2013). How enablers for lean product development motivate engineers. International Journal of Computer Integrated Manufacturing, 26(12), 1117–1127.
https://doi.org/10.1080/0951192X.2011.593046
Vangelova, L. (2017). Automotive engineer. The Science Teacher., 84(4).
Baldwin, C., Arturo Garza-Reyes, J., Kumar, V., & Rocha-Lona, L. (2014). Personal development review (PDR) process and engineering staff motivation. Journal of Manufacturing Technology Management, 25(6), 827-847. Retrieved from
http://ezproxy.emich.edu/login?url=https://search.proquest.com/docview/1660773817?accountid=10650 Rahman, M., Mondol, D. K., & Ali, A. (2013). Nexus of employee motivation with HRM and workplace behavious: An assesment of the dominant factors. Management Research and Practice, 5(4), 49-57. Retrieved from
http://ezproxy.emich.edu/login?url=https://search.proquest.com/docview/1476274035?accountid=10650 Nujjoo, A., & Meyer, I. (2012). The relative importance of different types of rewards for employee motivation and commitment in south Africa. South African Journal of Human Resource Management, 10(2), e1-e10.
DOI:10.4102/sajhrm.v10i2.442
Hebda, J. M., Vojak, B. A., Griffin, A., & Price, R. L. (2012). Motivating and demotivating technical visionaries in large corporations: A comparison of perspectives. R & D Management, 42(2), 101.
Lord, R. L., & Farrington, P. A. (2006). Age-related differences in the motivation of knowledge workers. Engineering Management Journal, 18(3), 20-26. Retrieved from
http://ezproxy.emich.edu/login?url=https://search.proquest.com/docview/208954946?accountid=10650 Rumpel, S., & Medcof, J. W. (2006). Total rewards: Good fit for tech workers. Research-Technology Management, 49(5), 27-35. Retrieved from