http://www.sciencepublishinggroup.com/j/ijdsa doi: 10.11648/j.ijdsa.20180401.11
ISSN: 2575-1883 (Print); ISSN: 2575-1891 (Online)
Application of Data Mining Technology in the Loss of
Customers in Automobile Insurance Enterprises
Han Song, Han Qiuhong
Department of Statistics, Beijing Wuzi University, Beijing, China
Email address:
[email protected] (Han Qiuhong)
To cite this article:
Han Song, Han Qiuhong. Application of Data Mining Technology in the Loss of Customers in Automobile Insurance Enterprises.
International Journal of Data Science and Analysis. Vol. 4, No. 1, 2018, pp. 1-5. doi: 10.11648/j.ijdsa.20180401.11
Received: November 8, 2017; Accepted: December 4, 2017; Published: January 15, 2018
Abstract:
This paper is based on the customer churn data of auto insurance, construction of index system in three aspects: the customer information, the subject matter of the insurance information and hold product information; This paper uses decision tree and Logistic regression model to analyze the insurance company's customer data; The results show that: discount, total discount rate, total premium and other variables have a significant impact on customer churn, and get the loss probability of each customer and get some main features of lost customers.Keywords:
Customer Churn, Decision Tree, Logistic Regression, Auto Insurance Company1. Research Background
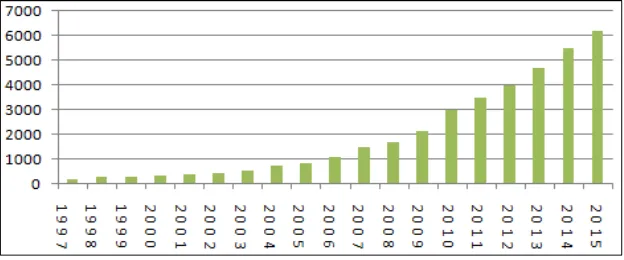
As people's living standards improve accordingly, the demand for automobiles is on the rise (the average annual growth rate of civilian car ownership is more than 10%). With the increase of the ownership of civilian vehicles, problems
such as traffic accidents and car claims also follow, further driving the further development of China's automobile insurance industry. Among them, motor vehicle insurance premium income increased from 209.23 billion yuan in 1997 to 619.9 billion yuan in 2015, showing an overall exponential growth. The specific trend shown in Figure 1:
Figure 1. Chinese motor vehicle insurance premium charts.
Customer is the foundation for the survival and development of an auto insurance company. As the number of customers who buy auto insurance increases, the competitiveness among auto insurance companies increases. Therefore, to maintain customers and prevent loss of customers as auto insurance companies focus on problem solving.
2. Literature Review on Customer Churn
Research
customer management, the analysis of customer churn and the construction of customer churn model
.
2.1. Customer Management Theory Research
Research on customer management started very early in foreign countries and has yielded good results.
In the aspect of customer management, the theory of customer relationship management was first proposed by Garter Group to study the relationship between customer and enterprise, indicating that customer churn is part of the research of customer relationship management [1].
Subsequently, Carter Company through the investigation and study concluded that when a company wants to find a new customer at a cost of 4-5 times the cost of maintaining an old customer [2]. This result aroused people's concern about the loss of customers.
2.2. Analysis of the Causes of Customer Loss
Due to the late development of customer management and insurance industry in China, the research on customer churn started later, but the result was more.
In analyzing the causes of customer churn, Yang et al. (2011) analyzed and analyzed six aspects of the nature of underwriting vehicles, sales channels, vehicle age, vehicle brand, purchase price of new vehicles and the number of vehicle accidents. The rate should be defined as the target population more frequently in the car insurance 2-4 times, and the safety factor higher vehicle groups [3].
Liang Wuchao (2017) summarizes the reasons for the loss of auto insurance customers in four aspects: service quality, price issue, auto insurance product issues and the problem of employee turnover. Pointed out that the quality of service and price issues are the two main reasons that affect the loss of customers, on the one hand, the services provided by the company did not meet the customer's expectations, on the other hand, low-risk customer rates were high [4].
It can be seen that some of the subject of the vehicle information and price agreement information is an important factor affecting the loss of customers.
2.3. Research on the Construction of Customer Churn Model
In the modeling of customer churn problems, most of the literature is through data mining techniques. The existing algorithms are studied mainly by adjusting the parameters to improve the prediction accuracy.
Zhu Zhiyong et al. (2013) used a Bayesian network technology to build a customer churn model based on a mobile communication company. In order to compare the Bayesian network performance, three improved Bayesian models were built Comparison, come to Blanket model best [5]. Ding Junmei (2015) to solve the problem of data distribution imbalance, based on the improved random forest algorithm to improve the prediction of high value customers in the prediction of customer turnover loss in the telecommunications industry [6].
To sum up, the current domestic and foreign mainly in auto insurance customers loss reasons and customer churn model to do. However, most of them are based on securities companies, banks and other contexts for customer churn analysis, there is less literature on churn loss analysis for auto insurance companies.
3. Construction of Evaluation Index of
Auto Loss
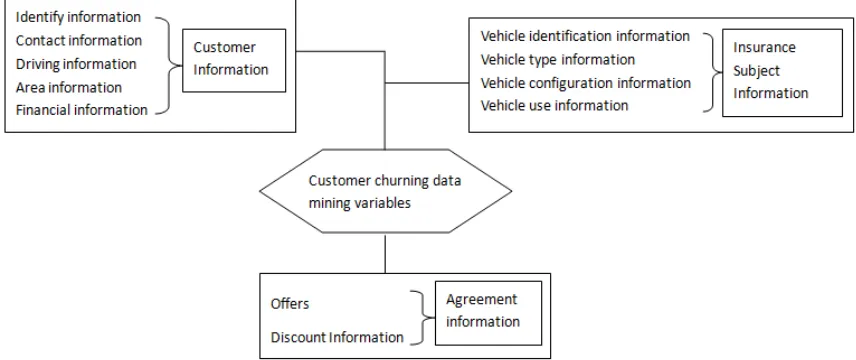
Through the research and analysis of auto insurance and customer churn, find out some of the factors and causes of customer churn. And then build the customer loss index system, which includes the main insurance price, preferential information, as well as some of the customer's own information.
This paper intends to find out the factors that affect the loss of customers from the three aspects of customer information, insurance subject information and holding product information, and find out 54 related attributes in total. Indicator system construction is shown in Figure 2.
Customer information refers to the customer's own basic information. From the insurance business experience, these variables will be very useful in the model, but often the data quality is not too high; the subject matter of the insurance is the carrier of the insurance interest. The information of the car's risk refers to the information about the vehicle insured by the auto insurance company. Some of the information is a very important variable in the renewal factor; Customer-held products can be seen from the customer price sensitivity, and further analysis of customer churn.
4. An Empirical Study on the Analysis of
Auto mobile Loss
Data mining technology is used to build a customer churn model. The data is preprocessed first. Then a decision tree model and a Logistic model are used to analyze and analyze churn customer data. Excavate the influencing factors of customer churn and compare the prediction accuracy of the two models to find the model with higher prediction accuracy.
4.1. Data Preprocessing
The data used to build the customer churn model is based on real data from a car insurance company that collects 1085 customer data with 54 attributes.
Data cleaning is an important step in data mining. Generally, data cleaning accounts for more than 60-80% of data mining workload. The quality of data cleaning directly
affects the accuracy of modeling and prediction.
In this paper, the data cleaning process includes the processing of missing values and outliers; the processing of Variable discretization, such as the business source, needs to transform the business source code; and the variable screening process is conducted according to the dependency of the business on the degree of business interpretation and the target variable.
4.2. Build the Model
For the choice of customer churn model, most scholars include decision tree model, Logistic regression model, Neural Network Model and so on.
This paper chooses decision tree and Logistic regression model. The model generated by the decision tree is a tree structure that finds out the extent to which each variable affects the target variable. The Logistic regression model calculates the probability of each client churn. Therefore, this paper selects these two models to analyze the customer churn data.
This article will be 31 attributes such as discount, age, total discount rate as the input field, the customer is lost as the output field.
4.2.1. Construction and Results of Decision Tree Model
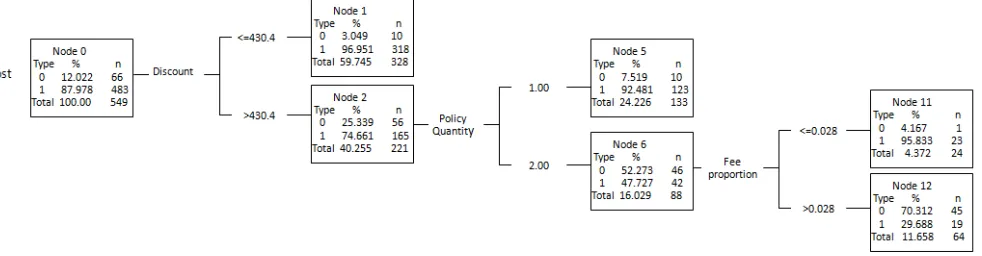
Through the comparative analysis, found that the C & T algorithm, the effect of the three-layer tree is better, and the final variable into the model is three. The decision tree is shown in Figure 3.
Figure 3. Decision tree.
Through the above analysis, some of the main characteristics of customer churn are obtained:
(1) When the discount amount is less than or equal to 430.4, the customer tends to lose;
(2) When the amount of concessions is greater than 430.3 and the number of policies is 1, the customer tends to lose;
(3) When the amount of concessions is greater than 430.3, the number of policies is 1, the fee ratio is less than 0.028, the customer tends to drain.
According to the analysis of important variables, the importance of predictive variables is the amount of
concessions, the number of policies, the proportion of fees, new and old car signs, business sources and the main insurance before the fold, discount premium, description of the amount of concessions is the first major factor affecting customer churn.
4.2.2. Construction and Results of Logistic Regression Model
Table 1. Logistic regression model output result.
Variable Number Variable Name Significance Test
1
x New car 0.000
2
x Commercial insurance premium discount 0.000
3
x Car damage insurance premium discount 0.003
4
x Policy Premium Revenue Status 0.000
5
x The proportion of fee 0.000
6
x Total suminsured 0.003
7
x Discount 0.011
8
x Other commercial insurance premiums after discount 0.011
9
x Total premiums 0.019
10
x Total discount rate 0.026
The Logistic regression model test includes the significance test of single variable on the target variable, the significance test of regression equation and the fitting goodness of regression equation.
The significance test for the regression equation can look at the probability p values for likelihood-like observations corresponding to the Chi-square, p = 0.00 <0.05, indicating a
significant linear relationship between the explanatory variables and Logit P overall.
Goodness-of-fit test of the regression equation can be seen Nagelkerke R square statistic value of 0.566> 0.5, indicating that the model fitting better.
Through the analysis, the logistic regression model is:
= − − − +
−
− − −
1 2 3 4 5
7 8 10
ln 57.455 3.625 0.005 +0.04 2.855 17.775
1
0.002 0.004 2.11
p
x x x x x
p
x x x
Including the new and old car signs, commercial insurance premium discount, car damage insurance premiums after the discount, the policy premium paid state, the proportion of fees, the sum of the total amount of insurance, other commercial insurance premium discount, the total premium and the total discount rate.
The logistic regression model is used to derive the probability of each customer churn and group the customers.
It can be seen that the proportion of customers with very high probability of loss is 80%, and the proportion of customers with very low probability of loss is only 1%. As the auto insurance market customers with instability, customers for auto insurance business choice more, so the low probability of low probability of customers.
4.3. Significant Variable Analysis
Combine two customer churn models to identify important attributes that affect customer churn. Such as the total discount rate, the amount of concessions, premium total, new and old car logo and other attributes.
Both the total discount rate and the discounted amount belong to the discount information. As can be seen from the results of the two models, the higher the total discount rate and the higher the amount of concessions, the lower the probability of customer churn, which is consistent with the reality, when the premium paid by the lower, and customers tend to renew.
When the insurance vehicle is an old car, it has the negative impact on the loss rate. although it is an old car, but the performance of the car is not bad, customers tend to renew.
4.4. Comparison of Two Model Predictions
The two models are used to classify and forecast the lost customers, and the model can be compared and analyzed by the correct rate of prediction. The results of the two models are shown in Table 2 and Table 3.
Table 2. Decision tree model prediction results.
Forecast results Renewal Loss
Renewal 73 21
Loss 43 946
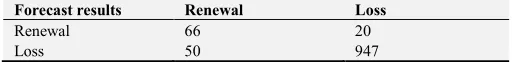
Table 3. Logistic regression model predictive results.
Forecast results Renewal Loss
Renewal 66 20
Loss 50 947
The correct rate of the decision tree model is 94.09%, and the logistic regression model is 93.54%.
The results show that the decision tree results are higher than the Logistic regression mode. If the enterprise based on the results of the model decision-making, more inclined to decision tree model.
5. Conclusion
total discount rate, have great impact on customer churn. By analyzing the causes of customer churn, there are some suggestions to prevent churn and keep customers. First of all, according to the reasons for the loss of customers, it can be seen that the discount and discount information are important variables and have a negative impact on customer churn. Therefore, discounts can be used to attract customers. Second, grouping customers according to the loss probability predicted by the decision tree model. In order to improve the efficiency of renewal insurance, group management should be carried out according to the type of customers and the probability of losing, so that the quality clients can be strictly managed and followed up. For the high probability of losing customers, there should be more timely communication.
References
[1] Liu Yunbo. Evolution: from supply and demand chain to the ecology, http: //www.e-prot.cn/gmxx/itzx/352.thm.
[2] LOUIS A C. Data mining and causal modeling of customer [J]. Telecommunication Systems, 2002, 21 (2): 103-112.
[3] YANG Zi-jiang, WANG Ye, MA Tian-yi .Analysis of the Factors Affecting the Reinsurance Rate of Auto Insurance [J]. Business Research, 2011, 107.
[4] Liang Wuchao, Wang Ying, Wang Shuxia. Research on Win - win Strategy of Customer Missing Based on Fuzzy Analytic Hierarchy Process [J]. Management Manager, 2017.
[5] ZHU Zhi-yong, XU Chang-mei, HU Chen-gang. Analysis of Customer Churn Based on Bayesian Networks [J]. Journal of Computer Engineering and Design, 2013,35 (3): 155-158.
[6] Ding Junmei, Liu Guicheng, Li Hui. Application of Improved Stochastic Forest Algorithm in Prediction of Customer Missing in Telecommunication Industry [J]. Research and Application. 2015.
[7] GuiXiancai, Peng Hong, Wang Xiaohua. Analysis of insurance customers churn based on decision tree [J]. Computer Engineering and Design.2005.
[8] Tian Chong. Data mining technology in China's automobile insurance industry research [D]. Hubei: Wuhan University of Technology master's degree thesis, 2007.
[9] Zheng Yuchen, Lv Wangyong. Early warning analysis of loss of securities firms based on Logistic model [J]. Journal of Zhengzhou Institute of Aeronautical Industry Management. 2016,34 (5): 80-88.
[10] Wang Jichuan, Guo Zhigang. Logistic Regression Model-Methods and Applications [M]. Higher Education Press.
[11] Wang Lei, Chen Songlin, Gu Xuedao. Customer Missing Early Warning Model and Application in Telecommunication Enterprises [J]. Telecom Operation Support, 2006.
[12] Zhang Liangjun, Xie Jiabiao, Yang Tan, Xiao Gang. R and Data Mining [M]. Beijing: Mechanical Press, 2016.
[13] Gareth James, Daniela Witten, Trevor Hastie. Introduction to Statistical Learning - Based on R Applications [M]. Wang Xing, translated. Beijing: Mechanical Industry Press, 2016.