A Numerical Study of flow around
Hyperloop Pod
Harish M 1, Sankaran A2, Moses Devaprasanna M3 and Mageshwaran N 4
1,4
Assistant Professor, Department of Aeronautical Engineering
2
Professor, Department of Aeronautical Engineering
3
Associate Professor, Department of Aeronautical Engineering Hindusthan Institute of Technology, Coimbatore, Tamilnadu, India.
Abstract— Reynolds Averaged Navier Stokes (RANS) CFD simulation have been carried out over Hyperloop pod using Fluent solver with Spallart-Almaras model at Mach numbers 0.6, 0.65, 0.7, 0.75, 0.8 and 0.85. The coefficient of pressure, Shock location, Flow separation, variation of pressure and density have been extracted and compared for all the Mach numbers . The Bow shock formation is observed for all the Mach numbers increases the pressure and decrease the free stream Mach number. The Normal shock is observed over the cylinder region for all Mach number results in increase in pressure.
Keywords—Hyperloop, Magnetic Levitation, shock movement, shock induced pressure rise, flow separation.
1. INTRODUCTION
Existing conventional modes of transportation of people consists of four unique types : rail, road, water, and air . These modes of transport tend to be either relatively slow (e.g., road and water ), expensive (e.g., air), or a combination of relatively slow and expensive (i.e., rail) . Hyperloop [1] is a new mode of transport that seeks to change this paradigm by being both fast and inexpensive for people and goods . To develop high-speed rails and to increase high-speed efficiencies, the idea of Hyperloop was introduced . The challenge is to overcome the difficulties of managing friction and air-resistance which become substantial when vehicles approach high speeds . In this paper, Computational Fluid Dynamics (CFD) is used to simulate the air flow around the hyperloop pod in Transonic speed Regimes.
2. HYPERLOOP POD
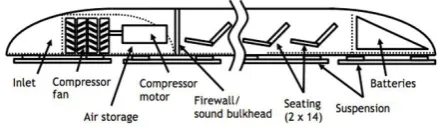
The propulsion systems of Hyperloop are composed of three major parts, batteries, solar panels and linear induction motor [2] .The main concept of Hyperloop is sending a capsule at a very high speed, approaching sound speed, in a partially evacuated tube, using electromagnetic propulsion system .The capsule is levitated using a high pressure air cushion [3]. An axial-flow air compressor is placed at the nose of the capsule
to make use of the relatively-high air pressure at the front of the capsule, hence decreases the aerodynamic drag. The air coming out of the compressor is injected through nozzles at the bottom of the capsule for levitation. The tricky problem is that we must assure that no shockwaves take place on the surface of the capsule, lest the capsule would act like a syringe. The compressor is driven by an electric motor which gets its power from on board rechargeable DC batteries. In order to achieve high speeds, the linear induction motor is the most efficient way to produce frictionless thrust able to overcome the aerodynamic drag. A single-sided linear induction motor is designed and optimized to get the maximum speed and thrust possible with the available power source. The SLIM is designed to be compatible with I-section Aluminum rails. The primary part of the motor is a laminated slotted iron core with coils laid in the slots, the electromagnetic induction of these coils produces eddy currents in the rail conductor. According to Lenz‟s law, an opposing magnetic field is generated and it repels the primary travelling magnetic field; thus, a thrust force acts on the slotted core which is fixed to the bottom of the capsule resulting in a very high speed. The propulsion system is supplied by AC power. Power inverters and phase converters transform the DC power of the on board batteries to high-frequency 3-phase AC power. Solar panels cover the tube to recharge the DC batteries. Standard commercial pumps could easily overcome the air leak and maintain the low pressure needed in the tube. The LIM is clean and its maintenance is easy as it has no moving parts or gears.
3. CONFIGURATION STUDIED
Table 1 gives the geometric details about various parts of pod [4]. Figure 2 shows the geometric details of Hyperloop pod configuration.
Table 1 Geometric details of Hyperloop pod (All dimensions are in m)
Figure 2 Geometric details of Hyperloop pod (All dimensions are in mm)
4. GRID GENERATION & CFD SOLVER
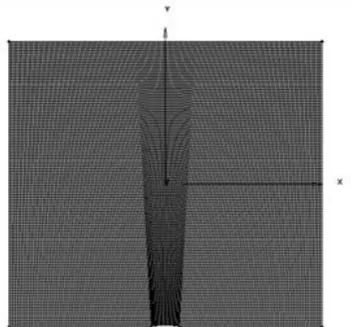
Figure 3 shows grid distribution over the Hyperloop configuration. The primary parameter which determines the minimum number of grid points is the boundary layer thickness. For accurate simulation of separation and shock location, the first grid point off the surface should lie within the sub layer where the velocity varies linearly with distance from the surface.
Figure 3 Domain and Grid distribution over
To capture boundary and shock boundary layer interaction, finer grids are used near the body. To reduce the computer time coarse grids are used away from the viscous layer. The core of the configuration is extended till the outer boundary for ease of simulation i.e., to avoid the base flow region, since the region of interest is only outer body of Hyperloop pod. At transonic free stream Mach numbers, the computational domain of dependence is unbounded and the implementation of boundary conditions becomes critical. Three types of boundary conditions are applied for the computation of flow field, i.e., wall, pressure farfield and symmetry conditions. The grid generated are of single block structured grid.
Fluent solver with Spallart-Almaras turbulence model has been used to simulate the flow over Hyperloop pod for the Mach numbers 0.6, 0.65, 0.7, 0.75, 0.8 and 0.85. The free stream condition used for the simulation are given in Table 2.
Table 2 Free stream properties used for simulation
Pressure (pa) 850
Temperature (k) 298
Specific Heat (J/kg-k) 1009
5. GRID INDEPENDENCE STUDY
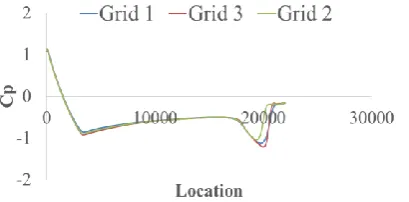
The grid independence study has been carried out over Hyperloop pod with three different grids namely grid 1, grid 2 & grid 3. The grid distribution for pod is given in Table 3 . Figure 4 shows the coefficient of pressure „Cp‟ distribution for three different grids namely grid 1, grid 2, grid 3. It can be seen from the figures that, for further increase in the number of grids, no considerable rise in pressure distribution over the pod is observed . Hence the optimum grid size has been taken as grid 2.
Table 3 Grid Distribution over Hyperloop pod
Grid number
Size of the grid Total number of grid points Total number of quadrilaterals
1 296 * 100 29600 29205 2 446 * 135 60210 59630 3 596 * 150 89400 88655 Length of pod (m) 22
Diameter of pod (m) 1 Length of passenger
compartment (m)
Figure 4 The Co-efficient of pressure distribution for three different grids
6. RESULTS AND DISCUSSION
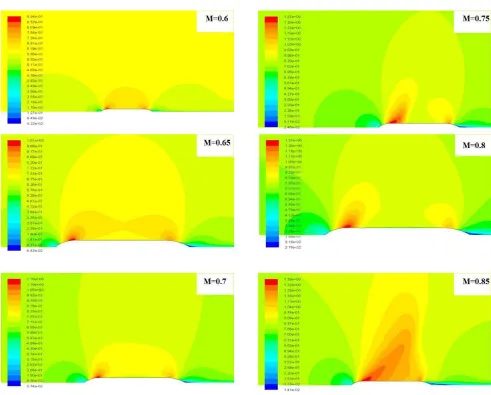
CFD simulations have been carried out on this configuration for all the Mach numbers. Figure 5 shows the Mach contour plot over Hyperloop pod configuration for all the Mach numbers. . The bow shock which is created ahead of nose cone portion of Hyperloop pod, decreases the Mach number .The flow further expands over the nose cone portion, which increases the Mach number due to the formation of Expansion fans. The flow then gets decelerated due to the occurrence of Normal shock in the cylinder portion of the pod. The flow further gets accelerated due to the occurrence of expansion fan on the downstream of the cylinder region . Later, the flow gets separated near the rear end of the pod due to the occurrence of the adverse pressure gradient .
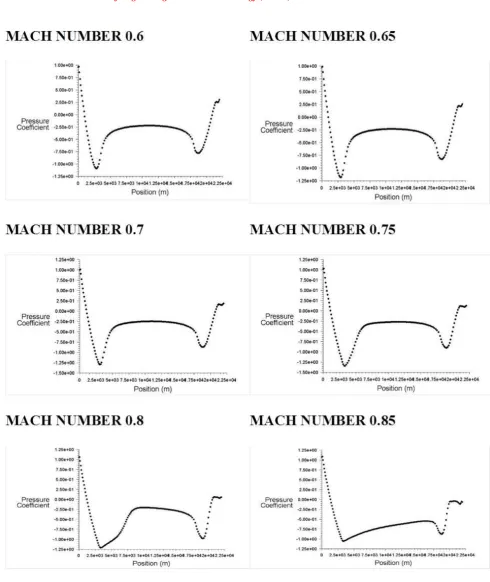
Figure 6 shows the coefficient of pressure plot over Hyperloop pod configuration for all the Mach numbers.. The peak in Cp near the nose cone of the pod is due to the location of the stagnation point. Later Cp falls down to negative value over the nose cone region due to the expansion of flow over nose cone. Then there is Cp jump in cone cylinder junction for Mach number 0.8, which clearly shows the location of shock on the cylinder. The flow gets separated in the downstream of the pod which decreases the pressure and later gets reattached with a gradual increase in pressure for all the Mach numbers.
7. CONCLUSION
CFD simulation have been carried out over Hyperloop pod in Transonic Mach regime. The following observations are made:
1. The Bow shock formation is observed for all the Mach numbers which increases the pressure and decrease the free stream Mach number .
2. The flow gets expanded due to the formation of expansion fans in cone cylinder junction which increases the flow Mach number.
3. The Normal shock is observed over the cylinder region for all Mach number results in increase in pressure .
4. The strength of Normal shock is seen less for Mach number 0.85 which is efficient for the pod to travel.
REFERENCES
1. Mohammed Imran, “Hyperloop Technology -The
Passenger Transport System “, Vol.4, Issue 3, ©KY Publications: May-june 2016.
2. Ahmed E.Hodaib and Samar F.Abdel Fattah,
“Conceptional Design of a Hyperloop Capsule with Linear Induction Propulsion System”, Vol:10, No:5,2016waset.org/Publication/1000423.
3. Mark Sakowski, “The Next Contender in High Speed
Transport Elon Musk‟s Hyperloop”, © 2016:University of Illinois at Chicago.
4. UPV Team- Hyperloop design report Universitat
Polit`ecnica de Val`encia Valencia - January 2016.
5. Nasa Marti- Hyperloop Documentation- Release 2.0-