Optimization of Mig Welding Process
Parameters for Improving Welding Strength of
Steel
C. Labesh kumar1, T. Vanaja2, Dr. KGK Murti3, VVSH Prasad4
1,2
Assistant Professor, 3,4Professors,
Department of Mechanical Engineering, Institute of Aeronautical Engineering, Dundigal, Hyderabad.
ABSTRACT
The MIG welding parameters are the most important factors affecting the quality, productivity and cost of welding. These welding parameters are welding current, welding voltage, Gas flow rate, wire feed rate, etc. they influence weld strength, weld pool geometry of Steel material during welding. By using DOE method, the parameters can be optimize and have the best parameters combination for target quality. The analysis from DOE method can give the significance of the parameters which effect change of the quality and strength of product. A plan of experiments based on Taguchi technique will be used to acquire the data. An Orthogonal array, signal to noise (S/N) ratio and analysis of variance (ANOVA) will be employed to study the welding characteristics of material & optimize the welding parameters. The result computed will be in form of contribution from each parameter, through which optimal parameters will be identified for maximum tensile strength.
Keywords: MIG welding, steel, Taguchi technique, Tensile strength.
1. INTRODUCTION
Gas metal arc welding(GMAW), sometimes referred to by its subtypesmetal inert gas(MIG)weldingormetal active gas(MAG)welding, is aweldingprocess in which an electric arc forms between a consumablewire electrodeand the work piece metal(s), which heats the work piece metal(s), causing them to melt and join.
Along with the wire electrode, a shielding gas feeds through the welding gun, which shields the process from contaminants in the air. The process can be semi-automatic or automatic. A constant voltage, direct current power source is most commonly used with GMAW, but constant current systems, as well as alternating current, can be used. There are four primary methods of metal transfer in GMAW, called globular, short-circuiting, spray, and pulsed-spray,
each of which has distinct properties and corresponding advantages and limitations.
Originally developed for welding Aluminium and other non-ferrous materials in the 1940s, GMAW was soon applied to steels because it provided faster welding time compared to other welding processes. The cost of inert gas limited its use in steels until several years later, when the use of semi-inert gases such as carbon dioxide became common. Further developments during the 1950s and 1960s gave the process more versatility and as a result, it became a highly used industrial process. Today, GMAW is the most common industrial welding process, preferred for its versatility, speed and the relative ease of adapting the process to robotic automation. Unlike welding processes that do not employ a shielding gas, such as shielded metal arc welding, it is rarely used outdoors or in other areas of air volatility. A related process, flux cored arc welding, often does not use a shielding gas, but instead employs an electrode wire that is hollow and filled with flux.
ELECTRODE
Copper Coated M.S. Wire is used for Sub- Area welding process and Metal Inert Gas welding process and many other applications such as in Fireworks. Mild steel wire rod of 6 or 8mm diameter available in coil bundle is cleaned by pickling. Pickling process involves dipping of M.S. Coil first in acid bath followed by dipping in Alkali Solution and then in water tank. The cleaned wire rod is drawn on heavy duty drum type wire drawing M/C. After annealing the drum wire is again drawn up to desired gauge. The wire is then passed through copper coating tank for coating of copper layer as per standard requirement. Copper coating tank made out of Stainless Steel or Fiber Reinforced Plastic and Poly Propylene material with five / six chambers with the required heating arrangements. Cupric nitrate produced either by dissolving copper carbonate in nitric acid or direct from copper and nitric acid. It has a number of small uses, such as in ceramics, dyeing as a mordant, in fireworks and in photography.
Fig 1 M.S. Electrode
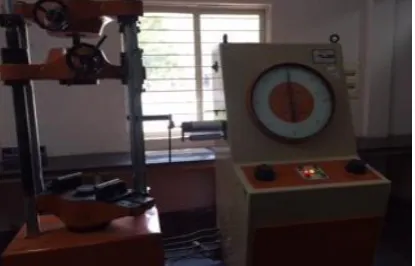
UTM (UNIVERSAL TESTING MACHINE)
A universal testing machine (UTM), also known as a universal tester materials testing machine or materials test frame, is used to test the tensile strength and compressive strength of materials. The “universal” part of the name reflects that it can perform many standard tensile and compression tests on materials, components, and structures.
Fig2: Universal Testing Machine
UTM consists of
Load frame - Usually consisting of two strong supports for the machine.
Load cell - A force transducer or other means of measuring the load is required. Cross head - A movable cross head
(crosshead) is controlled to move up or down.
Means of measuring extension or deformation- Extensometers are sometimes used.
Output device - A means of providing the test result is needed.
Test fixtures, specimen holding jaws, and related sample making equipment are called for in many test methods.
The specimen is placed in the machine between the grips and the machine itself can record the displacement between its cross heads on which the specimen is held. However, this method not only records the change in length of the specimen but
also all other extending / elastic components of the testing machine and its drive systems including any slipping of the specimen in the grips.
FORMULAE
1. SPEED= DISTANCE/ TIME
2. S/N RATIO= -10 x LOG (Mean of Sum Squares of Reciprocal Of Measured Data)
MIG WELDING MACHINE
SPECIFICATIONS:
Gas metal arc welding (GMAW), sometimes referred to by its subtypes metal inert gas (MIG) welding or metal active gas (MAG) welding, is a welding process in which an electric arc forms between a consumable wire electrode and the work piece metal(s), which heats the work piece metal(s), causing them to melt and join.
Along with the wire electrode, a shielding gas feeds through the welding gun, which shields the process from contaminants in the air. The process can be semi-automatic or automatic. A constant voltage, direct current power source is most commonly used with GMAW, but constant current systems, as well as alternating current, can be used. There are four primary methods of metal transfer in GMAW, called globular, short-circuiting, spray, and pulsed-spray, each of which has distinct properties and corresponding advantages and limitations.
Fig3: MIG Welding Machine
SPECIFICATIONS:
Input voltage vac: 415V±15% Frequency (HZ): 50/60 Rated input current (A): 8.5 Output current range (A): 50-250 Output voltage adjustment (V): 26.5 Wire-feeding speed (M/MIN): 2.5-18 Duty cycle (%)): 60
Type of wire feeder: Split Efficiency (%): 80 Power factor: 0.73 Insulation grade: F
Housing protection grade: IP21 Net weight (KG): 9
Dimension (INCH): 14.5 X 6 X 9
PARAMETERS
Parameter is a quantity whose value is selected for the particular circumstances and in relation to which other variable quantities may be expressed. These are the ones which influence the result. There are 7 parameters involved in MIG welding. They are:-
1. Welding Current
2. Arc Voltage
3. Welding Speed
4. Electrode Size
5. Gas Flow Rate
6. Shielding Gas Composition
7. Welding Position
ALL PARAMETERS
1. WELDING CURRENT: Welding usually requires high current (over 80 amperes) and it can need above 12,000 amperes in spot welding. Low current can also be used; welding two razor blades together at 5 amps with gas tungsten arc welding is a good example. Welding machines are usually classified as constant current (CC) or constant voltage (CV); a constant current machine varies its output voltage to maintain a steady current while a constant voltage machine will fluctuate its output current to maintain a set voltage. Shielded metal arc welding and gas tungsten arc welding will use a constant current
source and gas metal arc welding and flux-cored arc welding typically use constant voltage sources but constant current is also possible with a voltage sensing wire feeder.
2. ARC VOLTAGE: An arc voltage discharge is an electrical breakdown of a gas that produces an ongoing electrical discharge. The current through a normally nonconductive medium such as air produces a plasma; the plasma may produce visible light. An arc discharge is characterized by a lower voltage than a glow discharge, and it relies on thermionic emission of electrons from the electrodes supporting the arc.
3. WELDING SPEED: Travel speed is a function of time and distance traveled. Distance traveled represents the actual length for which weld metal is deposited from the initiation of the arc to the termination of the arc. This is quite simple to calculate for a given welding process. Determine the actual location on the workpiece at which the welder begins depositing filler metal along with a starting time. You can use a timepiece with a second hand or a stopwatch for this. Begin timing the welding process when the welder initiates the arc and stop when the weld pass is terminated. Then determine how much time elapsed along with the total length of filler metal deposited. For example, let's say the welder traveled 4.5 inches in 50 seconds. Divide 4.5 by 50 and you get 0.09 inches per second. Multiply 0.09 by 60 (seconds per minute) and the resultant answer is 5.4 inches per minute (in./min). This particular welder's travel speed is 5.4 in./min at his/her current welding parameters. Travel speed is generally expressed in inches per minute. Note that the welder's travel speed will generally change with welding variables such as position, filler metal diameter, joint accessibility, etc.
4. ELECTRODE SIZE: Gas metal arc welding (GMAW), sometimes referred to by its sub types metal inert gas (MIG) welding or metal active gas (MAG) welding, is a welding process in which an electric arc forms between a consumable wire electrode and the workpiece metal(s), which heats the workpiece metal(s), causing them to melt and join.
MATERIAL
HDS (HOT DIE STEEL)
Heat Treatment
Hardening: Preheat at 650 ° C- 850 ° C and rise to 1020 ° C.-1050 ° C Cool in air, oil or salt bath held at 500 ° C-550 ° C and then cool in air.
Forging: Forge at 900° C to 1100° C. cool slowly and anneal immediately.
Anneal: Anneal at 850° C-870° C. Cool slowly in furnace.
Temper: Double tempering recommended at 500°
C-650° C cool in air.
Stress Relieving: Stress relieve at 600° C to 650° C and cool in air.
Fig4: Hot Die Steel Material
MATERIAL COMPOSITION:
TABLE 1: MATERIAL COMPOSITION
ELEMENT WEIGHT IN % Carbon 0.32-0.45 Chromium 4.75-5.50 Molybdenum 1.10-1.75 Vanadium 0.80-1.20 Silicon 0.80-1.25 Sulphur 0.30 max Phosphorus 0.30 max Manganese 0.25-0.50
3.3 APPLICATIONS:
a)
Ejector pins,b)
Nozzlesc)
Swaging diesd)
Insert, cores, and cavities will for the Die Casting,e)
Die casting shot Sleeve,f)
Forging dies,g)
Extrusion Dies,h)
Plastic mold cavities and components did require high toughness and excellent polish ability.4. EXPERIMENTAL PROCEDURE
ORTHOGONAL ARRAY
There are totally 9 experiments to be conducted and each experiment is based on the combination of level values as shown in the table. For example, the third experiment is conducted by keeping the independent design variable 1 at level 1, variable 2 at level 3, variable 3 at level 3, and variable 4 at level 3.The orthogonal arrays have the following special properties that reduce the number of experiments to be conducted.
WELDING PARAMETERS
Levels of process variables
Experimental layout using L9 orthogonal array
EXPERIMENT VARIABLE 1 VARIABLE 2 VARIABLE 3 Ra
values
1 1 1 1 P1
2 1 2 2 P2
3 1 3 3 P3
4 2 1 2 P4
5 2 2 3 P5
6 2 3 1 P6
7 3 1 3 P7
8 3 2 1 P8
9 3 3 2 P9
Variables Unit Level
1
Level 2
Level 3
Current(I)
amp 190 195 200
Voltage(V)
Volt 20 23 26
Welding
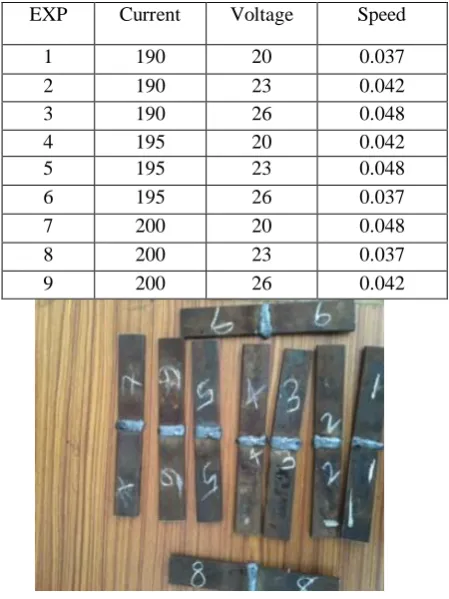
EXPERIMENTAL SETUP:
In this setup three parameters are taken into consideration and are altered so as to obtain the optimized result. The three altering parameters are welding current, arc voltage and welding speed. Three values of welding current are chosen: 190, 195 and 200 amps.
Three values of arc voltage are chosen : 20, 23 and 26 votls.
Fig 5: Welding Setup
PRE-EXPERIMENTAL PROCEDURE:
1. The work is cut into the required dimension i.e 100x30x5 mm.
2. Then the edges of the work pieces are filed so as to obtain a 90 degree angle when attached through a butt joint.
3. The working of a machine and the availability of shielding gas is verified before beginning the experiment.
EXPERIMENTAL PROCEDURE:
1. The workpiece is first adjusted in proper position to begin the task of welding. 2. The parameters on the machine are
adjusted as current being 190amps, voltage being 20 volts.
3. MIG welding is performed and the welding time is noted down.
4. The above procedure is repeated for the decided nine experimental value combinations.
5. All the parameters are properly noted down, including the amount of wire consumed.
Fig 6: Work Pieces after Welding
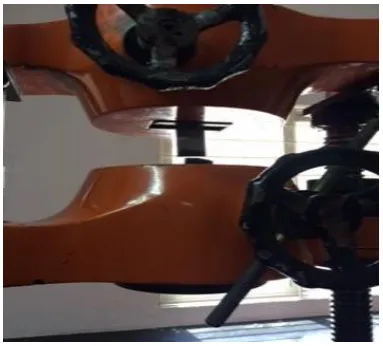
TENSILE TESTING
The welded joints go through a destructive testing on Universal Testing Machine to determine tensile strength.
1. The work piece with a total length of 200mm length and 160mm gauge length is fit into the jaws of UTM.
2. The load is slowly applied until the joint finally breaks.
3. The value of tensile strength obtained is noted down.
4. Also, graph is generated.
UTM SETUP
Fig 7: Setup on UTM machine
EXP Current Voltage Speed
1 190 20 0.037
2 190 23 0.042
3 190 26 0.048
4 195 20 0.042
5 195 23 0.048
6 195 26 0.037
7 200 20 0.048
8 200 23 0.037
Fig 8: Joint breaking on UTM machine
3. UTM TEST RESULTS
Table2: UTM RESULTS
3. S/N RATIO
The objective of parameter design is to take the innovation which has been proven to work in System Design and enhance it so that it will consistently function as intended. Usually by using classical parameter design there are a large number of experiments to be carried out when the number of the process parameter increases. To solve this task, Taguchi come out with a special design of orthogonal arrays to study the entire parameter space with a small number of experiments only. Taguchi recommends the use of the loss function to measure the performance characteristics deviating from the desired value (Glen Stuart, 1999). The value of the loss function is further transformed into a signal-to-noise ratio. There are three categories of the performance characteristics in the analysis of the S/N ratio, that is
1) The smaller- the- better 2) The nominal-the-better 3) The larger-the-better
The S/N ratio for each level of process parameters is computed based on the S/N analysis (Yuin Wu, Alan Wu, 2000). Regardless of the category of the performance characteristic, the larger S/N ration corresponds to the better performance characteristics. Therefore, the optimal level of the process parameters is the level with the highest S/N ratio.
THE SMALLER-THE-BETTER:
The smaller-the-better characteristics is one in which the desired goal is to reduce the measured characteristics to zero. This applies, for instance to theporosity, vibration, the consumption of an automobile, tool wear, surface roughness, response time to customer complaints, noise generated from machine or engines, percent shrinkage, percent impurity in chemicals, and product deterioration.
THE LARGER-THE-BETTER:
The opposite of the lower-the-better is the larger-the-better characteristics. This is one in which the ideal value is infinity. This type characteristics applies to tensile strength, pull strength, car mileage per gallon of the, reliability of a device, efficiency of engines, life of components, corrosion resistance and others.
THE NOMINAL-THE-BETTER:
The nominal-the-better characteristics is one where a target value is specified and the goal is minimal variability around the target. This type of characteristics is generally considered when measuring dimensions such as diameter, length, thickness, width etc. Other examples include pressure, area, volume, current, voltage, resistance, and viscosity.
ANAYLSIS USING VARIANCE METHOD:
The acronym ANOVA refers to analysis of variance and is a statistical procedure used to test the degree to which two or more groups vary or differ in an experiment. In most experiments, a great deal of variance (or difference) usually indicates that there was a significant finding from the research. The optimal combination of the process parameters can be predicted by S/N ratio and ANOVA analyses. Finally, a confirmation experiment is conducted to verify the optimal process parameters obtained from the parameter design. The adequacy of the developed models was tested using the Analysis of Variance (ANOVA) technique. The experimental results are analyzed with analysis of variance (ANOVA), which used for identifying the factors significantly affecting the performance measures. In this project smaller the better is adopted for optimization. An ANOVA conducted on a design in which there is only one factor is called a one-way ANOVA. If an experiment has two factors, then the ANOVA is called a two-way ANOVA. To perform
SAMPLE STRENGTH
an ANOVA, there must be a continuous response variable and at least one categorical factor with two or more levels. ANOVAs require data from approximately normally distributed populations with equal variances between factor levels. The name "analysis of variance" is based on the approach in which the procedure uses variances to determine whether the means are different. The procedure works by comparing the variance between group means versus the variance within groups as a way of determining whether the groups are all part of one larger population or separate populations with different characteristics.
RESULTS AND DISCUSSIONS
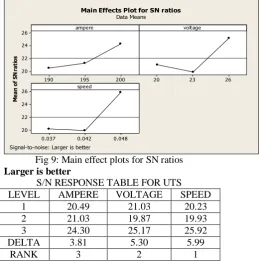
In this research work effect of main input welding parameters on the tensile strength of welded joint in metal inert gas welding process were investigated Results show that among main input welding parameters the effect of the welding speed is significant. Increasing the welding speed and decreasing the current increases the ultimate tensile strength of welded joint. In this research work it was observed that the voltage did not contribute as such to weld strength. Regardless of the set of the quality characteristic, a greater S/N ratio relates to better quality characteristics. Therefore, the optimal level of the process variables is the level with the greatest S/N ratio. 200 195 190 20.0 17.5 15.0 12.5 10.0 26 23 20 0.048 0.042 0.037 20.0 17.5 15.0 12.5 10.0 ampere M ea n of M ea ns voltage speed
Main Effects Plot for Means
Data Means
Fig 9: Main effect plots for means
200 195 190 26 24 22 20 26 23 20 0.048 0.042 0.037 26 24 22 20 ampere M ea n of S N ra ti os voltage speed
Main Effects Plot for SN ratios
Data Means
Signal-to-noise: Larger is better
Fig 9: Main effect plots for SN ratios
Larger is better
S/N RESPONSE TABLE FOR UTS LEVEL AMPERE VOLTAGE SPEED
1 20.49 21.03 20.23 2 21.03 19.87 19.93 3 24.30 25.17 25.92 DELTA 3.81 5.30 5.99
RANK 3 2 1
TABLE 9: VALUES OF LARGER IS BETTER
CONCLUSION
The optimization of parameters by the Taguchi's orthogonal array has proved to be an excellent tool. This experimentation has provided a significant result by considering small experimentation values. The three parameters are contributing to the response and all have been considered for experimentation of MIG welding.
Among the parameters Hot Die steel speed is 0.051mm/min, voltage 26 volts and current 200amps. The S/N ratios of predicted values and S.N O CURRE NT VOLTA GE
SPEED STRENG TH 1.
190 20 0.041
mm/min 7.8 KN 2.
190 23 0.042
mm/min 8.1 KN 3.
190 26 0.046
mm/min 18.75 KN 4.
195 20 0.036
mm/min 6.4 KN 5.
195 23 0.041
mm/min 14.4 KN 6.
195 26 0.051
mm/min 16.9 KN 7.
200 20 0.034
mm/min 28.6 KN 8.
200 23 0.043
mm/min 8.2 KN 9.
200 26 0.048
verification test values are valid when compared with optimum values. The S/N ratios are found to be within the limits of the predicted value and the work has fulfilled by the objective. Hence it can be concluded the parameters are valid and within the range of the machining standards.
REFERENCES
1. Effect of arc voltage, welding current and welding speed on
fatigue life, impact energy and bead penetration of AA6061 joints produced by robotic MIG welding by H.R. Ghazvinloo1, A. Honarbakhsh-Raouf1 and N.Shadfar.
2. A Review on Optimization of MIG Welding Parameters
using Taguchi‟s DOE Method by Satyaduttsinh P. Chavda1, Jayesh V.Desai, Tushar M.Patel.
3. Effect of Mig welding input process parameters on weld
bead geometry on Hsla steel by Mohd. Shoeb Department of Mechanical Engg R.D. Engg. College, Duhai Ghaziabad.
4. Optimization of Mig welding process parameters to predict
maximum yield strength in AISI 1040 by Ajit Hooda, Ashwani Dhingra and Satpal Sharma.
5. https://www.lincolnelectric.com/assets/global/products/cons
umable_miggmawwires-superarc-superarcl-56/c4200.pdf
6. Hand book by welding techniques – ESAB
7. Altamer A. de. (1980) „Automatic welding and cladding in
heavy fabrication‟, Journal of Metallurgical Construction.
8. Cary H. B. (1979) „Modern Welding Technology‟. New
Jersey. Prentice Hall.
9. Chan B, Pacey J, Bibby M. (1999) „Modeling gas metal arc
weld geometry using artificial neural network technology‟. Journal Of Canadian Metallurgical Quarterly
10. G. Haragopal, , P V R Ravindra Reddy, G Chandra Mohan
Reddy and J V Subrahmanyam, “Parametric design for MIG welding of Al-65032 alloy using Taguchi Technique”, Journal of Scientific and Industrial Research.
11. Amit Kohli and Hari Singh (2011) “Optimization of
Processing Parameters in Induction Hardening Using
Response Surface Methodology”, Sadhana
12. Faseeulla Khan M D, Dwivedi D K and Satpal Sharma