doi: 10.11648/j.ss.20130202.16
Orphans and vulnerable children (OVC) in Uganda; are
orphans more malnourished than non-orphans
Lubaale Yovani A. Moses
School of Statistics and Planning formerly Institute of Statistics and Applied Economics, Makerere University, Kampala Uganda
Email address:
ylubaale@isae.mak.ac.ug, ylubaale@gmail.com, ylubaale@yahoo.co.uk(Lubaale Y.A.M)
To cite this article:
Lubaale Yovani A. Moses. Orphans and Vulnerable Children (OVC) in Uganda; Are Orphans More Malnourished Than Non-Orphans,
Social Sciences. Vol. 2, No. 2, 2013, pp. 58-65. doi:10.11648/j.ss.20130202.16
Abstract:
Many scholars and policy makers have often said that orphaned children are more vulnerable than any other children within the same environment in which they live. This paper compared the nutrition status of orphans and non-orphans to see if non-orphans were more malnourished and if not to investigate factors affecting nutrition of children. It is based on the 2006 Uganda Demographic and Health Survey data. The analysis compared orphans and non-orphaned children in relation to the three anthropometric measures of underweight, stunting and wasting limiting itself to -2SD. The findings indicated that orphans (wasting-33.1%, underweight-17.0% and stunted-5.9%) were not more malnourished than non-orphans (wasting-39.2%, underweight-17.2% and stunted-6.5%). Results showed that maternal orphans (48.2%) are affected more in terms of nutritional indicators at least in the short term than paternal orphans (29.0%). The most important determinant on nutrition was the household wealth index and level of education of the mother for children living with their mothers in the same households.Keywords:
OVC, Non-Orphans, Stunted, Wasted, Underweight, Malnutrition, Uganda1. Introduction
The period from birth to two years of age is important for optimal growth, health and development. Unfortunately, this period is often marked by growth faltering, micronutrient deficiencies, and common childhood illnesses such as diarrhea and acute respiratory infections (ARI). There are many causes for this and among them is nutrition. Access to adequate food or food security is now regarded as one of the measures of child vulnerability.
It has been reported by WHO1 (2012) that in Africa, a third of all children below the age of five are malnourished. This is cause for worry as childhood nutrition is the foundation of survival, health and development for current and future generations. Compared with the risk of a well-nourished child, the risk of death from common childhood diseases is double for a mildly malnourished child, tripled for a moderately malnourished child and may be even high as eight times for a severely malnourished child (Khan1 et al, 2006).
Malnutrition of children due to hunger and inadequate nutritious food intake in many areas of the country makes them anemic, weak and prone to diseases and many scholars say that orphans are the most affected (Ntozi and
Khumalo 20081). Poor nutrition will affect the survival of children hence life expectancy at birth. Nutrition plays a major role in maintaining health of children and malnutrition appears to generate vulnerability to a wide variety of diseases and general ill health. Adequate nutrition is critical to child development.
Vulnerability is defined as living in an environment that is a breeding ground for denial of privileges and basic rights for a decent life (Alwang, Siegel & Jorgensen 20011, Holzmann and Jorgensen 19991, Kaare 20051). That environment also produces health risks and threatens survival, lacking the capacity to fight back. There are many forms of vulnerability but this paper will only consider one form of vulnerability; orphanhood status. An orphan has been defined as a child below the age of 18 years who has lost either one or both parents. This definition includes children whose parental status is not known based on the compendium of statistical definitions in Uganda (UBOS, 20061). A maternal orphan is a child who has lost a mother while paternal orphan is a child who has lost a father. A child who has lost both parents is referred to as a double orphan.
poverty. This may lead to reduction of the available food within the household. The situation is made even worse if the death was due to AIDS because of the prolonged period spent caring for the sick and the resources spent on medication. 1
However, the extent to which children become affected with lack of food will depend on a number of factors. According to the International HIV/AIDS alliance, 20037, in Malawi and Uganda, some orphans reported that they are isolated at mealtime; “We are used to sharing small amounts of food…., we usually give the larger portion to the younger ones. When there is no food at all, we miss meals”. This statement does not in any way suggest that there is a deliberate policy by families to mistreat orphans. It is more related to poverty and the lack of sufficient food for the family. Dennings8 et al (2003) found that allocation of food, education and health care does not favour orphans in Uganda. The Zimbabwe Ministry of Health7 report, (2004) indicated that for all nutrition indicators, orphans are worse off, irrespective of age and type of orphanhood. The double orphans were worse off followed by the paternal orphans with maternal orphans being the least affected among orphans. This can be explained by the fact that fathers were the bread winners ensuring that the family had3what to eat in a cash economy.
In Africa, children whose parents die are doubly burdened, losing not only the attention, care and advice that a parent gives, but also access to household resources such as housing and land. As a result, orphaned children are deprived of the material, social and psychological support of one or more of their primary caregivers. Orphaned children are thus more vulnerable and potentially at increased risk of poor health (Ayieko 19977, WHO 2006a11). There are also many children who, though not orphans, are becoming vulnerable as a direct or indirect result of HIV/AIDS (WHO 2006b11).
Traditionally in Africa, the extended family acted as the continent’s social security system-protecting vulnerable members, caring for the poor and sick and transmitting traditional social values and education. Hence, the general practice in sub-Saharan Africa was and has been that; orphaned children are cared for by the extended family rather than in institutionalized orphanages. There is evidence to indicate that the increasing number of HIV/AIDS orphans is pushing community resources to the limit (Foster 200211, Ntozi & Zirimenya 199911). The few published studies on the health status of orphans, however, do not clearly indicate whether orphans cared for within their community constitute a higher-risk population than those in orphanages that they should be targeted for public health intervention (Kim et al 200311).
During the conference in Addis Ababa (May 2009) on child abuse and neglect with special focus on early childhood development, one of the children declaration was a request to parents to have fewer children. This declaration was based on the premise that large families cannot look after the children well. Hence this study
looked at the number of children in the household below 5 years and total number of persons in the household (Household size).
2. Objectives of the Study
2.1. Major Objective of the Study
The major objective of this paper was to find out if orphans are more malnourished than non orphans and what factors affect child nutrition in Uganda.
2.2. Specific Object
The specific objectives of the study were to:
i. compare the nutrition status (anthropometric measure) of children by the different orphanhood category
ii. compare the nutrition status of children by other socio-demographic economic characteristics of children
iii. find out the factors that affect the malnutrition of children
3. Methodology
3.1. Source of Data and Data Selection
The source of data for this paper is the 2006 Uganda Demographic and Health Survey (UDHS) (UBOS & Macro International, 200717). This was the fourth DHS to be carried out in Uganda. The other previous ones having been held in 1987/88, 1995 and 2000/1. The 2006 UDHS collected data on the nutritional status of children by measuring the height and weight of all children under five years of age in a subsample of one in three households selected for the survey. Though the DHS had three questionnaires, this study used only the household questionnaire which had basic information on age, education, relationship to household head and survival status of parents and household characteristics. In addition, other anthropometric measures like height, weight, hemoglobin level were collected among a sub sample of women and children under five years of age. Using this data, three indices were calculated namely; weight-for-age, height-for-age, and weight-for-height all of which take age and sex into consideration. Details on how the measurements were done can be found in the main UDHS report (UBOS & Macro International, 200717).
The children selected were those who had information on the three indices of underweight, wasting and stunting. A total of 2,672 children had all the three indices forming the sample size for this study. The Uganda Demographic Health Surveys (UDHS) data is online and can be obtained free from MEASURE evaluation project or from Uganda Bureau of Statistics and all identifiers have been removed to maintain confidentiality.
3.2. Measurements
relation to body height or length and describes current nutritional status. Children whose Z-scores are below minus two standard deviations (-2SD) are considered thin (wasted) and are acutely malnourished. Wasting represents the failure to receive adequate nutrition in the period immediately preceding the survey and may be the result of inadequate food intake or recent episodes of illness causing loss of weight and the onset of malnutrition. Children whose weight-for-height is below minus three standard deviations (-3 SD) are considered severely wasted.
Children whose height-for-age Z-score is below minus two standard deviations (-2SD) are considered short for their age (stunted) and are chronically malnourished. Children who are below minus three standard deviations (-3SD) are considered severely stunted. Stunting reflects failure to receive adequate nutrition over a long period of time and is also characterized by recurrent and chronic illness. Height-for-age, therefore, represents the long-term effects of malnutrition in a population and is not sensitive to recent, short-term changes in dietary intake. Weight-for-age is a composite index of height-for-Weight-for-age and weight-for-height. It takes into account both acute and chronic malnutrition. Children whose weight-for-age is below minus two standard deviations are classified as underweight. Children whose weight-for-age is below minus three standard deviations (-3SD) are considered severely underweight.
The dataset had these standard deviations on the anthropometric measures and the wealth index already computed. In the 2006 UDHS, the nutritional status of children was calculated using the new growth standards published by WHO (2006a12) and Cogill18 (2003). Details on how they are calculated can be found in WHO (2006a12). These new growth standards were generated using data collected in the WHO Multicentre Growth Reference Study (WHO, 2006a12).
3.3. Data Analysis
Data was compared between orphans and non-orphans, maternal orphans and non-maternal orphans, paternal orphans and non-paternal orphans. The number of double orphans was small hence; no categorization for double orphans (both mother and father dead) was done. In order to give more details related to variations in the nutrition of children, a comparison was also done with other variables/factors (socio demographic) namely the wealth index, level of education of the mother of the non-orphaned children who were living in the same households with their mothers, sex of the children and region. The Pearson chi-square statistic was used to test the significance of the relations. The general form of the Chi-square used was
(
)
∑
=∑
=−
2
1 1
ij ij ij r i c
j
e
e
o
Where
oij is the observed frequency,
eij expected frequency in ith row of jth column degrees of freedom df=(r-1)(c-1)
3.4. Limitation of the Data
The small numbers of orphans found in subset of the UDHS child sub-sample made it difficult to look at children in relation to many other variables found in the data. It was also not possible to control many of the factors to make concrete conclusions. Similarly no analysis was made for the severely underweight, severely stunted and severely wasted.
4. Findings of the Study
4.1. Description of the Sample
A total of 2,672 children were considered for the analysis. Results showed almost equal number of males (49.9%) and female children (50.1%). Similarly by age of child, the distribution of children by age was almost the same, ranging from 21.5% among children aged 12-23 months as the highest to 19.2% among children aged 48-59 months as the smallest proportion. The survival status of parents showed that 4.4% of the children were orphans, 3.7% paternal orphans while maternal orphans accounted for only 1.0%. The distribution of children by wealthy index showed that children from the poorest household had the highest proportion of 23.7%.
The analysis on education included only children who were staying with their biological mother. These constituted 91.9% of all children. Of these 57.7% of the mothers had primary education and only 2.1% had higher educational level. By region, the Northern region had the highest proportion of children accounting for 28.7%. Most children lived in households with other children (74.4%) with only one in four of children staying in households with no other child below the age of five years. The findings further show that many children lived in households with 5-9 persons (66.6%). Among every 5 children, 4 were biological children to the head and only 1.9% (51) had no relationship to the household head. These results are displayed in Column II of Table 1.
4.2. Weight for Height (Wasting)
classified as paternal orphans against non-paternal orphans and maternal orphans against non-maternal orphans. Findings showed that a loss of a father does not increase one’s vulnerability in terms of current nutrition status. Paternal orphans had the lowest proportion of children whose weight for height was less than -2SD at 29% compared to non-paternal at 39.4%, separated by 10 percentage points. On the other hand, maternal orphans had the highest proportion (48.2%) of those who were badly off in terms of current nutritional status. Overall, 39 percent of children were below -2SD an indication that 4 in 10 children’s were in danger in relation to their current nutritional status.
Since there is not much difference in the current nutritional status of children by survivorship of the parents, it was necessary to find out what factors affect the current nutritional status of children in Uganda. Some other additional factors looked at were the sex of child, household wealth index, mothers’ education level, region, number of children below 5 years, household size and relationship to household head all displayed in Table 1.
Male children (40.9%) were affected most in relation to current nutritional status than female children (37.0%) and this difference was statistically significant ( P =0.037). In terms of wealth index, the poorer the household the children lived in, the higher the proportion of children whose current nutritional status was in danger. For example, among the richest, only 25.5% of the children were below -2SD while this proportion was 44.3% among children from the poorest households. Education of the mother also played a role in the current nutritional status of children. The higher the education level of the mother, the less the danger of the child being wasted. The proportion of children below -2SD decreased with increasing level of education of the mother. Similarly, region of residence was looked at in terms of current nutrition status of the children. The Central region (31.9%) had the lowest proportion of children whose current nutritional status was below -2SD followed by the Eastern region. The worst off region was the Western region (44.4%).
Considering weight for height, there was no difference observed in proportion of children below -2SD by number of children below five years in a household. For example 40.8 percent of the children living in household with 3 children under five were less than -2SD compared to 39.9 percent among households with 4 or more children under five years.
On the household size, slightly a higher proportion of children were -2SD under five years among household size of less than five followed by those with 5-9 persons and lastly among households with 10+ persons. Though this difference is not statistically significant, one can conclude that the smaller the household, the higher the probability of the child being below -2SD in relation to weight for height. These two findings thus negate the presupposition that households with many children or children in bigger households are malnourished.
Could the child’s nutrition be affected by whom the child stays with? A comparison of weight for height by the different relationship to the head indicated that no difference was observed by the type of relationship the child had with the household head. However, the results show that children whose relationship to the head was grandparent had the highest proportion of children below -2SD of 40.7 percent followed by those adopted or other relatives at 40.2 percent. Based on these findings it can be concluded that the weight for height which is a current nutrition status is not homogenous by relationship to the head.
4.3. Weight for Age (Underweight)
The results for weight for age (WAZ) are displayed in Table 1. Weight for age is a measure of acute and chronic malnutrition. It takes slightly longer than the current nutritional status to be noticed. The proportion of children who suffered from chronic or acute malnutrition was usually less than that of those whose current nutritional status was less than -2SD. The chronic/acute malnutrition showed that there was no statistical difference between orphans (17.0%) and non-orphans (17.2%). Paternal orphans were also found to be less affected with acute/chronic malnutrition (17%) while maternal orphans had a high proportion of 26 percent of underweight. But the difference between orphans and non-orphans, paternal and non-paternal orphans, maternal and non-maternal were not statistically significant. Hence study was to find out what factors affect acute/chronic malnutrition since there is no difference by survival status of parents.
As with current nutritional status, comparison was made based on the gender of the child, wealth index and education level of mother for children who were living in the same households with their mothers. Also considered were region of enumeration, number of children below five years in the households, number of persons in the household and relationship to household head. Apart from gender, the other three variables showed significant difference in relation to acute/chronic malnutrition. There were slightly more male children (18%) who suffered from acute malnutrition compared to female children (16%).
for the Northern region as most parts of the Northern region were food deficits due to insurgences which had stayed on for long.
On the number of children below five years in the household, there was an increasing proportion of children below -2SD by number of children. The proportion of children below -2SD was 16.3% in households which had one child under 5 years and it rose to 17.9 percent in households with 4 or more children under five. However, this difference was not statistically significant (p=0.914). Same trend was also observed by the number of persons in the household were very negligible difference were
observed ranging between 17.3% in households with less than five persons to 18.0% in households with 10 or more persons.
Further look at weight for age by relationship to head of the household gives contradicting results in comparison to what is known in theory. Children whose relationship to the head was other had the lowest proportion of 15.2%. These were followed by children whose relation to head was child (son or daughter). On the other hand, grand children had the highest proportion of children whose weight for age was below -2SD.
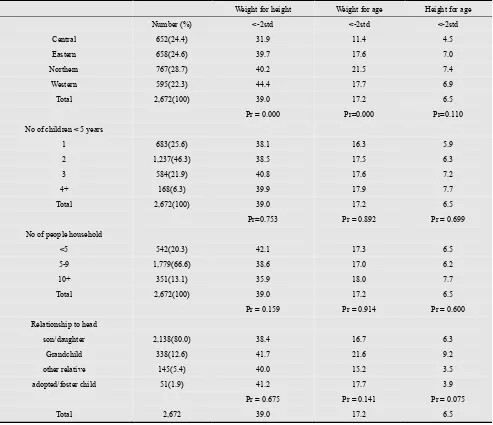
Table 1: Nutritional status of children measured by weight, height and age
Weight for height Weight for age Height for age
Number (%) <-2std1 <-2std <-2std
Orphan 118(4.4)1 33.1 17.0 5.9
Non Orphan 2,554(95.6) 39.2 17.2 6.5
Total 2,672(100) 39.0 17.2 6.5
Pr = 0.178 Pr=0.938 Pr=0.807
Paternal 100(3.7) 29.0 14.0 6.0
Non Paternal orphan 2,572(96.3) 39.4 17.3 6.5
Total 2,672(100) 39.0 17.2 6.5
Pr = 0.037 Pr=0.385 Pr=0.844 Maternal orphan 27(1.0) 48.2 25.9 3.7 Non Maternal orphan 2,645(99.0) 38.9 17.1 6.5
Total 2,672(100) 39.0 17.2 6.5
Pr = 0.325 Pr=0.228 Pr=0.556
Male 1,334(49.9) 40.9 18.0 7.4
Female 1,338(50.1) 37.0 16.4 5.6
Total 2,672(100) 39.0 17.2 6.5
Pr = 0.037 Pr=0.289 Pr=0.067 Wealthy index
Poorest 632(23.7) 44.3 24.4 7.3
Poorer 569(21.3) 40.3 16.2 6.5
Middle 541(20.2) 43.6 16.6 6.3
Richer 463(17.3) 38.2 18.1 6.7
1Richest 467(17.5) 25.5 8.6 5.4
Total 2,672(100) 39.0 17.2 6.5
Pr = 0.000 Pr=0.000 Pr=0.788 No education 574(21.5) 44.4 23.2 7.0
Primary 1,542(57.7) 39.5 16.9 6.6
Secondary 284(16.6) 26.8 9.5 7.4
Higher 56(2.1) 12.5 1.8 3.6
Total 2,4561 (91.9) 38.6 17.2 6.7 Pr = 0.000 Pr=0.000 Pr=0.759
1% >-2SD not shown (Proportion greater than negative two standard deviations not shown) 2 The figures in the brackets are the percentage distribution of children by that characteristics
3 This total is different from the rest because some children were maternal orphans and other non maternal orphans were not staying in the same households with their mothers
4.4. Height for Age (Stunting)
Lastly, Table 1 also displayed the analysis of height for age (stunting). The last indicator which used direct measurement was the height for age (HAZ). Once children suffer from poor current nutrition which goes on for some time, it degenerates itself into acute malnutrition. When the child stays in the state of acute malnutrition for long, the
non-maternal orphans respectively. It was observed that maternal orphans had a higher proportion than non-maternal orphan of acute/chronic malnutrition, the
proportion of maternal orphans stunted was lower than that of the non-maternal orphans. But all these differences were not statistically significant.
Table 1. continued
Weight for height Weight for age Height for age
Number (%) <-2std <-2std <-2std
Central 652(24.4) 31.9 11.4 4.5
Eastern 658(24.6) 39.7 17.6 7.0
Northern 767(28.7) 40.2 21.5 7.4
Western 595(22.3) 44.4 17.7 6.9
Total 2,672(100) 39.0 17.2 6.5
Pr = 0.000 Pr=0.000 Pr=0.110
No of children < 5 years
1 683(25.6) 38.1 16.3 5.9
2 1,237(46.3) 38.5 17.5 6.3
3 584(21.9) 40.8 17.6 7.2
4+ 168(6.3) 39.9 17.9 7.7
Total 2,672(100) 39.0 17.2 6.5
Pr=0.753 Pr = 0.892 Pr = 0.699 No of people household
<5 542(20.3) 42.1 17.3 6.5
5-9 1,779(66.6) 38.6 17.0 6.2
10+ 351(13.1) 35.9 18.0 7.7
Total 2,672(100) 39.0 17.2 6.5
Pr = 0.159 Pr = 0.914 Pr = 0.600 Relationship to head
son/daughter 2,138(80.0) 38.4 16.7 6.3
Grandchild 338(12.6) 41.7 21.6 9.2
other relative 145(5.4) 40.0 15.2 3.5 adopted/foster child 51(1.9) 41.2 17.7 3.9
Pr = 0.675 Pr = 0.141 Pr = 0.075
Total 2,672 39.0 17.2 6.5
As with the other two indicators, also this was done for gender of the child, wealth index of the household, level of education of the mothers in the household and region, number of children below 5 years in the household and household size and relationship to household head. With stuntedness, none of the variables was statistically significant but small variations were noticed. For example, there were more male stunted children (7.4%) than females (5.6%). Based on the wealth index, very minor variations occurred but still children from the poorest households were more badly off. Surprisingly with levels of education, children whose mothers had had secondary education had the highest levels of stunted children (7.4 percent) higher than that of children whose mothers had no education at all (7.0%) and primary education level at 6.6%. In regard to region, apart from the Central region, all other regions had higher levels of stuntedness above the national average of
of children.
5. Conclusions
The three indicators showed that orphaned children were not statistically different from non-orphaned in relations to the three anthropometric indicators. We can therefore conclude that within the available 2006 UDHS data, orphaned children were not more malnourished than non orphans. When you isolate a specific type of orphanhood, paternal orphans were found to be better off than the non paternal orphan. This implies that whereas the fathers may be the bread winners, the death of father does not affect the current nutritional status of children as mothers are always the ones preparing food for the family.
The Western region is the current food basket for Uganda, but it is surprising that the current nutritional status for children is worse off in this region than any other part of Uganda. This may have to do with the feeding practices where the mothers mainly want to feed their children on Matooke (Bananas), milk and millet. Various changes were registered in the three indexes, depended on income; hence areas with high income, fewer children were stunted, while areas in which children eat a variety of foods like fish and sweet potatoes in the East, children do not suffer much from the current nutritional status.
Of these three indicators, height for age in children which is a measure of stuntedness can be used as measure of economic welfare of a household, and good nutritional habits for the household. The nutrition status of orphans being better off than non orphans is an indication that usually households which take on orphans are the ones with better household income. This was found true for this study. Although there was high proportion of orphans in both the poorest and the richest households, with limitations of the small number of orphans, it can be showed that orphans in richest households were not stunted.
High levels of malnutrition are basically a result of food vulnerability. The Anthropometric measures of Weight, Height and Age have proved to be better measures of household income.
It is recommended that large samples can be taken and used to measure country development. Specifically, whereas the sample was one in three for households that were sampled for 2006 UDHS, this proportion can be increased to one in two households to increase the sample space.
Children from poorer households as measured by the household wealth index, whether orphans or not are more likely to be malnourished than other children. It terms of helping, there is need to assist children staying with grandparents as they were the most affected in term of nutrition.
References
[1] WHO (2012) Children: reducing mortality, Fact sheet N°178; http://www.who.int/mediacentre/factsheets/fs178/en/index.h tml
[2] Khan A. A, Bano Nazli and Abdus Salam (2007) ‘Child malnutrition in South Asia: A comparative perspective,’ South Asian Survey Vol: 14; 129-145
[3] Ntozi J.P.M and Khumalo T. (2009) Effects of HIV/AIDS on children in Swaziland: is the extended family coping? (Also
available online
uaps2007.princeton.edu/sessionViewer.aspx?sessionId=505)
[4] Alwang J., Siegel P.B. and Jorgensen L.S. (2001) Vulnerability: A view from different disciplines. Social Protection Discussion Paper series No. 115, The world bank http://www.worldbank.org/sp.
[5] Holzmann, R. and Jorgensen S. (1999) “Social Protection as Social Risk Management: Conceptual Underpinnings for Social Protection Sector Strategy Paper.” Social Protection Discussion Paper No. 9904. The World Bank: Washington, D.C. www.worldbank.org/sp
[6] Kaare Suma (2005) Targeting the chronic poor: Lesson from the OVC programme in Tanzania, Economic and social research foundation (ESRF)
[7] Uganda Bureau of Statistics, UBOS (2006) “Compendium of Statistical Concepts and Definitions used in the Uganda Statistical System and Services” volume iii Kampala Uganda.
[8] International HIV/AIDS alliance (2003) Supporting community action on AIDS in developing countries www.aidsalliance.org/includes/Publication/BBE_Social_incl usion.pdf
[9] Deinings Klaus, Marito G. and Subbarao K. (2003) “AIDS-Induced Orphanhood as a Systemic Shock: Magnitude, Impact, and Program Interventions in Africa.” World Development, vol. 31 (7): 1201-1220
[10] Zimbabwe Ministry of Health report (2004), Harare Zimbabwe
[11] Ayieko M.A. (1997) From Single Parents to Child-headed Households: The Case of Children Orphaned by AIDS in Kisumu and Siaya Districts.
[12] WHO (2006a) Multicentre growth reference study 2006 Geneva: WHO
[13] WHO (2006b) Child Vulnerability and AIDS, case studies from Southern Africa; Stuart Gillespie International Food security Institute, September 2006
[14] Foster, G., Shakespeare R., Chinemana F., Jackson H., Gregson S., Marange C., and Mashumba S. (1995) “Orphan Prevalence and Extended Family Care in a Peri-urban Community in Zimbabwe.” AIDS Care 7(1): 3-17
[15] Ntozi, J.P.M and Zirimenya (1999) Changes in household composition and family structure during the AIDS epidemic in Uganda The Continuing African HIV/AIDS Epidemic: 193-209
<6 years old cared for by relatives in western Kenya Tropical Medicine & International Health 8 (1), 67–72.
[17] Uganda Bureau of Statistics (UBOS) and Macro International (2007). The 2006 Uganda Demographic and Health Survey
[18] Cogill, B. (2003) Anthropometric Indicators Measurement Guide. Food and Nutrition Technical Assistance Project, Academy for Educational Development, Washington, D.C.,
2003 (available on line 20th Jan 2010