International Journal of Engineering Trends and Technology (IJETT) – Volume 18 Number 8 – Dec 2014
ISSN: 2231-5381
http://www.ijettjournal.org
Page 386
High Speed Improved Decision Tree for Mining Streaming Data
M.Rajyalakshmi#1, Dr.P.Srinivasulu#2
1
M.Tech Student (CSE) , QIS College of Engineering &Technology
2
Mtech, Phd HOD CSE Dept,QIS College of Engineering &Technology
ABSTRACT:
Decision tree construction is a well studied problem in data mining. Recently, there was much interest in mining streaming data. For data stream classification, time is a major issue. However, these spatial datasets are too large to be classified effectively in a reasonable period of time using existing methods. Contained in the existing work two theorems presenting the McDiarmids bound for both the data gain, utilized in ID3 algorithm, and for Gini index, applied in Classification and Regression Trees algorithm. However it doesn’t handle compress optimized tree size. Tree size increases because the data size increases.CART/ ID3 with McDiarmid’s bound gives High False positive error rate. In this proposed work, we are going to develop a new method for decision tree classification on spatial data streams using a data structure called Peano Count Tree (P-tree). The Peano Count Tree is a spatial data organization that gives a lossless compressed representation of a spatial data set and facilitates efficient classification and other data mining techniques. Using P-tree structure, fast calculation of measurements, such as information gain, may well be achieved. We compare P-tree based Naive Bayes decision tree induction classification and a classical decision tree induction method with respect for a speed and accuracy. Bayesian averaging over Decision trees allows estimating on attributes to assess the category posterior distribution and estimates the prospect of creating misleading decisions. The clustering problem has actually been addressed in several contexts in plenty of disciplines; due to this problem experimental data ought to clean the data before applying the data mining techniques. In this paper a brand new framework is proposed by integrating decision tree based attribute selection for data clustering. In this proposed system robust Modified Boosting algorithm is proposed to decision trees for clustering the outcomes. Experimental results gives better accuracy compare to existing approaches.
INTRODUCTION
The human quest for predicting future trends and patterns in scenarios like medical diagnosis, scientific research, manufacturing, and e-commerce [1] created the need to collect and analyze raw data and build models from this extracted raw data. According to Witten and Frank,” Data mining is defined as the process of discovering patterns in data “[2]. Data mining is also related to “Knowledge
discovery in data bases [KDD],” which interprets large sets of data automatically [3]. Knowledge discovery is described as a process of identifying useful and comprehensible patterns in data. Data mining, one of the steps of KDD, is a widely used tool in competitive business environments, such as with credit card companies, where the growth of future
customers is predicted from present available customer data. Data mining in business is used to reduce overall cost and enhance profits by predicting buying tendencies of customers [4]. With this aim, companies explore and analyze large sets of business data to make decisions and implement business strategies. Segmented unclear records has been good famous as a necessary challenge. Given a group of statistics data objects, the matter of segmented is to locate a range of homogeneous subsets of data objects, known as clusters, which are well-separated from one another [1]. Within the contextual of unsure statistics, segmentation unsure data objects has recently emerged as an incredibly challenging difficulty geared toward extending the normal segmented procedures (initially conceived to proposed system on deterministic similar objects) to cope with similar objects represented in phrases of chance distributions.
Clustering is a vital method in data warehousing and data mining. It groups similar object together within a cluster (or clusters) and dissimilar object in other cluster (or clusters) or remove from the clustering process. That really is, in fact its's an unsupervised classification in data analysis that arises in many applications in numerous fields such as data mining[3], image processing, machine learning and bioinformatics. Since, in fact its's an unsupervised learning method, it does not need train datasets and pre-defined taxonomies. Fact is that there are several special requirements for search result pages clustering algorithms, two of which most important is, clustering performance and meaningful cluster description. Plenty of clustering technique is available, among those hierarchical clustering and Partition Clustering happens to be the widely used clustering methods. A Partition-clustering algorithm with their outputs produce one clustering set that involves disjoint clusters, i.e., the comprehensive data description is flat. Basically, partitioned clustering is nothing but pre-defined large number of partition range. In which the total number of partition (k) range should be less than number of object (n) among the dataset. Partition clustering always should satisfy the condition k < n.
A Hierarchical clustering is naturally a nested of partitions technique depend on the business requirements. It produces not merely one clustering taking place in their outputs except a hierarchy of clusters. This procedure function for both type of approach either bottom up and top down approach. Within this method all record object arranged between a huge cluster, then big cluster are continuously divided into small clusters.
There are actually mainly two machine learning strategies [2]:
1) Supervised learning
International Journal of Engineering Trends and Technology (IJETT) – Volume 18 Number 8 – Dec 2014
ISSN: 2231-5381
http://www.ijettjournal.org
Page 387
system is to discover this relationship connecting the input examples, and of course the answers.
For instance, a system just might be shown various images of faces, where each one has domain. The machine could then be shown a different image perhaps one of the faces, and will output the name of a given face.
2) Unsupervised Learning Strategy
In unsupervised learning, the operating system is not provided with any answers, or correct outputs. The academic process usually aims to locate patterns and correlations within the data. For instance, a store could record the items that people buy; a learning system could then find correlations between different items that may bought together.
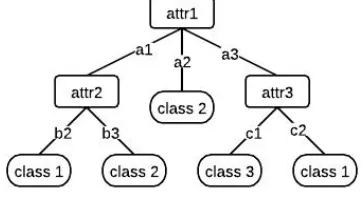
Decision tree induction [1], will be the learning of decision trees from class-labeled training tuples. A call tree serves as a flowchart-like tree structure, where each internal node (nonleaf node) denotes a test traveling on an attribute, each branch represents an outcome of the test, and each leaf node (or terminal node) holds a class label. The topmost node inside a tree is the root node. Instances are classified beginning from the main node and sorted dependent on their feature values. The leaf node reached is regarded as the instruction label for that example. The algorithm can naturally handle binary or multiclass classification problems. The leaf nodes can refer to either of the K classes concerned.
Fig. 1 shows an example of a decision tree for the training set of Table 1.
The feature that best divides the training data would be the root node of the tree. The same procedure is then repeated on each partition of the divided data, creating subtrees until the training data is divided into subsets of the same class[1].
RELATED AND PROPOSED WORK
Roughly speaking, our aim is to mine a high quality decision tree shared by two datasets, which provides high classification accuracy and highly similar data distributions. Before defining this problem, we first need to describe the input data for our problem, and introduce several concepts, including what is a shared decision tree, what is a high quality shared decision tree. To mine decision tree shared by
two datasets, we need two input datasets D1 and D2. D1 and
D2 are assumed to share an identical set of attributes. For the
case that they contain different sets of attributes, the user will
need to determine equivalence between attributes of D1 and
attributes of D2, and then map the attributes of D1 and D2 to
an identical set of attributes using the equivalence relation
and eliminate those attributes of Di that have no\ equivalent
attributes in Dj , j̸=i.
A shared decision tree is a decision tree, that can be used to
accurately classify data in dataset D1 and accurately classify
data in dataset D2. A high quality shared decision tree is a
decision tree that has high data distribution similarity, and
has high shared tree accuracy in both datasets D1 and D2.
Data distribution similarity (DS) captures cross-dataset distribution similarity of a tree
(DST). DST measures the similarity between the distributions of the classes of data in the two datasets in the nodes of the tree. It is based on the concepts of class distribution vector (CDV) and distribution similarity of a node (DSN). We use the class distribution vector (CDV) for
a node V of a tree T to describe the distribution of the classes
of a dataset Di at V , that is: CDVi(V ) = (Cnt(C1; SDi(V ));
Cnt(C2; SDi(V ))); (4.1)
where Cnt (Cj , SDi(V ))= | {t ∈ SDi(V ) | t′s class is
Cj}|.
While SDT-Miner is similar to C4.5 in the tree building
process2, it differs from C4.5
(i) concerning purpose (mining a decision tree shared by two datasets vs mining a decision tree for a single dataset), and (ii) regarding two new ideas on how to select the splitting attribute (it selects attributes (a) with high data distribution similarity in two given datasets, and (b) with high
information gain in two given datasets). SDT-Miner (see
Algorithm 1) has four input parameters: Two Datasets (D1
and D2), a set (AttrSet) of candidate attributes for use in
shared decision trees, a dataset size threshold (MinSize) for
split termination. SDT-Miner builds a shared decision tree by
using the SDTNode function () recursively.
A selection tree Tis a kind of the records that encodes the distribution of the category label in phrases of the predictor attributes. It is a directed, acyclic graph in variety of a tree. The idea of the tree doesn't have any incoming edges. Every other node has exactly one incoming edge and zero or more outgoing edges. If a node n has no outgoing edges we call n a leaf node, otherwise we call nan internal node. Each leaf node is labeled with one elegance label; each internal node is labeled with one predictor attribute known as the splitting attribute.
Each edge originating from an internal node n has a predicate q linked to it where q requires only the splitting attribute of n. The set of predicates P on the outgoing edges of an internal node need to be non-overlapping and total. A group of predicates Pis non-overlapping if the conjunction of any two predicates in P evaluates to fake. A group of predicates P is total if the disjunction of all predicates in P evaluates to true. We are going to call the set of predicates on the outgoing edges of an internal node nthe splitting predicates of n; the combined data of splitting attribute and splitting predicates is named the splitting standards of n and is
denoted by crit(n). For an internal node , let
International Journal of Engineering Trends and Technology (IJETT) – Volume 18 Number 8 – Dec 2014
ISSN: 2231-5381
http://www.ijettjournal.org
Page 388
let qp!nbe the predicate on the sting ep! n from p to n. The family unit of the node n is the set of tuples F(n) such that for each tuple t2F(), t2F(p)and qp!t evaluates to true. Informally, the family unit of a node n is the set of tuples of the database that follows the trail from the basis to n when being categorized by the tree. Each trail W from the premise r to a leaf node n corresponds to a classifier rule R=P!c, where P is the conjunction of the predicates along the edges in Wand c is the category label of node n.
There are two techniques to manage the dimensions of a classification technique tree. A bottom-up pruning algorithm [MRA95] has two phases: In section one, the expansion segment, an incredibly deep tree is constructed. In section two, the pruning section, this tree is reduce to evade overfitting the training statistics. In a topdown pruning algorithm [RS98] the 2 phases are interleaved: Stopping standards are calculated during tree progress to inhibit further progress of parts of the tree when appropriate. In this enterprise, we are going to think about the tree progress segment, since it is because of its data-intensive nature the foremost time-consuming portion of choice tree progress [MAR96, SAM96]. Whether the tree is pruned topdown or bottom-up is an orthogonal problem. Agrawal et al. introduce in [AG92] an period classification technique that may use database indices to efficiently retrieve elements of the labeled source code making use of SQL queries. However, the tactic doesn't scale to substantial training units [SAM96]. Fukuda et al. [FMM96] assemble determination wood with two dimensional splitting standards. Although their algorithm can produce policies with very immoderate classification technique accuracy, scalability was not among the many layout objectives. Moreover, the choice tree not has the intuitive illustration of a tree with one-dimensional splits at each node. The choice
tree classification technique in [MAR96], known as SLIQ, was designed for giant databases but makes use of an in-memory records constitution that grows linearly with the diversity of tuples contained in the training database. This limiting facts constitution was eradicated in [SAM96], which launched Dash, a scalable classification technique. Dash works for very substantial datasets and removes all relationships between major memory and measurement of the source code. Dash builds classification technique wood with binary splits making use of the gini index [BFOS84] to choose the splitting criterion; it
controls the last word quality of the choice tree via an application of theMDL notion [Ris89,MRA95]. To select the splitting attribute at a node n, the algorithm requires access to F(n)for each ordered attribute in sorted order. So conceptually, for each node nof the choice tree, a kind of F(n)for each ordered attribute is required. Dash avoids sorting at each node by way of the creation of attribute lists. The attribute record La for attribute ais a vertical partition of the training database D: For each tuple t2Dthe access of t into La consists of the projection of onto a, the category label and t’s record identifier. The attribute lists are created in the beginning of the algorithm and sorted once as a filtering step.
During the tree growth phase, whenever an internal node nsplits, F(n)is distributed among n’s children according to crit(). Since every tuple is vertically partitioned over all attribute lists, each attribute list needs to be distributed
separately. The distribution of an attribute list is performed through a hash-join with the attribute list of the splitting attribute; the record identifier, which is duplicated into each attribute list, establishes the connection between the parts of the tuple. Since during the hash-join each attribute list is read and distributed sequentially, the initial sort order of the attribute list is preserved.
In recent work, Morimoto et al. developed algorithms for decision tree construction for categorical predictor variables with large domains [2]; the emphasis of this work is to improve the quality of the resulting tree. Rastogi and Shim developed PUBLIC, a scalable decision tree classifier using top-down pruning [RS98]. Since pruning is an orthogonal dimension to tree growth, their techniques can be easily incorporated into our schema.
Existing approach:
Input: node n, partition D, classification algorithm CL Output: decision tree for rooted at n
Top-Down Decision Tree Induction Schema: BuildTree(Node n, datapartition D, algorithm CL) (1) Apply CLto Dto find crit(n)
(2) let kbe the number of children of n
(3) if (k >0)
(4) Create kchildren c1;:;ckof n
(5) Use best split to partition Dinto D1;:;Dk
(6) for (i=1; i_k; i++)
(7) BuildTree(ci, Di) (8) endfor
(9) endif
RainForest Refinement:
(1a) for each predictor attribute p
(1b) Call CL:findbestpartitioning(AVC-set of p)
(1c) endfor
(2a) k= CL:decidesplitingcriterion();
Figure 1: Tree Induction Schema and Refinement CART work approach includes three leading phases. Within the first stage a flowery tree with maximum dimension is grown by recursively partitioning the data; this tree can have many terminal nodes. Despite the fact that the tree interprets facts flawlessly, when it over matches the records the predictive means becomes low. Within the second stage, a gaggle of nodes is shed to scale back the dimensions of the tree, a technique known as pruning. Contained in the best stage, predictive error is taken into account as criterion to decide upon optimum tree.
The tactic of developing the tree by CART is summarized as follows:
1. Assign the records data objects to a root hierarchical node node.
2. Settle upon splitting criterion and explanatory variable that reduces impurity.
3. Break up the idea node into two infant nodes by dividing the facts similar objects in accordance with a splitting criterion and impartial or explanatory variable selected from the group of facts data objects.
4. Repeat the above two steps considering each resulting node as a mum or dad node until eventually the utmost measurement tree is obtained.
5. Prune the tree by eliminating a bunch of nodes making use of cross validation and value complexity [13].
Pruning
International Journal of Engineering Trends and Technology (IJETT) – Volume 18 Number 8 – Dec 2014
ISSN: 2231-5381
http://www.ijettjournal.org
Page 389
properly, the prediction accuracy of the tree is low for brand new samples. As a result, there's a necessity to construct a tree with better accuracy and predictive capacity. Pruning develops an best tree, by shedding off the branches of the massive tree. The pruning system develops a series of smaller timber and computes fee complexity for each tree. Depends on the cost-complexity parameter, the pruning approach determines the best tree with immoderate accuracy.
Multiclass classification technique difficulty will be to map statistics samples right into a little greater than two lessons. There's only two leading approaches for fixing multiclass classification technique problems. The first method deals directly with the multiclass difficulty and makes use of approaches like Selection Wood, Neural Networks [1], k-Nearest Neighbor and Naive Bayesian classification algorithms. The major difficulty with this system is to work out traits that may distinguish programs when the big selection of courses raises. Consequently, this system is probably going to yield lower accuracy. A classifier algorithm for records streams must meet a number of different necessities from the standard setting (Bifet et al., 2009). The foremost substantial are the subsequent. First, procedure one example at a time, and verify it at most once. The statistics examples pass in and out of a system one after another. Each example need to be common contained in the order where it arrives. Once inspected or ignored, the instance is discarded with no approach to retrieve it. Second, use a restricted extent of memory. Memory will be simply exhausted devoid of limiting its allocation because the extent of the records is
possibly countless. Third, proposed system in a restricted time period. However most conventional techniques are quick enough when classifying examples, the training processes are time consuming. For an algorithm to scale simply to any variety of examples, its training complexity need to be linear for a diversity of examples, such that on-line getting to know is feasible. Fourth, be equipped to take part in classification technique at any time. This can be the so-called any-time belongings, which indicates that the induction approach is able to be utilized at any facet between training examples[1].
Decision tree induction algorithms on data streams
Decision tree is one of the most often used techniques in the data mining literature. Each node of a decision tree contains a test on an attribute. Each branch from a node corresponds to a possible outcome of the test and each leaf contains a class prediction. A decision tree is constructed by recursively replacing leaves by test nodes, starting at the root. The attribute to test in a leaf is chosen by comparing all available attributes and choosing the best one[2]. according to some heuristic evaluation function. Classic decision tree learners like ID3, C4.5, and CART assume that all training examples can be stored simultaneously in memory, and thus are severely limited in the number of examples from which they can learn.
Predictive clustering
Especially, the predictive modeling approaches that partition the examples into subsets, e.g., determination wood and choice restrictions, may also be considered as segmented
approaches.Namely, a choice tree might be considered a hierarchy of clusters, where each node is a cluster; such a tree is named a segmentation tree. Likewise, a call rule can characterize a cluster of examples which it covers. The advantage of utilizing these procedures for segmentation is that, moreover for a clusters themselves, we also get symbolic descriptions of the constructed clusters. Every cluster in a tree has a symbolic description contained in the type of a conjunction of stipulations on the trail from the basis of the tree for a given node, and each cluster represented by a rule is described by the rule’s condition. There's, however, a change between tree clusters and rule[4] clusters. Tree clusters are ordered in a hierarchy and don't overlap, while ‘rule’ clusters generally aren't ordered in any approach (they're flat) and may overlap (one example can belong to a number of cluster). We are able to say that segmentation timber are a hierarchical segmented procedure, and segmentation regulations are a partitional (and most likely fuzzy) segmentation system.
Brieman, Friedman, Olshen, and Stone developed the CART algorithm in 1984. It builds a binary tree. Observations are break up at each node by a functionality on one attribute. The break up is chosen which divides the observations at a node into subgroups wherein a unmarried magnificence most predominates. When no cut up might be found that raises the category specificity at a node the tree has reached a leaf node. When all observations are in leaf nodes the tree has stopped developing. Each leaf can then be assigned a category and an error fee (not every statement in a leaf node is of an identical magnificence). Because the later splits have smaller and fewer consultant samples to proposed system with they may overfit the statistics.
Therefore, the tree may be cut back to a size which allows effective generalization to new data. Branches of the tree that do not enhance predictive classification accuracy are eliminated in a process known as "pruning."
Algorithm:
Input: node n, partition D, classification algorithm CL
Output: decision tree for rooted at n
Top-Down Decision Tree Induction Schema:
BuildTree(Node n, datapartition D, algorithm CL)
(1) Apply CLto Dto find crit(n)
(2) let kbe the number of children of n
(3) if (k >0)
(4) Create kchildren c1;:;ckof n
(5) Use best split to partition Dinto D1;:;Dk
(6) for (i=1; i_k; i++)
(7) BuildTree(ci, Di)
(8) endfor
(9) endif
RainForest Refinement:
International Journal of Engineering Trends and Technology (IJETT) – Volume 18 Number 8 – Dec 2014
ISSN: 2231-5381
http://www.ijettjournal.org
Page 390
(1b) Call CL:findbestpartitioning(AVC-set of p)
(1c) endfor
(2a) k= CL:decidesplitingcriterion();
Tree Induction Schema and Refinement
.
Experimental Results:
Rules generated :
class <50 IF : 34.0<=age<=58.0 ^ sex in
{female,male} ^ cp in
{typ_angina,asympt,non_anginal} ^
110.0<=trestbps<=140.0 ^ 175.0<=chol<=340.0 ^ fbs
in {t,f} ^ restecg in {left_vent_hyper,normal} ^
115.0<=thalach<=190.0 ^ exang in {no,yes} ^
oldpeak=0.0 ^ slope in {up,flat} ^ 0.0<=ca<=0.674497
^ thal in {fixed_defect,normal} (29)
class >50_1 IF : age=57.0 ^ sex in {female} ^
cp in {atyp_angina} ^ trestbps=130.0 ^ chol=236.0 ^
fbs in {f} ^ restecg in {left_vent_hyper} ^
thalach=174.0 ^ exang in {no} ^ oldpeak=0.0 ^ slope
in {flat} ^ ca=1.0 ^ thal in {normal} (1)
class >50_1 IF : 44.0<=age<=67.0 ^ sex in
{male} ^ cp in {asympt,non_anginal} ^
100.0<=trestbps<=164.0 ^ 166.0<=chol<=300.0 ^ fbs
in {t,f} ^ restecg in {left_vent_hyper} ^
90.0<=thalach<=173.0 ^ exang in {no, yes} ^
0.0<=oldpeak<=4.0 ^ slope in {up,flat} ^
1.0<=ca<=2.0 ^ thal in
{fixed_defect,normal,reversable_defect} (32)
class >50_1 IF : 59.0<=age<=64.0 ^ sex in
{female,male} ^ cp in
{typ_angina,asympt,non_anginal} ^
130.0<=trestbps<=174.0 ^ 249.0<=chol<=335.0 ^ fbs
in {f} ^ restecg in {left_vent_hyper,normal} ^
125.0<=thalach<=169.0 ^ exang in {no,yes} ^
oldpeak=0.0 ^ slope in {up,flat} ^ ca=0.0 ^ thal in
{normal} (4)
class >50_1 IF : age=58.0 ^ sex in {female} ^
cp in {atyp_angina} ^ trestbps=136.0 ^ chol=319.0 ^
fbs in {t} ^ restecg in {left_vent_hyper} ^
thalach=152.0 ^ exang in {no} ^ oldpeak=0.0 ^ slope
in {up} ^ ca=2.0 ^ thal in {normal} (1)
class >50_1 IF : age=57.0 ^ sex in {male} ^
cp in {atyp_angina} ^ trestbps=154.0 ^ chol=232.0 ^
fbs in {f} ^ restecg in {left_vent_hyper} ^
thalach=164.0 ^ exang in {no} ^ oldpeak=0.0 ^ slope
in {up} ^ ca=1.0 ^ thal in {normal} (1)
class >50_1 IF : 58.0<=age<=65.0 ^ sex in
{male} ^ cp in {typ_angina,atyp_angina} ^
120.0<=trestbps<=138.0 ^ 282.0<=chol<=284.0 ^ fbs
in {t,f} ^ restecg in {left_vent_hyper} ^
160.0<=thalach<=174.0 ^ exang in {no} ^
1.4<=oldpeak<=1.8 ^ slope in {flat} ^ 0.0<=ca<=1.0 ^
thal in {normal} (2)
class >50_1 IF : 46.0<=age<=67.0 ^ sex in
{male} ^ cp in {asympt,non_anginal} ^
100.0<=trestbps<=148.0 ^ 131.0<=chol<=353.0 ^ fbs
in {t,f} ^ restecg in {normal} ^
113.0<=thalach<=168.0 ^ exang in {no,yes} ^
0.0<=oldpeak<=3.6 ^ slope in {up,flat} ^
1.0<=ca<=2.0 ^ thal in
{fixed_defect,normal,reversable_defect} (18)
class >50_1 IF : age=68.0 ^ sex in {male} ^
cp in {asympt} ^ trestbps=144.0 ^ chol=193.0 ^ fbs in
{t} ^ restecg in {normal} ^ thalach=141.0 ^ exang in
{no} ^ oldpeak=3.4 ^ slope in {flat} ^ ca=2.0 ^ thal in
{reversable_defect} (1)
class >50_1 IF : age=58.0 ^ sex in {male} ^
cp in {asympt} ^ trestbps=146.0 ^ chol=218.0 ^ fbs in
{f} ^ restecg in {normal} ^ thalach=105.0 ^ exang in
{no} ^ oldpeak=2.0 ^ slope in {flat} ^ ca=1.0 ^ thal in
{reversable_defect} (1)
class >50_1 IF : 55.0<=age<=66.0 ^ sex in
{female} ^ cp in {asympt,non_anginal} ^
128.0<=trestbps<=200.0 ^ 164.0<=chol<=409.0 ^ fbs
in {t,f} ^ restecg in
{left_vent_hyper,normal,st_t_wave_abnormality} ^
97.0<=thalach<=165.0 ^ exang in {no,yes} ^
1.0<=oldpeak<=6.2 ^ slope in {flat,down} ^
1.0<=ca<=3.0 ^ thal in {reversable_defect} (9)
class >50_1 IF : 49.0<=age<=70.0 ^ sex in
{male} ^ cp in {asympt,non_anginal} ^
118.0<=trestbps<=165.0 ^ 149.0<=chol<=330.0 ^ fbs
International Journal of Engineering Trends and Technology (IJETT) – Volume 18 Number 8 – Dec 2014
ISSN: 2231-5381
http://www.ijettjournal.org
Page 391
108.0<=thalach<=139.0 ^ exang in {no,yes} ^
0.8<=oldpeak<=4.2 ^ slope in {up,flat} ^ ca=3.0 ^
thal in {normal,reversable_defect} (8)
class >50_1 IF : 38.0<=age<=45.0 ^ sex in
{male} ^ cp in {typ_angina} ^
110.0<=trestbps<=120.0 ^ 231.0<=chol<=264.0 ^ fbs
in {f} ^ restecg in {normal} ^ 132.0<=thalach<=182.0
^ exang in {no,yes} ^ 1.2<=oldpeak<=3.8 ^ slope in
{flat} ^ ca=0.0 ^ thal in {reversable_defect} (2)
class >50_1 IF : 35.0<=age<=59.0 ^ sex in
{male} ^ cp in {typ_angina,asympt} ^
110.0<=trestbps<=170.0 ^ 172.0<=chol<=288.0 ^ fbs
in {f} ^ restecg in {left_vent_hyper} ^
156.0<=thalach<=166.0 ^ exang in {no,yes} ^
0.0<=oldpeak<=0.5 ^ slope in {up,flat} ^ ca=0.0 ^
thal in {reversable_defect} (4)
class >50_1 IF : age=57.0 ^ sex in {female} ^
cp in {asympt} ^ trestbps=140.0 ^ chol=241.0 ^ fbs in
{f} ^ restecg in {normal} ^ thalach=123.0 ^ exang in
{yes} ^ oldpeak=0.2 ^ slope in {flat} ^ ca=0.0 ^ thal
in {reversable_defect} (1)
class >50_1 IF : age=43.0 ^ sex in {male} ^
cp in {asympt} ^ trestbps=132.0 ^ chol=247.0 ^ fbs in
{t} ^ restecg in {left_vent_hyper} ^ thalach=143.0 ^
exang in {yes} ^ oldpeak=0.1 ^ slope in {flat} ^
ca=0.674497 ^ thal in {reversable_defect} (1)
class >50_1 IF : 35.0<=age<=70.0 ^ sex in
{female,male} ^ cp in
{asympt,non_anginal,atyp_angina} ^
110.0<=trestbps<=180.0 ^ 167.0<=chol<=341.0 ^ fbs
in {t,f} ^ restecg in {left_vent_hyper,normal} ^
103.0<=thalach<=168.0 ^ exang in {no,yes} ^
0.9<=oldpeak<=5.6 ^ slope in {flat,down} ^ ca=0.0 ^
thal in {reversable_defect} (17)
class <50 IF : 29.0<=age<=70.0 ^ sex in
{female,male} ^ cp in {atyp_angina} ^
105.0<=trestbps<=156.0 ^ 157.0<=chol<=308.0 ^ fbs
in {t,f} ^ restecg in {left_vent_hyper,normal} ^
140.0<=thalach<=202.0 ^ exang in {no,yes} ^
oldpeak=0.0 ^ slope in {up,down} ^ ca=0.0 ^ thal in
{normal} (16)
class >50_1 IF : age=63.0 ^ sex in {female} ^
cp in {asympt} ^ trestbps=124.0 ^ chol=197.0 ^ fbs in
{f} ^ restecg in {normal} ^ thalach=136.0 ^ exang in
{yes} ^ oldpeak=0.0 ^ slope in {flat} ^ ca=0.0 ^ thal
in {normal} (1)
class >50_1 IF : age=52.0 ^ sex in {male} ^
cp in {asympt} ^ trestbps=128.0 ^ chol=204.0 ^ fbs in
{t} ^ restecg in {normal} ^ thalach=156.0 ^ exang in
{yes} ^ oldpeak=1.0 ^ slope in {flat} ^ ca=0.0 ^ thal
in {normal} (1)
class >50_1 IF : 55.0<=age<=62.0 ^ sex in
{female} ^ cp in {asympt} ^ 150.0<=trestbps<=180.0
^ 244.0<=chol<=327.0 ^ fbs in {f} ^ restecg in
{normal,st_t_wave_abnormality} ^
117.0<=thalach<=154.0 ^ exang in {yes} ^
1.4<=oldpeak<=3.4 ^ slope in {flat} ^ ca=0.0 ^ thal in
{normal} (2)
class >50_1 IF : 42.0<=age<=44.0 ^ sex in
{male} ^ cp in {asympt} ^ 120.0<=trestbps<=136.0 ^
169.0<=chol<=315.0 ^ fbs in {f} ^ restecg in
{normal} ^ 125.0<=thalach<=144.0 ^ exang in {yes} ^
1.8<=oldpeak<=2.8 ^ slope in {flat,down} ^ ca=0.0 ^
thal in {fixed_defect} (2)
class >50_1 IF : 58.0<=age<=64.0 ^ sex in
{female,male} ^ cp in {asympt} ^
114.0<=trestbps<=140.0 ^ 246.0<=chol<=318.0 ^ fbs
in {f} ^ restecg in
{left_vent_hyper,st_t_wave_abnormality} ^
96.0<=thalach<=160.0 ^ exang in {no,yes} ^
2.2<=oldpeak<=4.4 ^ slope i n {down} ^ 1.0<=ca<=3.0
^ thal in {fixed_defect,normal} (3)
class <50 IF : 63.0<=age<=66.0 ^ sex in
{male} ^ cp in {typ_angina,asympt} ^
145.0<=trestbps<=160.0 ^ 228.0<=chol<=233.0 ^ fbs
in {t,f} ^ restecg in {left_vent_hyper} ^
138.0<=thalach<=150.0 ^ exang in {no} ^
oldpeak=2.3 ^ slope in {up,down} ^ ca=0.0 ^ thal in
{fixed_defect} (2)
class <50 IF : 34.0<=age<=66.0 ^ sex in
{female,male} ^ cp in
{t yp_angina,asympt,non_anginal,atyp_angina} ^
International Journal of Engineering Trends and Technology (IJETT) – Volume 18 Number 8 – Dec 2014
ISSN: 2231-5381
http://www.ijettjournal.org
Page 392
in {t,f} ^ restecg in {left_vent_hyper,normal} ^
114.0<=thalach<=192.0 ^ exang in {no,yes} ^
0.1<=oldpeak<=3.5 ^ slope in {up,down} ^ ca=0.0 ^
thal in {normal} (27)
class >50_1 IF : age=67.0 ^ sex in {male} ^
cp in {non_anginal} ^ trest bps=152.0 ^ chol=212.0 ^
fbs in {f} ^ restecg in {left_vent_hyper} ^
thalach=150.0 ^ exang in {no} ^ oldpeak=0.8 ^ slope
in {flat} ^ ca=0.0 ^ thal in {reversable_defect} (1)
class >50_1 IF : age=70.0 ^ sex in {male} ^
cp in {non_anginal} ^ trest bps=160.0 ^ chol=269.0 ^
fbs in {f} ^ restecg in {normal} ^ thalach=112.0 ^
exang in {yes} ^ oldpeak=2.9 ^ slope in {flat} ^
ca=1.0 ^ thal in {reversable_defect} (1)
=== Classification Accuracy ===
Correctly Classified Instances 246
81.1881 %
Incorrectly Classified Instances 57
18.8119 %
Total Number of Instances 303
Samples ExistingApproach ProposedApproach
glass-100 67.99 76.8
glass-150 71.24 83.77
glass-200 72.46 88.55
glass-300 73.55 85.77
glass-400 82.55 90
Accuracy Comparison
0 20 40 60 80 100
glass-100
glass-150
glass-200
glass-300
glass-400
Dataset sizes
A
ccu
racy ExistingApproach
ProposedApproach
Conclusion
In this paper, the PM algorithm was motivated by our interest in uncertain data clustering of both discrete and continuous phase. We explore clustering uncertain data based on the similarity between their distributions. We advocate using the Probability–maximization algorithm as
the probability similarity measurement, and systematically define the PM divergence between objects in both the continuous and discrete cases. We integrated PM divergence into the partitioning and density-based clustering methods to demonstrate the effectiveness of clustering using PM divergence.We propose a new condition of generating terminal nodes so that the decision tree is optimized in the number of nodes and leaves. In addition, the speed is also improved. But when dataset has small number of attributes, the precision will be influenced.Experimental results give better results appro > 96 % with different datasets are tested. The pruning method of this algorithm will be also studied in future work.
REFERENCES:
[1] Yakup Yildirim,Adnan Yazici, Turgay Yilmaz, “Automatic Semantic Content Extraction in Videos Using a Fuzzy Ontology and Rule-Based Model," IEEE Transations knowl. Data Eng.25(1): 47-61(2013).
[2] M. Petkovic and W. Jonker, “An Overview of Data Models and Query Languages for Content-Based Video\ Retrieval," Proc. Int'l Conf. Advances in Infrastructure for EBusiness, Science, and Education on the Internet, Aug. 2000.
[3] M. Petkovic and W. Jonker, “Content-Based Video Retrieval by Integrating Spatiotemporal and Stochastic Recognition of Events," Proc. IEEE Int'l Workshop Detection and Recognition of Events in Video, pp. 75-82, 2001.
[4] L. Bai, S.Y. Lao, G. Jones, and A.F. Smeaton, “Video Semantic Content Analysis Based on Ontology,” IMVIP ’07: Proc. 11th Int’l Machine Vision and Image Processing Conf., pp. 117-124, 2007.
[5] G.G. Medioni, I. Cohen, F. Bre´mond, S. Hongeng, and R. Nevatia, “Event Detection and Analysis from Video Streams,” IEEE Trans. Pattern Analysis Machine Intelligence, vol. 23, no. 8, pp. 873-889, Aug. 2001.
[6] S. Hongeng, R. Nevatia, and F. Bre´mond, “Video-Based Event Recognition: Activity Representation and Probabilistic
Recognition Methods,” Computer Vision and Image
Understanding, vol. 96, no. 2, pp. 129-162, 2004.