Power System Security Improvement by a Linear
Approximation Method
1
U.N. Asibeluo and
2T.C. Madueme
1Department of Electrical Engineering, Nnamdi Azikiwe University, Awka 2
Department of Electrical Engineering, University of Nigeria, Nsukka
Abstract
This paper presents a linear approximation method for calculating risk-based index of low voltage security. MATLAB source codes using the concept of risk that considers both the probability of occurrence and the severity of the contingency were used to analyze the low voltage security. Sensitivities of voltage with respect to active power and reactive power, the mean/variance of the load uncertainty were used to achieve the Probability distribution. Continuous severity function was adopted to quantify the severity because it uniformly quantifies the severity of the contingencies. The Nigerian 330KV transmission grid was used to illustrate the proposed method and the risk indices were evaluated after a contingency was simulated. The calculated risk indices reflect a quantitative measure of the system low voltage security levels. They are efficient means of quickly indentifying and investigating situations that cause high risk to the system.
Keywords: Power system security, risk-based index,
severity function
I. INTRODUCTION
The Nigerian power system that the government has regulated heavily, is now undergoing deregulation and the competitive/uncertain market environment has resulted to operating the power system in highly stressed and unpredictable conditions. Hence, the network has become more vulnerable and the need to monitor the system’s security level had increased. This is frequently driving operators to make complex decisions whether or not to take action, which actions to take and to what extent. In order to address the decisions making problem, security analysis must be carry out on the power system. Power system security is the ability of the power system to withstand one or more component outages with minimal disruption of service or its quality [1].
The determination of security level for a given operating condition has been done traditionally using deterministic criteria. Under deterministic criteria, an operating condition is secure if it can withstand the effect of each, and every contingency in a pre-specified contingency set [2, 3, 4]. However, with industry’s emphasis on economic competition and with the associated increased network vulnerability, there is a growing alternative approach based on the concept of
risk, within the context of operational decisions making [2]. This method considers both probability and
impact of the
contingency [5]. The impact can be measured in terms of the voltage and current violations, Energy Not Served (ENS), and/or cost.The purpose of this paper is to contribute to the improvement of the Nigeria power system security using the promising risk-based method.
II. RISK-BASED SECURITY ASSESSMENT
(RBSA)
The RBSA techniques are explicitly based on the concept of risk and they evaluate security margins beyond the deterministic method (credibility and severity) by taking into account the likelihood (probabilistic) nature of many uncertain events. The authors of references [2, 6, 7, 8, 9,] discussed different models of risk based security assessment and some of the methods discussed include independent single element outage model, multiple element outage model, risk based optimal power flow, sensitivity based methods, weighted multi-criteria decisions making, and methods based on evidential theory.
The techniques worked out a single risk index after considering the likelihood and severity of each contingency. The risk index quantifies the degree of risk of the current operating conditions when the system experiences a contingency(s) [10, 11]. In simplified terms, risk index is the product of contingency likelihood and its severity. In mathematical terms;
Risk Index = Probability x Impact
(1)
A.
Probability(2)
Where, : is the number of occurrence. : is the mean number of events during a given unit of time.
B. Impact
Severity provides a quantitative evaluation of what would happen to the power system in the specified condition in terms of impact, consequence, or cost [7]. Severity functions are used to uniformly quantify the severity of network condition in terms of performance indicators and they should reflect the consequences of the contingency and loading conditions in terms of network parameters that are understandable to system operators. In general, there are three types of severity functions: discrete, continuous and percentage of violation severity function [7].
III. METHODOLOGY
In this paper, we adopt linear approximation model of evaluating the risk indices of low voltage security based on sensitivity method of probabilistic contingency analysis, because sensitivity techniques are quick and easy ways of computing any possible violations of operating limits. In addition, when applied to linear systems they are efficient even when the systems are very large.
A. The Linear Approximation Method of Risk-Based Low Voltage Security Assessment (RBVSA)
The linear approximation method requires the probability of voltage distribution, probability of contingency and the severity function to evaluate the risk indices of low voltage security.
I.) Probability of Voltage Distribution: The standard deviation calculation from variance – covariance matrix and sensitivities of voltage with respect to active (P) and reactive (Q) power are required to evaluate the probability of voltage distribution. The sensitivities can be obtained from the Jacobian matrix (J) of the basic load flow problem, by simply inverting the Jacobian matrix using special techniques. Newton Raphson load flow algorithm was used due to its inherent advantages of accuracy and fast convergence. However, only the stressed buses sensitivities are evaluated and they are located at the particular stress row of J-1. Assuming that the stressed voltage bus is ith bus, then the probability distribution of
will be;
(3)
Where;
= the probability distribution of
= the standard deviation of
= the mean deviation of
II) Probability of Contingency: The events of contingency (Ei) are modeled to be Poisson distributed
since they are rare events [11]. The formula for Poisson distribution is,
(4)
Where
is the occurrence rate of contingency per time interval and is the contingency.
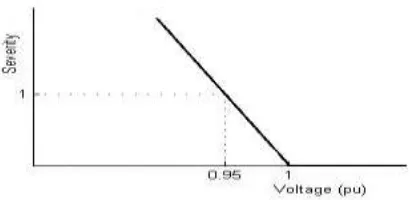
III) Low Voltage Severity Function: We adopt continuous severity function because it measures the extent of the violation and it can be compose easily. The continuous severity evaluates to 1.0 for each bus at the deterministic limits (0.95 pu) and increases linearly as voltage magnitude fall below limits. Figure 1 shows an illustration of continuous severity function.
Figure 1: Continuous severity functions for low voltage.
B. Risk Evaluation
From equation (1) can be modification as follows in order to evaluate the low voltage risk of a real power system [12]:
(5)
Where
Xt,f is forecast uncertain loading conditions at time t.
: is the probability of ith contingency.
: is the severity function that quantifies the impact of the ith contingency with variation of the bus voltage.
This modified equation (5) is used to evaluate the total low voltage risk for all probable contingencies.
IV. SIMULATION
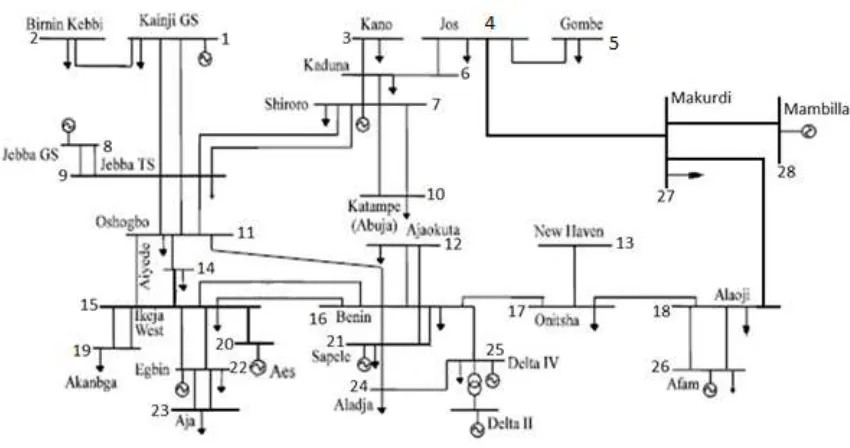
The Nigerian 330kV transmission grid has been used as a case study system to evaluate the performance of the proposed method. The study system single line diagram is shown in figure 2. [13] and the line data and bus data are shown in tables I and II respectively. A line outage was simulated to evaluate the system risk indices and the simulation was done by simply removing the line information from the line data. The load mean values were assumed to be the same as the base case forecast values and 2% load standard deviation was assumed and MATLAB software was used for the simulation.
Figure 2: Single line diagram of Nigerian 330KV transmission grid
Table I Line data
S/N BUS NAME R (p. u)
X (p. u)
½ B (p. u) FROM TO
1 1 2 0.0111 0.942 1.178
2 1 9 0.0022 0.0246 0.308
3 4 5 0.0095 0.081 1.01
4 4 27 0.0029 0.0246 0
5 4 6 0.007 0.0599 0.748
6 6 3 0.0082 0.0899 0.874
7 7 6 0.0034 0.0292 0.364
8 7 6 0.0034 0.0292 0.364
9 9 8 0.003 0.0022 0.033
10 9 8 0.003 0.0022 0.033
11 9 7 0.0087 0.0742 0.927
12 9 7 0.0087 0.0742 0.927
13 9 1 0.0022 0.0246 0.308
14 10 7 0.0038 0.0284 0.189
15 10 7 0.0038 0.0284 0.189
16 11 9 0.0056 0.477 0.597
17 11 9 0.0056 0.477 0.597
18 11 9 0.0056 0.477 0.597
19 11 16 0.0089 0.0763 0.954
20 11 15 0.0049 0.0341 0.521
21 14 11 0.0041 0.0349 0.437
22 14 15 0.0049 0.0416 0.521
23 15 22 0.0022 0.0172 0.257
24 15 22 0.0022 0.0172 0.257
25 15 16 0.0101 0.0799 1.162
26 15 16 0.0101 0.0799 1.162
27 16 25 0.0022 0.019 0.239
28 16 12 0.007 0.056 0.745
29 16 12 0.007 0.056 0.745
30 16 21 0.0018 0.0139 0.208
31 16 21 0.0018 0.0139 0.208
32 16 21 0.0018 0.0139 0.208
33 16 17 0.0049 0.0416 0.521
34 17 13 0.0034 0.0292 0.035
5
35 17 18 0.0049 0.0419 0.524
36 18 26 0.009 0.007 0.104
38 19 15 0.0006 0.0051 0.065
39 19 15 0.0006 0.0051 0.065
40 20 15 0.0016 0.0118 0.093
41 21 24 0.0023 0.019 0.239
42 22 23 0.0022 0.0172 0.257
43 22 23 0.0022 0.0172 0.257
44 25 24 0.0011 0.0088 0.171
45 27 18 0.0071 0.0532 0.380
46 27 28 0.0079 0.0591 0.390
Source : [ 13, 14]
Table II Bus Data
BUS NO
GENERATOR LOAD V (p.u)
ANGLE (deg)
REMARKS P
(MW)
Q (MVar)
Qmin Qmax P (MW) Q
(MVar)
1 624.7 0.00 -1010 1010 7.00 5.20 1.05 0 Gen bus
2 0.00 0.00 0.00 0.00 114.5 85.9 1.00 0 Load bus
3 0.00 0.00 0.00 0.00 220.6 142.9 1.0 0 Load bus
4 0.00 0.00 0.00 0.00 70.30 52.70 1.0 0 Load bus
5 0.00 0.00 0.00 0.00 130.6 97.90 1.0 0 Load bus
6 0.00 0.00 0.00 0.00 193.0 144.70 1.0 0 Load bus
7 388.9 0.00 -1010 1010 70.30 36.10 1.05 0 Gen bus
8 495.0 0.00 -1050 1050 0.00 0.00 1.05 0 Gen bus
9 0.00 0.00 0.00 0.00 11.00 8.200 1.00 0 Load bus
10 0.00 0.00 0.00 0.00 110.0 89.00 1.00 0 Load bus
11 0.00 0.00 0.00 0.00 201.20 150.90 1.00 0 Load bus
12 0.00 0.00 0.00 0.00 13.80 10.30 1.00 0 Load bus
13 0.00 0.00 0.00 0.00 177.90 133.40 1.00 0 Load bus
14 0.00 0.00 0.00 0.00 275.80 206.8 1.00 0 Load bus
15 0.00 0.00 0.00 0.00 633.20 474.90 1.00 0 Load bus
16 0.00 0.00 0.00 0.00 383.30 287.50 1.00 0 Load bus
17 0.00 0.00 0.00 0.00 184.60 138.40 1.0 0 Load bus
18 0.00 0.00 0.00 0.00 427.00 320.20 1.00 0 Load bus
19 0.00 0.00 0.00 0.00 244.70 258.50 1.00 0 Load bus
20 750.0 0.00 -1010 1010 0.00 0.00 1.05 0 Gen bus
21 190.3 0.00 -1010 1010 20.60 15.40 1.05 0 Gen bus
22 0.00 0.00 -1006 1006 68.90 51.70 1.05 0 Slack bus
23 0.00 0.00 0.00 0.00 274.40 205.80 1.00 0 Load bus
24 0.00 0.00 0.00 0.00 96.50 72.40 1.00 0 Load bus
25 670.0 0.00 -1030 1000 0.00 0.00 1.05 0 Gen bus
26 431.0 0.00 -1000 1000 52.50 39.40 1.05 0 Gen bus
27 0.00 0.00 0.00 0.00 290.1 145.00 1.00 0 Load bus
28 750.0 0.00 -1010 1010 0.00 0.00 1.05 0 Gen bus
Source: [13, 14, 15]
V. RESULTS
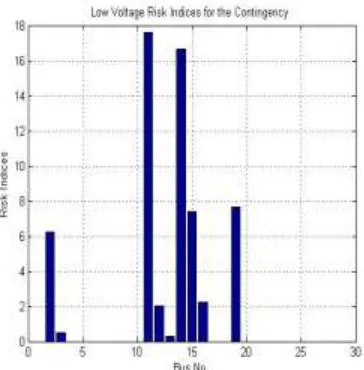
The results obtained after simulating a contingency on line 16- 17and assuming a standard deviation of 2% are recorded in table III. Table III shows the stressed buses (buses with voltages below 1.0 p.u.) and the low voltage risk indices of the stress buses. Figure 3 graphically represents the low voltage risk indices
.
Table III Stressed buses and their risk indices
B US NO
VOLTAGE MAGNITUDE (PU)
RISK INDICES
2 0.689 6.2142
3 0.975 0.5017
11 0.120 17.6012
12 0.900 2.0045
13 0.986 0.2859
14 0.168 16.6396
15 0.630 7.4041
16 0.888 2.2353
19 0.618 7.6478
Figure 3: Graphical representation of the low voltage risk indices.
A.
Discussion of ResultThe risk indices in table III reflect the quantitative measurement of security level hence, they facilitate decisions making in determining operating limits associated with static voltage problems. Ultimately, this involves selecting a risk level to delineate between acceptable and unacceptable operating regions. The threshold value selection can be based on experience, existing criteria, and/or optimization of cost. Furthermore, a decisions making algorithm can be used to select the threshold risk index level from these criteria and it is advantageous to the conservatism of the operational decision makers (ODM); the system operators, engineers and/or their managers.
The risk index is a leading indicator of security level in that the assessment provides a uniform security measurement for the near future operating condition based on the current information.
The results shown in table III enable the system operator/engineers to quickly identify and investigate high-risk scenarios. In addition, risk index gives useful information of insecurity beyond the threshold value and can be used in pricing power system security.
VI. CONCLUSION
The competitive nature of electricity market has driven power systems into restructuring of their operating patterns and as a result, more stress conditions are encountered frequently. Therefore, there is the need for a quantitative measure that accurately reflects security level and can be used in control room economy decisions making. We believe that the use of the risk
indices will improve power system security level and economy decisions making.
REFERENCES
[1] C. J. Nnonyelu, B. O. Anyaka and T. C. Madueme, Power System Contingency Analysis: A Study of Nigeria’s 330KV Transmission Grid, Proceedings of the 4th Electrical Engineering
National Conference, University of Nigeria, Nsukka, pp. 250-258, 21-23 July 2013.
[2] J. McCalley, S. Asgarpoor, L. Bertling, R. Billinton, H. Chao, J. Chen, J. Endrenyi, R. Fletcher, A. Ford, C. Grigg, G. Hamoud, D. Logan, A. P. Meliopoulos, M. Ni, N. Rau, L. Salvaderi, M.Schilling, Y. Schlumberger, A. Schneider and C. Singh, Probabilistic Security Assessment for Power System Operations, A task force Organized by the IEEE PES Reliability, Risk and Probability Applications Subcommittee, 2001.
[3] U. De-Martinis and C. Battiselli, Deterministic and Risk Based Approaches to Power Systems Security Assessment, International Congresses on Electrical Engineering, Catania, pp. 1-8, 27-29 September 2009.
[4] D. S. Kirschen and D. Jayaweera, Comparison of Risk and Deterministic Security Assessments, IET Generation, Transmission, Distribution, Vol. 1, Issue 4, pp. 527-533, 2007. [5] B. Zhou, P. Zhang, J. Chen, X. Jin, K. Hou, M. Niu, Z. Xu and
Y. Lei, Application of Risk-based Flexibility Assessment Methods to Evaluate System Expansion Plans, Energy and Power Engineering, Vol.5, No. 4B, pp. 1022 – 1025, July 2013. [6] J. D. McCalley, V. Vittal and N. Abi-Samra, An Overview of
Risk based Security Assessment, Proceeding of the IEEE Power Engineering Society Summer Meeting, Vol. 1, pp. 173 – 178, July 1999.
[7] M. Ni, J. D. McCalley, V. Vittal and T. Tayyib, Online Risk – Based Security Assessment, IEEE Transactions on Power Systems, Vol. 18, No. 1 pp. 258 – 265, February 2003. [8] X. Xu, F. Dong and M. J. S. Edmonds, Risk Assessment of
Power System with PSSTME. Power Transmission and
Distribution, Siemens, Issue 101.
[9] M. Marsadek, A. Mohamed, Z. and M. Norpiah, Risk Assessment of Line Overload in a Practical Power System Considering Different Types of Security Functions, Proceedings of the 9th WSEAS International Conference on Applications of
Electrical Engineering, pp. 74-79, 2010.
[10] T. Govindaraj and S. Dinesh, Simulation Modeling on Risk-Based Optimal Power Flow using Bio Inspired Algorithm, International Journal of Innovative Research in Electrical, Electronics, Instrumentation and Control Engineering, Vol. 2, Issue 1, pp. 881-885, January 2014.
[12] A. Dissanayaka, Risk Based Dynamic Security Assessment, The University of Manitoba Winnipeg, Manitoba, Canada, August 2010.
[13] R. A. Jokojeje, I. A. Adejumobi, A. O. Mustapha and O. I. Adebisi, Application of Static Synchronous Compensator (STATCOM) in Improving Power System Performance: A Case Study of the Nigerian 330KV Electricity Grid, Nigerian Journal of Technology (NIJOTECH), Vol. 34, No. 3, pp. 564 – 572, July 2015.
[14] U. C. Ogbuefi and T. C. Madueme, A Power Flow Analysis of the Nigerian 330KV Electric Power System, IOSR Journal of Electrical and Electronics Engineering (IOSR-JEEE), Vol. 10, Issue 1, pp. 46-57, February 2015.