DOI: 10.14738/abr73.2.6359.
Agu, G. A., Onwuka, O. O., & Aruomah, O. (2019). Impact Of Taxation On The Performance Of Small And Medium Enterprises In Aba, Abia State, Nigeria. Archives of Business Research, 7(SP), 1-15
Impact Of Taxation On The Performance Of Small And Medium
Enterprises In Aba, Abia State, Nigeria
Godswill Agu Agu
Department of Marketing, Abia State University, Nigeria
Onwka Okwara Onwuka
Department of Accounting, Abia State University, Nigeria
Obinwanne Aruomah
Department of Accounting, Abia State University, Nigeria
ABSTRACT
This work aims at assessing the effect of taxation on the performance of SMEs in Aba Abia State. A survey approach was adopted while the questionnaire was used as an instrument. A randomly selected 162 employees and owners of 40 SMEs were used for the study. Collected data were analyzed using the multiple regression analysis and one sample t-test. Results indicate that significant and positive relationship exist between taxation and the performance of SMEs and that tax assessment, tax collection and tax utilization significantly influence the performance of SMEs in Aba. It was recommended among others that the Nigerian tax system must seek to protect and promote the SMEs for them to contribute meaningfully to economic growth and that they should identify the agents responsible for illegal, multiple tax collections that seek to frustrate SMEs and deal with them accordingly.
Key Words: Taxation, Performance, SMEs.
INTRODUCTION
Given these global recognitions on the value of MSMEs in any economy, Nigeria inclusive, one wonders why SMEs in Nigeria struggle to survive and achieve these global goals. As rightly observed by Banji (2017), key building blocks for an enabling SME business environment in Nigeria include: basic science and technology knowledge base, legal and regulatory structure, basic physical and technological infrastructure and financial incentive structures. A key factor in the legal/regulatory and financial incentives structures is the tax system on the SMEs. Studies have shown that tax related issues have resulted in untimely exit of many SMEs in Nigeria. SMEDAN (2015) records that, 80% of SMEs in Nigeria die before their fifth year as a result of challenges faced by start-ups. Ochani and Gamade (2018) observed that multiple taxation and economic tax burdens have remained major challenges to SMEs. In fact when the tax system on Nigerian SMEs is weighed against the ancient Canons of equity, certainty, economy and convenience as enshrined in the Adam Smith’s “Wealth of Nations” of 1776, it will be obvious that the system does not adequately support the SMEs to play their role. The Delloitte Nigeria SMEs report (2018) discloses that the Nigerian government tends to focus more on the welfare of large corporations with foreign investments to the detriment of the SMEs which are wrongly perceived to have insignificant impact on the economy. OECD, (2017) captures that SMEs have a high propensity to transform an economy if a conducive environment is created for them to grow through appropriate regulation and tax policies. The Delloitte report (2018) states, “In Nigeria, SMEs are subjected to multiple taxes by the different tiers of government, each with its own rigorous process and significant compliance cost. Considering the size of their operations, the absence of harmonized tax regime increases the strain on cash flow and other limited resources of SMEs when compared to large corporations’’.
The plight of SMEs in the face of the unfriendly tax policies being experienced and the effect of the scenario on the economy make this study imperative. There is the need to find out how the tax system has affected the financial and non-financial perform indicators of these SMEs judging from perceptions of the key players in the firms. Unlike extent studies that used pure secondary data, this study is based on primary sources in order to ascertain the perceptions, feelings and views of the entrepreneurs, owners of the SMEs and their managers on the subject matter. Again, this study compares both financial and non-financial performance indicators of SMEs to ascertain the impact of taxation on them. This is much unlike previous studies that either focused on pure financial indicators or non-financial indicators.
The Problem
companies in periods of little or no profitability in the case of SMEs. In the same vein, a good number of SMEs are not able to adequately benefit from tax incentives due to the small size of their operations’’.
With a substantial fixed cost component to tax regulatory requirements and compliance costs (record keeping, filing and payment processes etc.) at national, regional and municipal levels, small businesses are at a disadvantage with respect to large enterprises. For young firms, which also tend to be small, high compliance costs can exacerbate the resource and cash-flow constraints often experienced in the early stages of business development, and may act as a deterrent to formalization. In some cases, tax compliance costs for small firms may even exceed their tax cash payments (OECD 2015c; Eichfelder and Vaillancourt, 2014). Furthermore, certain aspects of business taxation, including asymmetric treatment of profits and losses, the distribution of taxation between capital and labour income and the design of R&D tax credits and incentives, can unintentionally disadvantage some young and small firms (OECD, 2015c).
Given this situation one doubts the ability of Nigerian tax system on SMEs to encourage greater investments, transition from informal to formal, and impact significantly and positively on employment generation, sales revenue, innovativeness and profitability of the firms.
Study Objectives
This study aims at assessing the impact of taxation on the performance of SMEs in Aba, Abia State. The specific objectives are:
1. To know whether significant and positive relationship exists between taxation and SMEs performance.
2. To know whether the tax assessment system in Aba affects the performance of SMEs significantly.
3. To determine whether the tax collection system in Aba significantly affects the performance of SMEs.
4. To ascertain whether the tax utilization system in Aba significantly influence the performance of SMEs.
Scope of the Study
The geographical setting of this research study is Abia State Nigeria with particular attention on SMEs operating in Aba. This study is domiciled in the areas of entrepreneurship and corporate performance. The units of analysis in the study are owners, managers, marketers and accountants of select firms from the cosmetic, paint, shoes, chemical and clothing segments. Forty firms were chosen for the study. Abia State and indeed Aba is thickly populated with MSMEs in the various sectors of the Nigerian economy.
Concept of Taxation
Taxation is the primary source of governmental revenue. It is the act of laying a tax, i.e., the process by which a local, state and central government, through its law-making body, raises revenue to defray the necessary expenses of the government. According to Anyanwu (1997), taxation can be defined as the compulsory transfer or payment (or occasionally of goods and services) from private individuals or groups to the government. Agyei (1983) as cited in Ekine (2007), defines it as the transfer of resources from the private sector to the public sector in order to accomplish some of a nation’s economic and social goals.
2009; Ola (2001) cited in Ogbonna and Ebimobowei,2012). Jhingan (2002) and Anyanwu (1993) pointed out several objectives of taxation, which include to:
i. Put a curb on consumption and thus transfer resources from consumption to investment
ii. Raise revenue for government iii. Reduces economic inequalities and iv. Control income and employment.
Challenges of Tax System in Nigeria
The Nigeria tax system is beset by a myriad of challenges, some of which are highlighted below (FRN i1997, 2002; Ariyo 1997; Ola 2001; Odusola 2002, 2003; study group on tax reform 2003): non availability of tax statistics; inability to prioritize tax effort; poor tax administration; multiplicity of tax; regulatory challenges; structural problems in the economy; corruption; complexity of tax laws:
The Concept of Small and Medium Scale Enterprises
The Nigeria Bank for Commerce and Industry (as cited in Jimah, 2011) defined a small scale enterprise as one whose capital does not exceed N750,000. The above definition plays emphasis on the capital requirement in the formation of the business. Though capital is not the only consideration in determining whether a business venture is a SMEs or not.
Agu (2001) defined SMEs as a business which is owned, led by one or a few persons, with direct owner(s) influence in decision making, and having a relatively small share of the market and relatively low capital requirement. Osazee and Anao (as cited in Inegbenebor, 2006) defined a small scale business is any business undertaken, owned, managed and controlled by not more than two entrepreneurs, has no more than twenty employees, has no definite organizational structure (that is, all employees report to the owners) and has a relatively small share of its market. In a similar vein, Inegbenebor (2006) opined that the current industrial policy of Nigeria, Small and Medium Scale Enterprises (SMEs) are now defined on the basis of employment. That is:
i. Micro/cottage industries 1 and 10 workers ii. Small – Scale Industries 11 and 100 workers iii. Medium Scale industries 101 and 300 workers iv. Large scale industries 301 and above
THEORETICAL FRAMEWORK
Empirical Framework
The study of Bosco (2011) aimed at assessing the performance of business enterprises in Ntungamo Town Council, finding out if tax payers are aware of all their tax obligations, policies and problems affecting them as well as their businesses. The findings revealed the problems faced by the tax payers as regards mode of assessment, collection and tax collectors, inefficiency by tax collectors, loss of equipment, loss of sales and loss of stock as a result of taxes. Adebisi and Gbegi’s (2013) examined the effect of multiple taxation on SMEs survival. The study involved a survey research design with a population of 91. The researchers derived their sample size to arrive at 74 and a self administered questionnaire was used to collect data. These data were quantitatively analyzed with simple percentages and tested the research hypothesis with ANOVA. Findings revealed that multiple taxation has negative effect on SMEs’ survival and the relationship between SMEs’ size and its ability to pay taxes is significant. We therefore recommends that government should come up with a uniform tax policies that will favour the development of SMEs in Nigeria and government should put into consideration the size of SMEs when setting tax policies.
The study of Abata (2014) focused on the impact of tax revenue on Nigeria economy. Descriptive survey design was adopted and simple random sampling technique was used in the selection of the sample size. The findings show that tax revenue significantly impact on Federal Government Budget implementation in Nigeria, Tax administrative system significantly affected the revenue generated in Nigeria, Tax evasion significantly affected government revenue in Nigeria, and Lack of training on the part of tax officers significantly affected the generation of government revenue in Nigeria.
Conceptual Framework:
Based on these, we hypothesized thus:
H01: There is no significant and positive relationship between taxation and SMEs performance in Aba.
RESEARCH METHODOLOGY
In this study, the survey research design was adopted. The study population is made up of SMEs in Aba Abia State. Records from the Aba Chambers of Commerce show that a good number of the MSMEs are not duly registered members. Thus, the exact population of the manufacturing firms was unknown. However, our interest is on 40 manufacturing firms from
Tax Assessment
Tax Collection
Tax Utilization
Taxation
SMEs Performance
the chemicals, paint, shoes clothing and cosmetic segments. Hence, the sample size was drawn from the management, marketing and accounting units of the firms. Respondents were chosen from each of the 40 firms. Based on convenience reasons, the firms were selected. The researchers adopted the non-probability sampling technique, where units of analysis were selected based on convenience and availability. Copies of the questionnaire were issued through the company secretaries/receptionist to the managers (owners), marketing executives and accountants of the firms, and were retrieved after three working days. Majority of the firms are allocated within the industrial clusters of Osisioma and Ariaria.
Topman formula as cited by Ogbuji (2013) was applied to arrive at a sample size of 162. Thus:
Table 1: Sectoral Distribution of Sample Size
SNo Sector Number Sample Size
1. Chemicals 6 4*6= 24
2. Paint 4 4*4= 16
3. Shoes 22 4*22= 88
4. Clothing 4 4*4= 16
5 Cosmetics 4 4*4= 16
Total 40 160
Source: Researcher’s Computation, 2018.
Reliability and Validity of Instrument
The likert scale on dependent and independent variables are subjected to Cronbach Alpha test to ascertain the reliability of the instrument. This was done using the responses of the 10 respondents who were issued the questionnaire on a pilot test. The table below shows the result of the Cronbach Alpha test and the factor loading.
Table 2: Reliability and Validity of Instrument
S/No Variable No. of Items Cronbach Alpha Factor Loading
1 Tax assessment 3 0.732 0.711
2. Tax collection 3 0.721 0.685
3. Tax utilization 3 0.835 0.622
4. Firm performance 5 0.751 0.756
Source: SPSS Output, 2018.
The result shows that all the variables met the minimum threshold for acceptance since they are up to 70% (0.70). Based on the factor loadings, the instrument was se.
The equation for linear regression takes the form: Y = a + bX+ e
Where:a = the Y intercept, b = the regression coefficient for the independent variable X. Y = the dependent/criterion variable (firm performance)
X = the independent/predictor variables (taxation) that influence the dependent variable. The direct effect research model for this study is of the form:
FP = f(T).
Where:
Model Specifications
The necessary models for our regression analysis are implicitly specified as followed:
Firm performance = f(TA+ TC+ TU +e) Where:
TA= tax assessment TC= tax collection TU= tax utilization
The composition, direction and relative strength of each of the three independent variables on the single dependent variable (performance) would be determined.
Decision Rules:
In order to validate (accept) or nullify (reject) any stated hypothesis tested with the multiple regression, major attention was paid to the P- values of the tested constructs. Therefore, we rejected the null hypotheses where the SPSS p-values are less than alpha (0.05) and the alternative hypotheses accepted.
Also, the t-test was used ascertain the present tax system in Aba, in the opinion of the respondents, influence their firms’ performance. Where the calculated is more than t-tabulated value, the null hypotheses will be rejected otherwise it will be accepted.
Table 3: Distribution and Retrieval of Instrument Number of
Copies Distributed
Number of Copies Retrieved
Number of
Copies Lost copies found Number of useful
Number of discarded
copies
Percentage of Retrieved and Used Copied
162 153 (94%) 9 (7%) 148 5 91.00
Source: Field survey, 2018.
Table 3 shows that out of the 162 copies of the questionnaire distributed, 153 (94%) copies were retrieved while 9 (7%) copies were lost. Also, of the 153 copies retrieved, 5 copies were incompletely filled and therefore were discarded. However, 148 (91%) copies were completely filled and found useful for analyses. Thus, further analyses in this study were based on the 148 copies retrieved and found useful.
Table 4: Designation of Respondents
Option Frequency Percentage
Directors/Owners 40 27.00
Marketing Managers 70 47.00
Accountants 38 26.00
Total 148 100
Figure 4.1: Pie chart showing the designation of the respondents
Analysis of Demographic Variables of Respondents
In this section, all the demographic questions in the questionnaire were analyzed. This section covers responses to questions 1, 2, 3, 4, and 5.
Table 5: Demographics of the Respondents
Option Frequency Percentage
Gender: Male Female 80 68 54.00 46.00 Age Bracket:
18 – 25 26 – 35 36 – 45 46 years and above
29 34 49 36 20.00 23.00 40.00 24.00 Educational Qualification FSLC O’Level/ND HND/BSC Masters and above
Others 19 47 47 30 05 13.00 32.00 32.00 20.00 03.00 Marital Status Married Single Others 75 61 12 51.00 41.00 08.00 Length of stay in company:
Less than 5 years 5 – 10 years 11 – 15 years 16 years and above
38 50 40 20 26.00 34.00 27.00 13.00 Source: Field Survey, 2018.
This information is further presented in the following figures:
Figure 4.2: Pie chart showing gender of the respondents
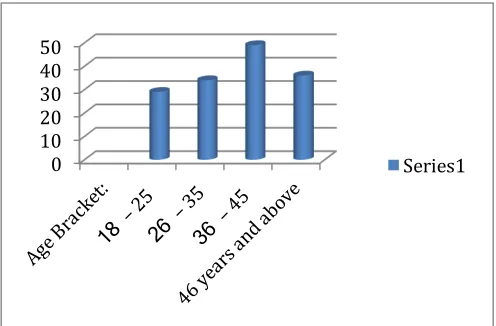
Figure 4.3: Column graph showing age of the respondents
Figure 4.4: Line graph showing educational qualification of the respondents Male
54%
Female 46%
Gender of
Respondents
0 10 20 30 40 50
Series1
0 5 10 15 20 25 30 35 40 45 50
Figure 4.5: Bar chart showing marital status of the respondents
Figure 4.6: Pie chart showing respondents’ length of stay in the companies
Table 5 and figure 4.2 show that 80 (54%) respondents and 68(46%) respondents were males and females respectively. Also, Figure 4.3 disclosed that 29(20%) respondents, 34(23%) respondents, 49(33%) respondents and 36 (24%) respondents were in the age brackets of 18-25, 26-35, 36-45 and 46 and above respectively. Again, item three in the table and figure 4.4 revealed that 56(45%) respondents, 47(32%) respondents, 30(20%) respondents and 5 (3%) respondents had, O’Level/ND, B.Sc./HND, Masters and above and other educational qualifications respectively. Also, figure 4.5 shows that 75 (51%) respondents, 61(41%) respondents and 12 (8%) respondents were married, single and others respectively. Moreover, it was revealed through the last item in the table and figure 4.6 that 38 (26%) respondents, 50 (34%) respondents and 40 (27%) respondents and 20 (13%) respondents had been in their respective companies for a period of less than 5 years, 6 to 10 years, 11 to 15 years and 16 years and above, respectively.
Analysis of Major (Research) Variables
In this section, responses to the main questions were analyzed.
Table 4.6: Responses to whether the companies pay taxes
Option Frequency Percentage
Yes 148 100.00
No 0 0.00
Not sure 0 0.00
Source: Field survey, 2018
Table 6 shows that all the respondents, representing 100%, identified that their companies pay taxes.
0 50 100
Marital Status Married Single Others
Series1
Less than 5 years
26%
5 – 10 years
34% 11 – 15
years 27% 16 years and above
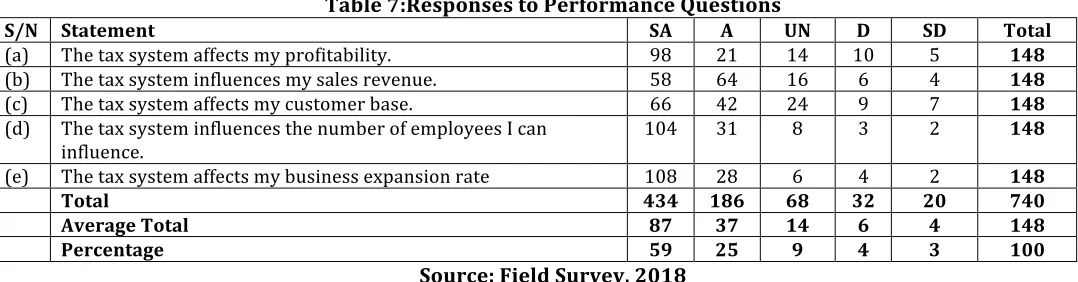
Table 7:Responses to Performance Questions
S/N Statement SA A UN D SD Total
(a) The tax system affects my profitability. 98 21 14 10 5 148 (b) The tax system influences my sales revenue. 58 64 16 6 4 148 (c) The tax system affects my customer base. 66 42 24 9 7 148 (d) The tax system influences the number of employees I can
influence. 104 31 8 3 2 148
(e) The tax system affects my business expansion rate 108 28 6 4 2 148
Total 434 186 68 32 20 740
Average Total 87 37 14 6 4 148
Percentage 59 25 9 4 3 100
Source: Field Survey, 2018
The information is further presented in figure 4.7 as shown below:
Figure 4.7: Line graph showing responses to performance questions
Table 7 and figure 4.7 show that an average of 87 (59%) respondents, 37 (25%) respondents, 14 (9%) respondents, 6 (4%) respondents and 4 (3%) respondent strongly agreed, agreed, had not decided, disagreed and strongly disagreed respectively on statements about the effect of taxation on business performance.
Table 8: Responses to Tax Assessment Questions
S/N Statement SA A UN D SD Total
(a) The method of tax system on my firm is satisfactory. 18 32 20 68 10 148 (b) The tax assessment in place is objective. 8 37 13 12 78 148 (c) The tax assessment is considerate. 14 27 16 82 9 148
Total 40 96 49 162 97 444
Average Total 13 32 16 54 32 148
Percentage 09 22 11 36 22 100
Source: Field Survey, 2018 0
20 40 60 80 100
SA A UN D SD
The information is further shown in figure 4.8 thus:
Figure 4.8: Pie chart showing responses to tax assessment questions
Information displayed in table 4.5 and figure 4.8 show that on the average, 13 (9%) respondents, 32 (22%) respondents, 16 (11%) respondents, 54 (36%) respondents and 32 (22%) respondent strongly agreed, agreed, had not decided, disagreed and strongly disagreed respectively on statements about tax assessment.
Table 9: Responses to Tax Collection Questions
S/N Statement SA A UN D SD Total
(a) I am satisfied with the way taxes are collected from my company. 24 47 13 7 57 148 (b) The method of tax collection is objective. 31 33 10 8 66 148 (c) The method of tax collection is friendly 11 40 31 16 50 148
Total 66 120 54 31 173 444
Average Total 22 40 18 10 58 148
Percentage 15 27 12 07 38 100
Source: Field Survey, 2018
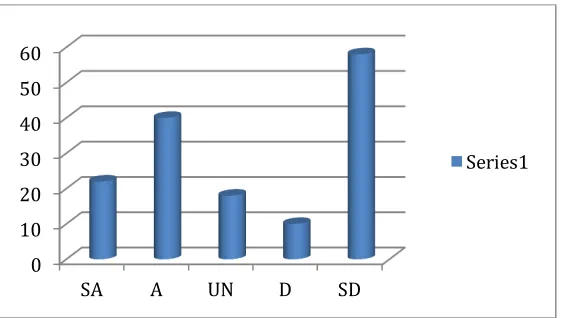
Figure 4.9 further displays the above information using a column graph.
Figure 4.9: Column graph showing responses to tax collection questions
Table 9 and shows that on the average, 22 (15%) respondents, 40 (27%) respondents, 18 (12%) respondents, 10 (7) respondents and 58 (38%) respondent strongly agreed, agreed, had not decided, disagreed and strongly disagreed respectively on statements about tax collection.
SA
9%
A
22%
UN
11%
D
36%
SD
22%
Tax Assessment
0 10 20 30 40 50 60
SA A UN D SD
Table 10: Responses to Tax utilization Questions
S/N Statement SA A UN D SD Total
(a) I am satisfied with the way taxes collected are utilized 11 47 32 16 42 148 (b) Taxes are used to provide needed infrastructure for the
growth of our firms. 10 25 29 44 40 148
(c) Taxes are efficiently used by the government. 21 32 21 34 40 148
Total 42 104 82 94 122 444
Average Total 14 35 27 31 41 148
Percentage 09 24 18 21 28 100
Source: Field Survey, 2018
The information above is further shown in figure 4.10 thus:
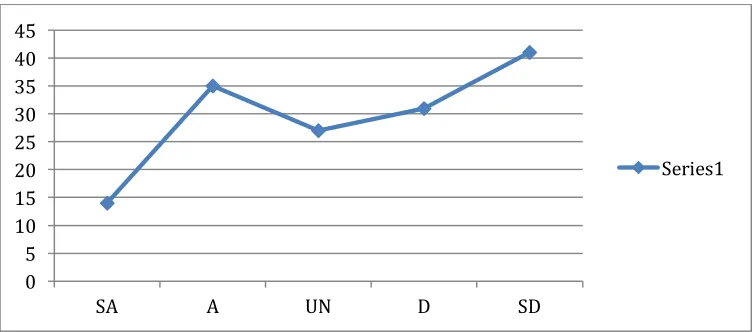
Figure 4.10: Line graph showing responses to tax utilization questions
Table 10 and figure 4.10 show that on the average, 14 (9%) respondents, 35 (24%) respondents, 27 (18%) respondents, 31 (21) respondents and 41 (28%) respondent strongly agreed, agreed, had not decided, disagreed and strongly disagreed respectively on statements about tax utilization.
Result:
Model Summaryb
Model R R Square Adjusted R Square
Std. Error of the Estimate
Durbin-Watson
1 .745a .554 .545 .66941 1.874
a. Predictors: (Constant), Tax Utilization, Tax Collection, Tax Assessment b. Dependent Variable: Performance of SMEs
ANOVAa
Model Sum of Squares df Mean Square F Sig.
1
Regression 80.249 3 26.750 59.695 .000b
Residual 64.528 144 .448
Total 144.777 147
a. Dependent Variable: Performance of SMEs
b. Predictors: (Constant), Tax Utilization, Tax Collection, Tax Assessment 0
5 10 15 20 25 30 35 40 45
SA A UN D SD
Coefficientsa
Model Unstandardized Coefficients Standardized
Coefficients T Sig. B Std. Error Beta
1
(Constant) 2.964 .126 23.558 .000
Tax Assessment .213 .135 .333 2.158 .020
Tax Collection .249 .107 .391 2.330 .021
Tax Utilization .359 .168 .490 2.133 .035
a. Dependent Variable: Performance of SMEs
Interpretation: The R value (0.745) shows that a strong, positive and significant relationship exists between taxation and online SMEs performance. The adjusted R2 value (0.545) reveals that 54.5% variation in performance is predicted by taxation. Also, the F value (59.70) and p value (0.000) which are greater than f critical value at 0.05 level of significance (6.39) and less than alpha (0.05) respectively are positive signs of relationship. The coefficients table shows that tax assessment (t=2.158; p=0.020) and tax collection (t=2.330; p= 0.021) and tax utilization (t= 2.133 ; p= 0.035 ) significant predictors of performance. This is because their p-values are less than alpha (0.05) and their t-values greater than t-critical.
Decision: Based on the above outcomes, we therefore reject the null hypothesis and accept the alternate which implies that there is a significant and positive relationship between taxation and SMEs performance..
SUMMARY OF FINDINGS
Based on the analyzed data, the following key findings were made in this study;
• It was discovered that there is a positive and significant relationship between taxation and the performance of SMEs.
• It was equally discovered through the study that tax assessment significantly affects the performance of SMEs.
• Also, it was discovered through the study that tax collection system significantly affects the performance of SMEs.
• And that that tax utilization system significantly affects the performance of SMEs.
CONCLUSION
Based on the findings of the study, we can conclude that taxation is a key factor in the financial life of any SME. For the SMEs to perform satisfactorily, the tax system in place must promote the survival of such firms. Thus, the tax collection, assessment and utilization must be SMEs oriented as this will in turn impact on the growth of the economy.
RECOMMENDATIONS
The following are some of the recommendations from this study:
• Nigerian tax system must seek to protect and promote the SMEs for them to contribute meaningfully to economic growth.
• It is also advisable to identify the agents responsible for illegal, multiple tax collections that seek to frustrate SMEs and deal with them accordingly.
References
Agu, G.A (2015) Customer-complaint Behaviour in the service industry; A study of the customers of the organised Road Transport Firms In Imo State. A ph.D Thesis, Abia State University, Nigeria.
Aham Anyanwu (1998) Marketing in action. Owerri; Klet-ken publisher.
Aham Anyanwu (2003) Promotional strategy- A schematic Approach. Owerri; Avan Global publications. Aham Anyanwu (2013) Marketing Management and Strategy. Owerri: Avan Global Publications. Aham Anyanwu (2000) Dimension of Marketing. Owerri; Avan Global Publications.
Anyanwuocha, R.A.I (2005) Fundamentals of Economics for Senior Secondary Schools. Abuja; Africa First Publishers Ltd.
Avery, J. (2009) Student-run advertising agency. A show case for student work. Retrieved 20th April 2012.
Awa I. and Kalu I. N. (2016) Marketing Communications: An integrated Approach. Nationwide Printers and Publications.
Chinedu N. O (2013) Marketing Research Port-Harcourt: African Entrepreneurship and Leadership Initiative (AELI).
Doughudje C. (1993) Creativity in Advertising: Journal of Marketing Management, Enugu Nigeria, University of Nigeria.
Ezejelue A.C, Ogwo E.O, and Nkamnebe A.D (2017) Basic Principles in Managing Research Projects.Aba: Afritowers Ltd.
Gotoh N and Wada S. (2005) The importance of peroxide value in accessing good quality and food, safety journal of the American oil chemists society 473-474 doi 10.1007151176806-1229.
Inyanga J (1998) Nigerian Marketing System. The marketing mix Approach. Global press limited.
Kaiser, u. and Song, M (2009) “ Do media consumers really dislikeadvertising. An empirical assessment of the role of advertising in electronic media marketer. International journal of Industrial Organisation22(2).
Kotler P. Armstrong G Saunders J and Wong U (2006) Principles of Marketing, New Jersey: Prentice Hall Inc. Nwaizigbo, I.C(2004) Principles of Marketing. Enugu: New generation books.
Okpara, G.S (2012) Contemporary Marketing: Topical and Tropicalised. Owerri: Avan Global Publications. Okpara, G.S, Anyanwu, A and Inyanga J.I (1999) Marketing Communication principles and practices; Portharcourt Educational Books and investment.
Okpara, G.S and Agu G.A (2016) Intermediate Marketing; Bridging the gap between foundational and special marketing thoughts. Owerri: Avan Global Publications.
Onah, J.O and Thomas, M.J (2004) Marketing Management: Strategies and cases. Enugu. Institute for Development Studies.
Stephen, D (2010) Measuring Situational triggers of television advertising for avoiding ads by fast-forwarding through commercials. Retrieved 21st April 2012.
Wikipedia (2018) Frequency of television advertising http://em.M-wikipedia.org/wiki/effective frequency. Retrieved on 12 July 2018.