Promoting Educational Research Through Effective
Instrument Development
Matthew Cyril
Department of Science and Vocational Education
Usmanu Danfodiyo University, Sokoto Nigeria GSM: 08032210388 [email protected]
Abstract: The paper examined various processes of instrument development and projected two models: Test Development Model (TDM) I and TDM II for effective instrument development in educational research. Methods of establishing validity (Face, Content and Construct) and reliability (Test Re-test, Split Half, Cronbach Alfa and Coefficient of Concordance) of research instruments were equally highlighted. Two test theories: Classical Test Theory (CTT) and Item Response Theory (IRT) were identified as significant theories associated with test development. The two statistics which form the cornerstone of classical test theory (item difficulty and item discrimination) for establishing item facility indexes (Item Analysis) were also examined. Finally, the processes provided by the two models for instrument development projected in this paper as well as the two test theories which provide the logic and mathematical framework that underlie standard practices in test construction and use were recommended for the development of test instrument in educational research. Also, is recommended that only items found within the acceptable difficulty index and discrimination index should be retained to form final part of the developed instrument.
Key words: Educational Research, Instrument Development, Item Analysis, Test Development Models, Test theories.
Introduction
Every teacher training program in education, particularly at higher level of learning has among other requirements an embodiment of research. Research has been described as a systematic and objective search for new knowledge of the subject of study and or application of knowledge to the solution of a problem which may lead to the development of generalizations, principles or theories, resulting in prediction and possibly ultimate control of events. Ali (2006) defined research as the use of any scientific approach in carrying out any investigation. Nzeribe and Ilogu (1996) defined research as any organized inquiry carried out to provide information for the solution of a problem. Research, can be seen as the most important tool for advancing knowledge, for promoting progress and for enabling man to relate more effectively to his environment in other to accomplish a purpose and to resolve his conflicts. However, the focus of this paper is educational research. Educational research addresses educational problems. It is the formal, systematic application of scientific method to the study of educational phenomena. Nworgu (2015) defined educational research as a systematic approach which involves the application of the scientific method in finding solutions to educational problems. Educational research is a significant, systematic and scientific investigational activities directed towards the collection, analysis and interpretation of data for use in the development of an organized body of scientific knowledge about teaching and learning events which educators are concerned (Ali, 2006). If an individual, therefore identifies a problem, sets a goal for the research, thinks of solution by forming hypotheses, collects facts and organizes them, etc, he is said to be involved in an educational research. In educational research, students are involved in various activities that would lead them to solution to problems earlier identified. Some of these activities are captured under the content and design of an educational research, which include: conceptual and theoretical frameworks, review of empirical studies, research designs, sampling, validity and reliability of instruments, data collection and analysis etc. Data
obtained for the purpose of educational research are collected with the help of research instruments. These instruments are either: adopted, adapted or developed by the researcher. Adopted instruments are those instruments already developed by other researchers and are employed for use in current research work undertaken without any modification or alteration made on any item of the instrument. Adapted instrument on the other hand, are those already developed instruments that another researcher modifies to suit current study. In some other studies in which the researcher is interested in students’ academic achievement or performance test, a researcher may be interested in developing a valid and reliable instrument for the collection of information within the content of the study. However, in some of this type of researcher’s self designed test instrument, item analysis, factorial validation and/or test blue-print are seldom carried out, and where table of specification is constructed, percentage weights of content areas are arbitrary assigned without following the procedures for test development.
Procedure for test development
of these models can be followed depending on the type of
test (Achievement test, performance test, skills acquisition test, etc) to be developed, nature of problem to be investigated as well as researcher’s interest.
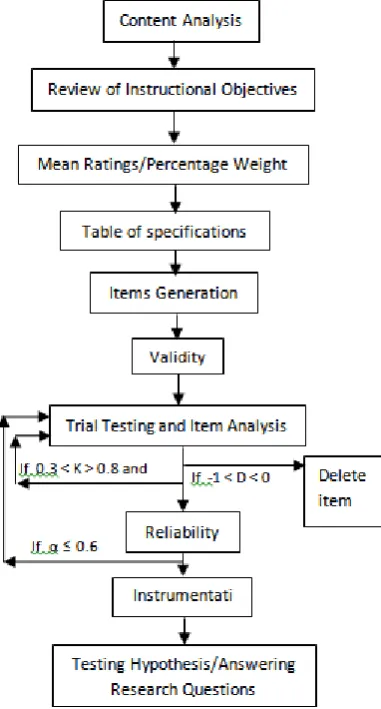
Figure 1: Test Development Model I Source: Cyril (2018)
Content Analysis
Content analysis provides a summary of the intentions of the curriculum expressed in content terms (Izard, 1997). Content analysis enables a researcher to be acquainted at the very beginning with the content area to be covered by the scope of the study. According to Nworgu (2015) content analysis means that the test developer should look at the relevant subject content on which the test is to be based and find out what the content is all about. The choice of content areas to be covered by the study, are in most cases subjective. This is because such choices depend largely on the researcher’s interest. Until this is adequately defined at the very start, the study may face series of complications in the long run.
Review of Instructional Objectives
The second step in the development of a test is the review of instructional objectives. Instructional objectives are those behavioural changes, which a teacher expects to notice in his students after they have been exposed to a particular topic (Anene & Ndubuisi, 2003). However, in uniform content, pupils performance is not a function of taxonomy level as stated by Blumberg (1981) cited by Nworgu (2015).
Figure 2: Test Development Model (TDM) II Source: (Cyril 2018)
Mean Ratings and Percentage Weights
In determining the mean ratings and percentage weights, the researcher first identify the content areas of a given curriculum of interest, judges are then selected by the researcher to consider the activities and materials required in each content area of the curriculum as determinant of the percentage weights to be assigned to each content area. For instance, let us consider percentage weights assigned to different content areas in Senior Secondary School II (SSS 2) Physics curriculum by seven judges including the researcher, for 30 essay questions as in table 1. Where: A represents the researcher and B, C, D, E four secondary school physics teachers, F and G two university
Key CM – Correlation Matrix
lecturers (experts in science education as well as
measurement and evaluation).
Table 1: Mean (x) Ratings and percentage weights assigned to different content areas of SSS 2 Physics
curriculum by 7 “Judges”.
Content area
Judges’ weights
S S2 Mean (x)
% weight
Item A B C D E F G
Motion 2 2 3 2 4 3 3 19 361 2.71 24.0 7 Optics 3 4 2 3 3 2 4 21 441 3.0 26.6 8 Waves 4 4 3 3 2 4 2 22 484 3.14 27.8 8 Mech. 2 2 3 3 2 2 3 17 289 2.43 21.5 7
Total 1575 11.28 100 30
From the table, each content area (Motion, Optics, Waves and Mechanics) will have an average percentage weight of 24%, 27%, 28% and 22% respectively. And a corresponding number of items required per content area of: 7, 8, 8 and 7 in that order.
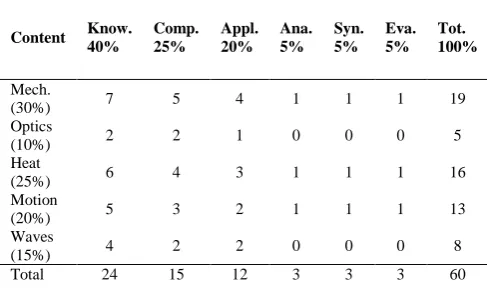
Test Blueprint (Table of specification)
According to Izard (1997), a test blueprint is a specification of what the test should cover rather than a description of what the curriculum covers. Anene and Ndubuisi (2015) described test blue print as a means of ensuring content validity. The use of table of specification for constructing an instrument according to Ali (2006) will ensure a fair and comprehensive coverage of all the contents and learning outcomes to be included in the instrument. Akujo and George (2010) defined content validity of a test as its ability to measure the subject matter content in relation to the instructional objectives. It relates the content and the instructional objectives to be achieved. This is similar to what (Izukanne, 2008) described as the master plan and should be readily available to guide the test constructors in allocating number of items per content area. Table 2 provide a sample of test blue-print for a 60 test items in Physics.
Table 2: Sample format of Test Blue-print in Physics
Content Know. 40%
Comp. 25%
Appl. 20%
Ana. 5%
Syn. 5%
Eva. 5%
Tot. 100%
Mech.
(30%) 7 5 4 1 1 1 19
Optics
(10%) 2 2 1 0 0 0 5
Heat
(25%) 6 4 3 1 1 1 16
Motion
(20%) 5 3 2 1 1 1 13
Waves
(15%) 4 2 2 0 0 0 8
Total 24 15 12 3 3 3 60
Items Generation
Items generation or writing is done based on the format of test adopted by the researcher. However, regardless of the type of format used, (Anene & Ndubuisi, 2003), provided the following guidelines which must be adhered to in order to enhance the quality of the items.
• More items than will actually be required should be constructed.
• Item must be written in absolutely clear terms.
• The use of ambiguous and flamboyant words should be avoided.
• The test developer must ensure that clues to the right answers are not given.
• Items that are neither too difficult nor too easy should be constructed.
• Ensure that the time given is enough to complete the task.
• Build in a good scoring guide.
Validity
After writing the items, they are sent for validation. Validity refers to the extent to which an instrument measures what it ought to measure (Ezeh, 2015). Validity is the measure of the veracity of the instrument actually measuring what it purports to measure (Ali, 2006). In test development, validation of instruments could take varying procedure. For instance, the researcher may be interested in one or all of the following: face validity, content validity, factorial validation and construct validity of the instrument.
Face validity
Face validity assesses how the test measures what is supposed to test. Anyaokoha (2009) stated that a test is said to have face validity if it looks like going to measure what is made to measure. Face validity involves a cursory glance of a test. A test that looks like it measures what is expected to measure has face validity (Olayiwola, 2010). This is achieved by subjecting the instrument to the scrutiny of relevant experts in measurement and evaluation as well as subject expects (validates) in the area of the study. After the face validity of the instrument, items are usually reviewed to identify those that survive the scrutiny.
Content validity
Content validity is the extent to which the test adequately or extensively covers the area, syllabus or some segments designed to be tested (Olayiwola, 2010). The procedure for establishing content validity involves what Nworgu (2015) referred to as test blueprint or table of specifications. An educational test with strong content validity will represent the subjects actually taught to students, rather than asking unrelated questions. It may be difficult if not impossible for a test to cover the content of the entire subject matter or syllabus, however, a multiple-choice objective test would cover a considerable subject matter than an essay type test. Content validity is often seen as a prerequisite to criterion validity, (Criterion validity assesses whether a test reflects a certain set of abilities or not) because it is qualitative in nature, and asks whether a specific element enhances or detracts from a test or research program.
Construct Validity
personality test (measures typical behavior — traits) and
aptitude tests or achievement tests, which measures potential for acquiring specific skill (Kaplan & Saccuzzo, 2009). This can be achieved using factor analysis. Items that survived validity process are trial-tested, by administering the test on an equivalent sample of the group for which the test is developed (Ezeh, 2015). The scripts are then scored and used for factor analysis to determine the construct validity of the test or for item analysis to establish the item difficulty index and discrimination index or both depending on the type and nature of test instrument.
Factorial validation
In test construction, a general goal is to arrive at a test of minimum length that will yield scores with the necessary degree of reliability and validity for the intended uses (Crocker and Algina, 2008:211). This could be accomplished by field testing the items generated on a sample. A subset of items that makes the greatest contribution to reliability or validity of the instrument is then selected from that initial pool of items by factor analysis. Two statistical measures are also generated to help assess the factorability of the data: Bartlett’s test of sphericity (Bartlett, 1954 cited in Pallant, 2005) and Kaiser-Meyer-Olkin (KMO) measure of sampling adequacy (Kaiser, 1970, 1974 cited in Pallant, 2005). The Bartlett’s test of sphericity should be significant at (P < 0.05) for the factor analysis to be considered appropriate. The KMO index ranges from 0 to 1, with 0.6 suggested as the minimum value for a good factor analysis (Tabachnick & Fidell, 2001).
Checking the strength of items inter-correlations
A preliminary factor analysis is to be carried out to ascertain the strength of inter-correlations among the items generated. Tabachnick and Fidell, (2001) recommend an inspection of the correlation matrix for evidence of coefficients greater than 0.3 If few correlations above this level are found, then factor analysis may not be appropriate. However, if Bartlett’s test of sphericity and KMO value are found to be appropriate, items with correlation matrix for evidence of coefficients greater than 0.3 are then selected.
Item analysis
When instruments are developed and validated for educational research purposes, it is very important to conduct item analysis. Item analysis is a general term that refers to the specific methods used in education to evaluate test items, typically for the purpose of test construction and revision (Eaves & Erford, 2009). Item analysis of a test comes after the preliminary draft of a test has been constructed, administered on a sample and scored out (Boopathiraj & Chellamani, 2013). This is done to determine item difficulty and discrimination index of the instrument.
Difficulty index
Difficulty index is a measure of the level of how simple or hard each item in the instrument is. It is a measure of the rate of the number of pupils who got the item correct to the number of pupils who took the test (Izukanne, 2008).
Also Matlock-Hetzel (1997), defines item difficulty as ―the percentage of students taking the test who answered the item correctly‖. The larger the percentage getting an item right, the easier the item. The higher the difficulty index, the easier the item is understood to be. Item difficulty is computed by dividing the number of students who answered an item correctly by the total number of students answering the item. The proportion for the item is usually denoted as ―p‖ and is called item difficulty. A p value is basically a behavioral measure. Rather than defining difficulty in terms of some intrinsic characteristics of the item, difficulty is defined in terms of the relative frequency with which those taking the test choose the correct response (Thorndike, Cunningham & Hagen, 1991). In discussing the procedure of determining the minimum and maximum score on a test, Thompson and Levitov (1985), stated that items tend to improve test reliability when the percentage of students who correctly answer the item is halfway between the percentages expected to correctly answer the item.
Discrimination index
In test analysis, Discrimination index is an indicator that shows how sharply a test item differentiates between the more or less able students (Izukanne, 2008). In other words, it is a measure on how the items are able to discriminate between the good students and the not so good students. In computing the discrimination index, ―D‖, scores of each student’s test is rank ordered (Matlock-Hetzel, 1997). Next, the 27% (Wiersman & Jurs, 1990) or 25% (Nunnally cited in Matlock-Hetzel, 1997) of the students at the top and the 27% or 25% at the bottom are separated for the analysis. Wiersman and Jurs (1990) stated that 27% is used because it has shown that this value will maximize differences in normal distributions while providing enough cases for analysis. The discrimination index, ―D‖, is the number of people in the upper group who answered the item correctly minus the number of people in the lower group who answered the item correctly, divided by the number of people in the largest of the two groups (Ohuche & Akeju in Anene & Ndubuisi, 2015). When more students in the lower group than in the upper group select the right answers to an item, the item actually has negative discrimination index. This kind of item according to Wood cited in Matlock-Hetzel (1997), is not only useless but is actually serving to decrease the validity of the test. Hence must be deleted from the pool of items.
Reliability
A test is said to be reliable if after repeated use, the results obtained are not different from each other (Sambo, 2008). Ali (2006) defined reliability as the extent to which measures obtained from repeatedly using an instrument do not vary so that such a value is then consistently accurate. Reliability has to do with consistency and stability of an instrument or test (Olayiwola, 2010). Reliability indexes determine the proportion of the test score that is due to error (Korb, 2014). There are many reliability estimators.
Estimate of temporal stability (Test Re-Test)
between the two administrations of the instrument. This is
commonly known as test re-test.
Estimate of internal consistency
This refers to the degree of consistency with which the item of an instrument measures a given trait. The various procedures for establishing this type of reliability given by Nworgu (2015) include the following:
i. Split-half method: this is obtained by first splitting the scores of a test into two equal halves (odd/even, 1st half and 2nd half, etc.) and correlate the scores using Pearson ―r‖ or Spearman rank order correlation coefficient. Then the reliability of the whole instrument is obtained by applying the Spearman-Brown Prophecy formula as follows:
Reliability (rt ) =
2
1 r
r
ii. Rulon’s method: this uses only the variances of the scores from the two halves scores of the instrument and the variance of the scores from the whole instrument.
Reliability (rt ) =
2 2 1 2 2 h h t
Where: h21= variance of 1st half instrument
cores, h22 = variance of 2nd half instrument
scores, t2 = variance of the whole instrument
iii. Kuder-Richardson (K-R) method:
a. For dichotomously scored items (pass or fail or items vary in terms of difficulty/facility index) – KR-20
2 0 1 2
1 K R p q K r K
Where:rKR20 = Kuder-Richardson KR20, K = Total number of test items, P
= Proportion of the samples who pass an item, q =
Proportion of the samples who fail an item, 2 =
Variance of the entire test
P q
= Sum of P and q
Table 3: Sample Table Format for KR-20
ITEM P q Pq X (Xi X ) ( )2
i
X X
Total
b. For items of homogenous or uniform difficulty/facility index – KR -21
2 1 1 2
1
K R
X K X
K r
K K
Where:
K = total number of test items, X = mean of the entire
test, 2= variance of the entire test
iv. Cronbach’s Alpha method: this procedure applies to instruments that are polytomously scored. For instance, essay type achievement tests. Though there are no much differences between KR-20 and Cronbach Alpha.
2 2 1 1 i t K r K
Where: i2 = Variance of a single item, t2 = Variance
of the whole instrument
Estimate of equivalence
This estimate entails administering the equivalent or alternative forms (or the two versions) of the instrument on the same sample. The scorers from the two forms are correlated using either Pearson or Spearman Rank Order correlation coefficient, and the reliability obtained using Spearman-Brown Prophecy formula.
Scorer reliability
a. Two scorers/raters (i.e. only two set of scores) use Pearson or Spearman Rank Order correlation coefficient.
b. More than two scorers/raters (i.e. more than two set of scores) use Kendall’s Coefficient of Concordance.
Kendall’s coefficient of concordance (W): is a statistical technique which could be used to determine the
relationship between three or more set of test scores called ranks (Nworgu, 2015).
2 2 2 1 2 1 D WM N N
Where:
D = difference between the sum of ranks for each row of test scores and the average (mean) scores of the entire ranks, M = the number of sets of ranks (tests) to be correlated, N = number of individuals.
Table 4: Sample Table Format of Kendall’s coefficient of concordance
Student Ranks (Scores of tests A-E) Sum of Ranks (X)
D
(X-X )
D2
A B C D E
Total
The reliability coefficient of one rater r is calculated
using Guilford (1954) formula
2
2
1 2 ( 4 2 )
1
( 1) ( 1) ( 1) ( 1)
S
K N
r
K N K K N N
And the Spearman-Brown formula for determining the
total reliability rn for K number of raters is calculated
using rn as required by Guilford
1 ( 1)
n
K r r
K r
Where: K = number of raters, N = Number of content areas
Test Theory
The purpose of test theory in research is to help the researcher become more aware of the logic and mathematical models that underlie standard practices in test construction and use. Awareness of these theories, their assumptions and limitations will lead to improved practice in test development and validation and more intelligent use of test information in decision making. Test theory plays an important role in the overall process of research methodology by offering general methods for testing the sensitivity and accuracy of the measurement procedure developed. The two currently and most popular statistical frameworks identified for addressing measurements problems such as test development are Classical Test Theory (CTT) and Item Response Theory (IRT) (Hambleton & Jones 1993). It has equally been observed (Lord cited in Hambleton & Jones 1993) that in test development, examinee observed scores and true scores are not synonymous with ability scores: ability scores are more fundamental because they are test independent and are associated with IRT, whereas observed scores and true scores are test dependent and are associated with CTT. Basically, classical item statistics such as item difficulty (K) and item discrimination (D) and test statistics such as test reliability are dependent on the examinee sample in which they are obtained (Hambleton & Jones 1993). Test developers have a choice of working within a CTT framework or on IRT framework, or even a combination of frameworks. This is possible because test theories provide a general framework linking observable variables, such as test scores and item scores to unobservable variables, such as true and ability scores (Crocker & Algina, 2008). Classical Test Theory (CTT) is a theory about test scores that introduces three concepts: test score (often called the observed score), true score and error score. Research studies (Millman & Greene, 1989, Henrysson, 1971) have shown that most works in CTT are focused on models at the test scores level. That is, the models have linked test scores to true scores. However, item statistics that represent item difficulty and item discrimination power have been adopted, and their connection to test statistics, such as test-score, mean, standard deviation and reliability are well-known and are used in test development process to produce tests with the desired statistical properties.
These item statistics (and their variations) have proven valuable in test development process. They are well known and have a long track record.
Item Response Theory (IRT) on the other hand, is a general statistical theory about examinee item and test performance, and how performance relates to the abilities that are measured by the items in the test (Millman & Greene, 1989). Item responses can be discrete or continuous and can be dichotomously or polychotomously scored (Hambleton, 1989). Item score categories can be ordered or unordered, there can be one ability or many abilities underlying test performance and there are many models in which relationship between items responses and the underlying ability or abilities can be specified; thereby knowing precisely where an item is doing its best measurement on the ability scale, and knowing the exact relationships between item performance and ability in contrast to CTT. Like the CTT, IRT models are in wide use in test development.
Suggestions
Based on the discussion from the paper, the following recommendations were made:
1. Researchers who are interested in developing test instruments should employ the processes outlined in any of the Test Development Models provided. 2. Test development Model II should be employed when construct validity of the instrument is required.
3. Assigning percentage for content areas of a test blue-print should be based on already established percentage weights.
4. Only items found within the acceptable difficulty and discrimination indexes should be included in the final draft of the developed instrument. 5. Researchers should avail themselves of the logic
and mathematical framework (such as item analysis) provided by test theories for the purpose of test construction and use.
Conclusion
Test development is an integral part of educational research. The development of research instrument, which is to be characterized by sound psychometric property depend on researcher’s ability to employ the processes provided for, in any of the Test Development Models. This would help in designing test instruments that are valid and reliable for intended use.
References
[1]. A. Ali, Conducting research in education and the social sciences. Tashiwa Networks Ltd 2006.
[2]. L. A. Althouse, ―Test development: Ten steps to a valid and reliable certification exam‖ 2003. Available: http://www2.sas.com/proceedings
[Accessed September 7, 2015]
[4]. G. U. Anene, O. G. Ndubuisi, Educational
measurement and evaluation: Theory and practice. University Trust Publishers, Nsukka Enugu State, Nigeria. 2015
[5]. E. U. Anyakoha, Development research skills, concepts and conceptual framework. Nsukka: Great AP express publishers ltd 2009.
[6]. C. Boopathiraji, K. Chellamani, ―Analysis of test items on difficulty level and Discrimination index in the test for research in education‖. International journal of social Science and interdisciplinary research. 2(2), 189-193, 2013
[7]. L. Crocker, J. Algina, Introduction to classical and modern test theory. Cengage Learning USA 2008
[8]. M. Cyril, Development of test models for instruments in educational research. Lambert Academic Publishing 17 Mldrum Street, Beau Bassin 71504, Mauritius, 2008
[9]. S. Eaves, B. Erford, ―Item analysis.‖ 2009. Available: www.education.com/reference/
[Accessed October 24, 2013]
[10].D. N. Ezeh, Educational measurement and evaluation: Theory and practice. University Trust Publishers, Nsukka Enugu State, Nigeria 2015.
[11].J. Ezeugwu, ―Continuous assessment mode of evaluation in UBE programme: issues of teacher quality in assessment and record-keeping.‖ African journal of science, technology and mathematics (AJSTME). 2(1), 129 – 138, 2012.
[12].R. K. Hambleton, R. W. Jones, ―Comparison of classical test theory and item response Theory and their applications to test development.‖ 1993. Available:
http://www.educationalmeasurement/issues&practic e, [Accessed January 13, 2015]
[13].R. K. Hambleton, Principles and selected applications of item response theory. New York: Macmillan, 1989
[14].J. Izard, Trial testing and item analysis in test construction. Paris: International Institute for Educational Planning, 1997.
[15].M. I. Izukanne, Educational psychology in measurement and evaluation. University of Nigeria press Ltd, 2008.
[16].M. I. Junaidu, ―Education, National Security and Economic Empowerment: a re-appraisal.‖ Keynote address at the 5th Annual Conference of the Faculty of Education, UDUS 5th -8th November 2018.
[17].K. A. Korb, ―Calculating reliability of quantitative measures.‖ 2014. Available:
www.real- statistics.com/reliability/kuder-richardson-formula-20 [Accessed: November 11, 2013]
[18].S. Matlock-Hetzel, ―Basic concepts in item and test
analysis.‖ 1997. Available:
http://ericae.net/ft/tamu/Espy.htm [Accessed: October 26, 2013].
[19].M. McAlpine, ―A summary of methods of item
analysis.‖ 2002. Available:
www.caacentre.ac.uk/dldocs [Accessed: October 26, 2013].
[20].D. B. McCoach, R. K. Gable, J. P. Madura, J. P. ―Review of the steps for designing an instrument.‖
2013. Available:
http://link.springer.com/chapter/10.1007/ [Accessed: July 9, 2015].
[21].J. Millman, J. Greene, The specification and development of tests of achievement and Ability. New York: Macmillan, 1989.
[22].B. G. Nworgu, Educational measurement and evaluation. Theory and practice. University Trust Publishers Nsukka, Enugu State, Nigeria, 2015.
[23].B. G. Nworgu, Educational research. Basic issues and methodology. University Trust Publishers Nsukka, Enugu State, Nigeria, 2015
[24].A. O. Olayiwola, Procedures in educational research. Kongo (Nig.) Ltd. NN6 Lokoja Road/Lagos street Kaduna, 2010.
[25].K. N. ―Qualitative research methods and educational planning.‖ 2005. Available: http://www.unesco.org
[Accessed: March 15, 2013].
[26].A.A. Sambo, Research methods in education. Stirling – Horden publishers (Nig.) Ltd Lagos, 2008
[27].B. Thompson, J. E. Levitov, ―Using microcomputers to score and evaluate test items.‖ Collegiate Microcomputer, 3, 163-168, 1985.
[28].R. M. Thorndike, G. K. Cunningham, R. L. Thorndike, E. P. Hagen, Measurement and evaluation in psychology and education. New York: MacMillan, 1991.