THE MOLECULAR GENETICS OF
CHARCOT-MARIE-TOOTH DISEASE
PAULA JANE HALLAM
Submitted for the degree of Doctor of Philosophy July 1993
ProQuest Number: U063389
All rights reserved
INFORMATION TO ALL USERS
The quality of this reproduction is dependent upon the quality of the copy submitted.
In the unlikely event that the author did not send a complete manuscript and there are missing pages, these will be noted. Also, if material had to be removed,
a note will indicate the deletion.
uest.
ProQuest U063389
Published by ProQuest LLC(2016). Copyright of the Dissertation is held by the Author.
All rights reserved.
This work is protected against unauthorized copying under Title 17, United States Code. Microform Edition © ProQuest LLC.
ProQuest LLC
789 East Eisenhower Parkway P.O. Box 1346
ACKNOWLEDGEMENTS
This project was supervised by Dr S Malcolm and supported by the M uscular
D ystrophy G roup of G reat Britain and N orthern Ireland.
I w ould like to thank the following people for their invaluable assistance
during this project: Dr H M iddleton-Price for unravelling the mysteries of the
LIPED and LINKAGE packages and P R utland for com puting generally; Dr P
Scambler for the use of the Phospho-Im aging equipm ent and D Kelly for
guiding m e through its application; J Eckersley and Calvin for their patience
w ith the preparation of the figures; all the patients and clinicians w ithout
w hom there w ould have been no project; and all the members of Club 5022
w ho offered support and encouragem ent w hen it was so desperately needed.
Finally, I w ould like to thank Michael for his unw avering support and limitless
ABSTRACT
Charcot M arie Tooth disease is the commonest of the inherited peripheral
neuropathies, w ith an incidence of 1/2500. The m ost frequent form of
inheritance is one of autosom al dominance. The majority of families show ing
this m ode of inheritance have show n linkage to probes from the pericentric
region of chrom osome 17 although genetic heterogeneity does exist, w ith some
families show ing linkage to chrom osome 1 probes.
Eight large families, six of w hom had previously show n linkage to probes
from the pericentric region of chromosome 17 were exam ined w ith probes
from the short arm of chrom osome 17. Two-point and m ulti-point linkage
analyses w ere used further to localise the genetic location of the disease gene
to the 12cM region betw een probes pl0.41 and EW503 on 17pl 1.2-12. M ulti
point analysis gave a m axim um lod score of 9.97 for the interval betw een these
tw o probes. Cross-overs still rem ained, in different families, betw een the
disease locus and both flanking probes.
Following the identification of sub-microscopic duplication of part of 17pll.2
in patients w ith C M T la from tw o other groups, the families in our study
group w ere analyzed for evidence of this duplication. The duplication was
detected in all eight families, as well as in twenty-seven smaller families
previously too small for conventional linkage analysis and num erous sporadic
cases.
The region of duplication seems consistent in the eight families studied in
detail, including probes VAW409R3 (D17S122), VAW412R3 (D17S125) and
pEW401 (D17S61), a region thought to be approxim ately 1Mb. Cross-overs
still exist w ithin the duplicated region, w ith probes VAW409R3 and pEW401
(VAW412R3 being uninform ative), although there is complete concordance of
the duplication w ith the disease phenotype.
CONTENTS
Page
TITLE PAGE 1
ABSTRACT 2
ACKNOWLEDGEMENTS 4
LIST OF FIGURES 11
LIST OF TABLES 14
1 .0 INTRODUCTION 16
1.1 CHARCOT-MARIE-TOOTH DISEASE 17
1.2 ANATOMY OF NEURONES 21
1.3 MYELIN 24
1.4 GENE MAPPING APPROACHES 26
1.4.1 Cytogenetic abnorm alities 27
1.4.2 As applied to CMTl 27
1.4.3 M urine hom ology 27
1.4.4 M urine hom ology for CMTl 28
1.4.5 Linkage approach 33
1.4.6 Linkage approach for CMT 33
1.5 GENE MAPPING BY PHYSICAL METHODS 39
1.5.1 Banding of chromosomes 40
1.5.2 Somatic cell hybrids 40
1.5.3 D eletion m apping 41
1.5.4 Translocation m apping 41
1.5.5 In-situ-hybridisation 41
1.5.6 Pulsed-field gel electrophoresis 42
1.6 GENETIC MAPPING 43
1.6.1 Linkage 43
1.6.2 Genetic m ap distance 43
1.6.3 M apping functions 44
1.6.4 Genetic m arkers 46
1.6.4.1 Restriction Fragm ent Length Polym orphism s 46
1.6.4.2 Minisatellite sequence polym orphism s 46
1.6.4.3 Microsatellites 48
1.6.4.4 Single stranded conform ation polym orphism s 48
D enaturing gradient gel electrophoresis
1.7 LINKAGE ANALYSIS 48
1.7.1 Two-point linkage analysis 50
1.7.2 Levels of significance 59
1.7.3 M ulti-point linkage analysis 60
1.7.4 C om puter program s 61
1.8 CHROMOSOME 17 61
1.8.1 Regions of synteny w ith m ouse chromosome 11 61
1.9 AIMS OF THIS PROJECT 64
2.0 MATERIALS AND METHODS 65
2.1 MATERIALS 66
2.1.1 Family data 66
2.1.2 Probes 67
2.1.3 Chemicals and reagents 67
2.1.4 Enzymes 68
2.1.5 N ylon m em branes 68
2.1.6 Photography, autoradiography and Phospho 68
2.2 SOLUTIONS 74
2.3 METHODS 76
SOUTHERN BLOTTING OF HUMAN DNA 76
2.3.1 Preparation of hum an DNA from blood 76
2.3.2 Digestion of hum an genomic DNA 76
2.3.3 Electrophoresis of genomic DNA 77
2.3.4 DNA transfer to H ybond-N + 77
2.3.5 H ybridisation of 32-P-labelled DNA to filters 78
PROBE DNA 79
2.3.6 PREPARATION OF PLASMID DNA 79
2.3.7 Transform ation of bacteria w ith plasm id DNA 79
2.3.8 Preparation of glycerol stocks of transform ed
bacteria 80
2.3.9 Isolation and purification of plasm id DNA
2.3.10 Isolation of plasm id insert from vector DNA 81
2.3.11 OLIGO-LABELLING OF PLASMID OR INSERT
DNA 82
2.3.12 Removal of unincorporated nucleotides 82
2.3.13 PRE-ANNEALING OF PROBES 82
2.3.14 Preparation of hum an DNA for pre-annealing
from blood 82
2.3.15 Preparation of hum an DNA for pre-annealing from
placental tissue 82
2.3.16 Pre-annealing probes 84
DATA ANALYSIS 85
2.3.17 Tw o-point linkage analysis 85
2.3.18 M ulti-point linkage analysis 85
DOSAGE ANALYSIS 86
2.3.19 W ith A4spJ-digested DNA 86
3.0 RESULTS 88
3.1 RFLP data 89
3.2 Tw o-point linkage analysis 108
3.3 M arker order in the centromeric region of
chrom osome 17 119
3.4 Cross-over analysis 120
3.5 M ulti-point linkage analysis 121
3.6 D uplication of 1 7 p ll.2 126
3.6.1 Presence of segm ental trisomy of 1 7 p ll.2 126
3.6.2 H aplotype frequency of alleles in duplicated region 130
3.6.3 Extent of the segm ental trisom y in these families 131
3.6.4 Presence of the duplication as a diagnostic tool
w ithin families 140
3.7 Cross-overs betw een probes within the
duplicated region and C M Tla 142
3.7.1 Failure to recognise the dosage effect and
apparent cross-overs 142
3.7.2 "True" cross-overs w ithin the duplicated region 144
3.8 CMT2 families 152
3.9 Small families and other sam ples 152
3.10 D uplication detection using probe VAW409R3a 154
3.11 D uplication detection using probes VAW409R3a,
VAW412R3HEb and E3.9 and EcoRI-digested DNA 155
3.11.1 Experimental design 155
3.11.2 Validation of the technique 155
3.11.3 Results of dosage analysis on clinical sam ples 169
Familial cases 195
Sporadic cases 196
Testing of asym ptom atic family m em bers 196
Recessive CMT 197
X-linked CMT 198
CMT2 199
Differential diagnosis 199
Pre-natal diagnosis 200
4.0 DISCUSSION 202
4.1 LINKAGE AND CROSS-OVER ANALYSIS 203
4.1.1 Tw o-point linkage analysis 203
4.1.2 M arker order in the centromeric region of
chrom osom e 17 205
4.1.3 Cross-over analysis 206
4.1.4 M ulti-point linkage analysis 208
4.2 DUPLICATION OF 17pll.2 210
4.2.1 Presence of the duplication in the eight families 210
4.2.2 Extent of the duplication 212
4.3 MECHANISMS CAUSING THE DUPLICATION 214
4.3.1 Cross-overs w ithin the duplication 217
4.4 MECHANISM OF DUPLICATION INDUCING
PATHOLOGICAL EFFECTS 220
4.6 CMT2 FAMILIES 225
4.7 DUPLICATION DETECTION IN SPORADICS
AND SMALL FAMILIES 226
4.7.1 Applicability of dosage analysis in clinical cases 229
4.8 FUTURE FOR THE STUDY 231
FIGURES
1.1 PNB m yelination 23
1.2 M olecular organisation in PNB m yelin 25
1.3 Recombination fraction and genetic distance 47
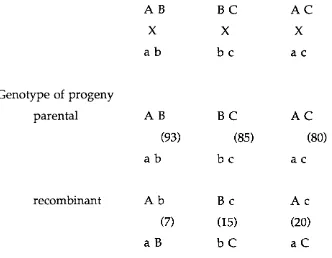
1.4 Gene ordering w ith two-factor crosses 52
1.5 Assignm ent of gene order from two-factor crosses 52
1.6 Use of three-factor crosses to confirm gene order 53
1.7 Pedigree show ing segregation of autosomal
dom inant condition in a three generation family 56
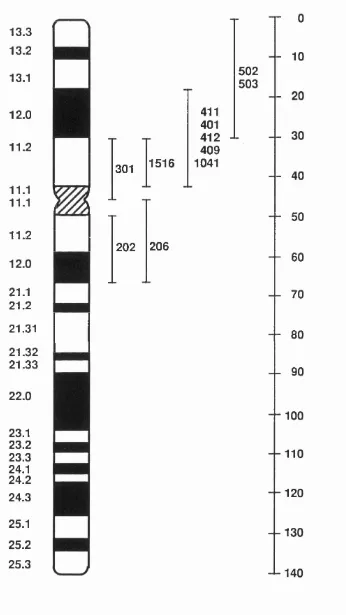
1.8 Ideogram of hum an chromosome 17 62
1.9 Syntenic regions of hum an 17 and m ouse chromosome 11 63
3.1 Pedigree of Family SM 90
3.2 Pedigree of Family MO 92
3.3 Pedigree of Family PE 95
3.4 Pedigree of Family W H 98
3.5 Pedigree of Family GV 100
3.6 Pedigree of Family HED 102
3.7 Pedigree of Family FG 104
3.8 Pedigree of Family HEN 106
3.9 Schematic representation of recom binant chromosomes 122
3.10 M ulti-point linkage analysis including duplicated probes 124
3.11 M ulti-point linkage analysis excluding duplicated probes 125
3.12 Genomic DNA hybridised w ith probe VAW409R3a 128
3.13 A utoradiograph of Family PE DNA hybridised with
probe VAW409R3a 129
3.14 Genomic DNA hybridised w ith probe VAW412R3HEb 133
3.15 Genomic DN A hybridised w ith probe VAW401HE 135
3.16 Genomic DNA hybridised with probe 1041 136
3.17 Genomic DNA hybridised w ith probe VAW411R2 138
3.18 Schematic representation of duplication status
3.19 Genomic D N A hybridised w ith probe VAW409R3a 141
3.20 Family GV: Genomic DNA hybridised with
probe VAW409R3a 143
3.21 Part of Family MO: show ing cross-over betw een
probe VAW409R3a and the disease locus 145
3.22 Part of Family MO: RFLP results 146
3.23 Family MO, individual III-4 - explanation of
recom bination event 147
3.24 Family SM: RFLP results 148
3.25 Family SM, individual I-l - explanation of
recom bination event 149
3.26 Family PE: RFLP results 150
3.27 Family PE, individual HI-3 - explanation of
recom bination event 151
3.28 Genomic DN A from individuals w ith CMT2
hybridised w ith probe VAW409R3a 153
3.29 Genomic DN A hybridised sim ultaneously w ith probes
VAW409R3a, VAW412R3 and E3.9 156
3.30 Regression analysis of Phospho-Imaging control
d ata from Experiments 1-8 168
3.31 Regression analysis of Phospho-Imaging data from
Experim ent 1 173
3.32 Regression analysis of Phospho-Imaging data from
Experim ent 2 176
3.33 Regression analysis of Phospho-Im aging data from
Experim ent 3 179
3.34 Regression analysis of Phospho-Im aging data from
Experim ent 4 182
3.35 Regression analysis of Phospho-Im aging data from
Experim ent 5 185
3.36 Regression analysis of Phospho-Im aging data from
3.37 Regression analysis of Phospho-Imaging data from
Experim ent 7 191
3.38 Regression analysis of Phospho-Imaging data from
Experim ent 8 194
TABLES
1.1 Com position of hum an PNS myelin 24
1.2 Lod scores betw een CMTl and Duffy m arker 35
1.3 Lod scores betw een CMTl and chromosome 17 m arkers 37
2.1 Probes used in this study 69
3.1 RFLP data - Family SM 91
3.2 RFLP data - Family MO 93
3.3 RFLP data - Family PE 96
3.4 RFLP data - Family W H 99
3.5 RFLP data - Family GV 101
3.6 RFLP data - Family HED 103
3.7 RFLP data - Family FG 105
3.8 RFLP data - Family HEN 107
3.9 Two-point linkage analysis of CMTl and probe EW206 109
3.10 Two-point linkage analysis of CMTl and probe HHH202 110
3.11 Tw o-point linkage analysis of CMTl and probe EW301 111
3.12 Two-point linkage analysis of CMTl and probe cl516 112
3.13 Tw o-point linkage analysis of CMTl and probe 1041 113
3.14 Tw o-point linkage analysis of CMTl and probe VAW409R3 114
3.15 Tw o-point linkage analysis of CMTl and probe VAW412R3 115
3.16 Two-point linkage analysis of CMTl and probe EW401 116
3.17 Tw o-point linkage analysis of CMTl and probe EW503 117
3.18 Tw o-point linkage analysis of CMTl and probe EW502 118
3.19 H aplotype of MspI alleles w ithin duplication 131 3.20 H aplotypes of MspI alleles in the duplication
detected w ith probe VAW409R3a 131
3.21 Phospho-Im ager results from control sam ples from
Experiments 1-8 160
3.22 Phospho-Im ager results from Experiment 1 171
3.24 Phospho-Im ager results from Experiment 3 177
3.25 Phospho-Im ager results from Experiment 4 180
3.26 Phospho-Im ager results from Experiment 5 183
3.27 Phospho-Im ager results from Experiment 6 186
3.28 Phospho-Im ager results from Experiment 7 190
1.1 CHARCOT-MARIE-TOOTH DISEASE
Peroneal m uscular atrophy was first clearly described by Charcot and Marie,
and Tooth in 1886, although earlier similar cases had been documented. This
neuropathy was characterised by a denervation process which resulted in a
slow progressive w eakness and muscle atrophy. The lower limbs w ere
prim arily affected and this included involvem ent of the peroneal muscle, foot
deform ity and some sensory loss. A familial tendency was noted. Charcot
and M arie proposed a myelopathological basis for the disease, whilst Tooth
favoured a peripheral nerve disturbance.
M uch confusion arose following these original descriptions. Gom bault and
M allet described a patient in 1889 w ith hypertrophic neuropathy and club foot.
In 1893, Dejerine and Sottas show ed similar changes in a brother and sister,
w ith a severe progressive sensory and m otor neuropathy and thickened
peripheral nerves. The presence of nerve hypertrophy became synonym ous
w ith Dejerine - Sottas disease, and it was not until the 1950"s that it was
realized that hypertrophic neuropathy is a non - specific consequence of a
chronic segm ental dem yehnation and rem yelinadon which is seen in a w ide
variety of inherited and acquired disorders. Roussy and Levy added to the
confusion w ith their description in the 1920's of cases similar to those
described by Charcot, M arie and Tooth b u t w ith an additional static trem or of
the hands (H arding and Thomas, 1980 a.).
The classification of peroneal m uscular atrophy and related disorders became
m uch clearer w ith the introduction of nerve conduction studies in the m id -
1950's. Severe slowing of m otor nerve conduction was found in some patients
w ith peroneal m uscular atrophy w hilst other cases failed to show this. Dyck
and Lam bert (1968 a.) found that this phenom enon was consistent w ithin
families. They w ere also able to correlate the changes in conduction w ith
nerve biopsy findings. They w ere thus able to define tw o major groups based
on physiological and pathological criteria. The first group comprised cases
dem yelination sometimes associated w ith hypertrophic changes. This group
w as further subdivided into the hypertrophic Charcot-Marie-Tooth disease
T ype 1 (CMTl) and Dejerine-Sottas type neuropathy. The second major group
show ed neural degenerations w ith only slight, if any, reduction in nerve
conduction velocities and little evidence of segm ental demyelination. W ithin
this group fell the neuronal form of Charcot-Marie-Tooth Type 2 (CMT2),
hereditary spastic paraplegia and spinocerebellar degeneration w ith peroneal
m uscular atrophy (H arding and Thomas, 1980 a.) . Thomas et al. (1974) introduced the term hereditary m otor and sensory neuropathy (HMSN) for a
g roup of peroneal atrophies including the Charcot-Marie-Tooth and Dejerine-
Sottas disorders. This term w as later expanded to include CMTl as HMSN I,
CMT 2 as HM SN H, an d Dejerine-Sottas disease as HMSN m .
Dyck and Lam bert (1968 a.) concluded that Roussy-Levy syndrom e is an
expression of the gene for type 1 Charcot-Marie-Tooth disease since it is found
in patients w ith other family m em bers show ing m ore classical features of
CMT. There is no clear distinction in the clinical features of both conditions,
m ore a continuous spectrum of clinical findings. The neurophysiological and
histological features of the tw o disorders are identical.
H ence, CMT disease m ay be divided into tw o types on the criteria of m otor
nerve conduction velocities and pathological evidence of demyelination and
rem yelination giving rise to "onion bulb" form ations and axonal degeneration.
Following the study of 228 affected individuals by H arding and Thomas (1980
a.) the separation of CMT 1 and 2 w as evident in that individuals affected w ith
type 1 h a d m edian m otor nerve conduction velocities less than 38 metres per
second. The division of CMT disease into tw o types allowed for observations
to be m ade on the clinical features of each (H arding and Thomas, 1980 a.).
A bout tw o - thirds of individuals w ith CMT 1 have onset of sym ptom s in the
first decade. In about 60% of cases the initial low er limb weakness is followed
by involvem ent of the u p p er limbs. Total tendon areflexia was found in about
Distal sensory loss w as reported in over half the cases, pes cavus in nearly
three - quarters and scoliosis in 14% of individuals. The progression of the
disease is slow b u t w hile about 30% developing m arked weakness of the
ankles and feet few experience severe difficulty in getting around. Indeed,
one fifth of the affected relatives of the index patients in the study by H arding
and Thomas (1980 a.) w ere asymptomatic. There appears to be no correlation
of the severity of the disease and the degree of reduction in m otor nerve
conduction velocity.
M otor nerve conduction velocities are norm al or only slightly reduced in
individuals w ith CMT 2. The abnorm alities of sensory nerve conduction are
less obvious th an those seen in type 1 CMT. The neuropathy is one of axonal
origin and not dem yelination as show n in CMT 1. generally, the condition is
less severe and w ith a later age of onset than CMT 1. H arding and Thomas
(1980 a.) show ed the peak age of onset in type 2 patients to be in the second
decade w ith a significant num ber not developing sym ptoms until later,
som etim es n o t until the seventh decade. It is less comm on than in CMT 1 for
the w eakness to progress to involve the u pper limbs cind the upper limb
reflexes are usually preserved.
For both CM Tl and CMT2 the m ost common pattern of inheritance is one of
autosom al dom inance and all the families included in the linkage analysis
portion of this study show this pattern of inheritance. However, alternative
m odes of inheritance have also been reported.
In 1888 H erringham described a family w hich raised the possibility of an X-
linked form of the disease. Allan reported another family in 1939 which also
suggested the existence of an X-linked form (reviewed Vance, 1991). This was
d oubted by some investigators, and further exam ination of the H erringham
chromosome. The phenotypic expression of the X-linked from of CMT is
sim ilar to the autosom al dom inant form (Dyck et al. 1968a) Affected males in this family show ed slow NCVs and "onion bulb" form ation of sural nerve
biopsy. Some heterozygous females w ere asym ptom atic w ith norm al NCVs,
w hilst others h ad slow ed NCVs and severe m anifestations of the disease.
O ther families have been reported w ith X-linked CMT including a German
family w ith atrophy and weakness, tendon areflexia and reduced NCVs
compatible w ith a dem yelinating neuropathy. Males were m ore severely
affected than females (reviewed in Rozear et al. 1987). A nother family, described by Phillips et al. (1985), was thought to have X-linked dom inant CMT w ith males m ore severely affected than females and slow NCVs in m en
b u t borderline in wom en. Fischbeck et al. (1986) reported tw o families w ith an X-linked m ode of inheritance. In one of these families, males w ere severely
affected in childhood and obligate heterozygous females were norm al
clinically, including their NCVs. The neuropathy appeared to be axonal, not
demyelinating. The second family w as similar to that described by Rozear et al. (1987) w ith heterozygous females show ing variable degree of severity of sym ptoms. Most of the families reported, w ith the exception of that of
Fischbeck et al. (1986) w ere consistent w ith X-linked dom inant inheritance and w ithin m ost of these families the disease appears to be demyelinating. It has
been suggested that the X-linked dom inant and recessive forms are due to
variable expression of the same gene, rather th an separate genetic entities
(Vance, 1991).
H arding and Thomas (1980 b. and c.) have reported several families w ith
autosom al recessive forms of the disease. W ithin these families, there are
several features w hich support recessive inheritance; sym ptom-free parents of
affected individuals, the presence of m ultiple affected siblings, and increased
consanguinity. N erve conduction velocity studies suggest that autosomal
recessive form s exist of both CMT 1 and 2. These families cannot be
presentation or electrophysiological findings (Loprest et ah 1992).
1.2 ANATOMY OF NEURONES
All axons in the peripheral nervous system (PNS) and central nervous system
(CNS) are sheathed in accessory cells. Structurally, three types of nerve fibres
occur; one is enclosed in a sheath of fatty substance, myelin, and an outer
m em braneous sheath called the neurolem m a (sheath of Schwann) and is
know n as m yelinated or m edullated fibre. A second type has no myelin
sheath b u t does have a neurolem m a and is referred to as non-m yelinated or
non-m edullated fibre. Most non-m yelinated fibres belong to the autonomic
nervous system, which is concerned w ith visceral activity. A third type of
neuronal process lacks a neurolemm a. All fibres w ithin the central nervous
system and the optic and auditory nerves fall into this last category.
The m yelin sheath is form ed by the specialized glial cells - Schwann cells in
the peripheral nerves an d oligodendrocytes in the central nervous system. The
m yelin sheath is divided into segm ents corresponding to the territories of the
individual glial cells. In the m yelinated PNS of m am m als, the segments range
from 200 to over 2,000pm in length. The segm ents join at nodes (nodes of
Ranvier).
The m yelin sheath forms a highly resistive covering which isolates the
internodal axonal m em brane from extracellular electrical influences. The
nodes of Ranvier are the site of electrical excitation. Local currents generated
at one node of Ranvier pass through the cytoplasm of the axon to the next
node. Because of the insulation afforded by the myelin, m ost of this current
leaves at the next node, depolarising it to the point th at it also becomes excited
and begins to generate enough current to excite the next node, and so on.
Through the action of these local currents, the nerve im pulse moves dow n the
fibre, w ith the site of active excitation jum ping from one node to the next.
nerve impulses - an im pulse is conducted about ten times m ore rapidly than
in the absence of myelin. This m eans that for a given conduction velocity,
m yelination reduces the size of fibre required. Secondly, since excitation only
occurs at the nodes of Ranvier, less energy is spent in conduction of the action
potential, since it is only at the nodes that an "energy debt" is generated that
m ust be repaid during the resting period (Ritchie, 1984).
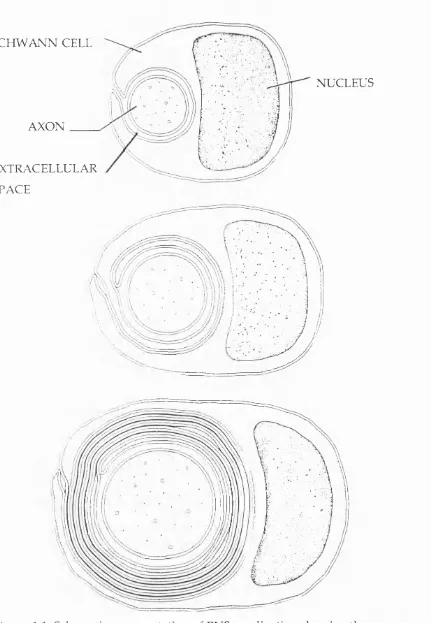
Ontogenetically, Schwann cells are thought to be of ectoderm al origin,
m igrating from the neural crest into the PNS during development. As axons
em erge from the CNS and enter the PNS, they are followed by m igrating
Schwann cells. Schwann cell proliferation continues until each axon lies w ithin
a furrow along the long axis of the Schwann cell. As the Schwann cell grows
it w raps itself aro u n d the axon. The processes of the Schwann cell that are
spiralled around the axon extrude their cytoplasm to form compact myelin
(Raine, 1984). This process is represented in Figure 1.1
Unlike m ost cells in the body, the term inally differentiated nerve cells caimot
reproduce by mitosis to replace any that are destroyed. The nerve fibres are
outgrow ths of the cell body of the neurone. If a fibre's connection w ith the
cell body is interrupted, the distal fragm ent ceases to function and
degenerates. The fibre m ay regenerate and restore function, provided it has
a neurolem m a. Since the nerve fibres w ithin the central nervous system lack
a neurolem m a, they are incapable of regeneration to restore function.
W hen a fibre w ith a neurolem m a is dam aged, the distal fragm ent disintegrates
and the debris rem oved by phagocytic cells. The Schwann cells of the
neurolem m a proliferate, form ing strands and a pathw ay along the course of
the degenerated portion of the fibre. The distal tip of the viable portion of the
fibre begins to extend bud-like processes and one of these extends into the
tube-like pathw ay form ed by the strands of Schwann cells. The process
continues to grow until it reaches the peripheral destination. N on-m yelinated
SCHWANN CELL
AXON
EXTRACELLULAR
SPACE
NUCLEUS
Figure 1.1: Schematic representation of PNS myelination showing the process
of specialization of the Schwann cell cytoplasm and compaction.
The ability of nervous tissue to re-create internodes of myelin following their
destruction and rem oval has been well docum ented (Raine, 1984). Regardless
of the dem yelinating event, the peripheral nervous system (PNS) has the
ability to rem yelinate all affected fibres w ithin a few weeks. Schwann cells
undergo rapid division, and the daughter cells m igrate to positions along the
naked nerve fibre. However, even w hen re-m yelination is complete, axons of
reduced diam eter and thinner-than-norm al PNS m yelin sheaths are still
evident over all the re-m yelinated segments.
1.3 MYELIN
Myelin, like other plasm a m em branes, is m ade up of lipids, carbohydrates in
the form of glycolipids and glycoproteins, and a smaller am ount of protein
Table 1.1: Composition of human PNS m yelin
W ater 35-45% total volume
Total protein 28.7% dry weight
Total lipid 71.3% dry weight
Of which cholesterol 23.0%
galactolipid 22.1 %
phospholipid 54.9%
(From N orton an d Gammer, 1984)
The lipid m atrix of myelin, like th at of other m em branes, is a bilayer of
phospholipids an d glycolipids. The lipids appear to be distributed
asym m etrically across the bilayer. There is about twice as m uch cholesterol
in the outer leaflet than in the inner leaflet of the bilayer. Most of the
cereboside (the m ajor galactolipid) is also found in the outer leaflet. The inner
MAG
Ext,
MBP
Cyt MBP
Figure 1.2: Diagrammatic representation of the molecular organisation in PNS
myelin. (Pq) major glycoprotein; (MBP) myelin basic protein; (MAG) myelin
associated protein.
The m ajor protein com ponents of the compact m yelin sheath include myelin
basic protein (MBP) and myelin-associated glycoprotein (MAG), which are
present in both the central and peripheral nervous systems. Two other
proteins are know n w hich are specific to the tw o parts of the nervous system:
proteolipid protein is found only in the central nervous system; and protein
zero (Pq) which is only found in the peripheral nervous system (Braun, 1984).
The arrangem ent of these proteins across the lipid bilayer is show n in Figure
1.2. The m ajor structural protein, Pq, is a glycoprotein w ith a m olecular weight
of about 28,000-30,000 and accounts for 50-60% of the protein in the PNS.
Im munocytochemical studies have show n that Pq is specific to peripheral
m yelin and is distributed throughout the m yelin lipid bilayer. The myelin
basic protein (MBP) is identical in both the PNS and CNS w ith a molecular
w eight of 18,500. It is thought to exist in heterodim er units and accounts for
40-50% of the total protein. It is an extrinsic protein w ith one or more
dom ains in contact, to a lim ited extent, with the hydrophobic interior of the
bilayer. The P2 basic protein is a m inor component (usually less than 2% of the total protein) and is also of this extrinsic type. The myelin associated
glycoprotein (MAG) constitutes less than 1% of the total protein. It is thought
to be a transbilayer protein w ith m ost of its bulk exposed to the exterior leaflet
of the bilayer (Braun, 1984; Lees and Brostoff, 1984)
1.4 GENE M A PPING APPROACHES
The forty-four autosom es and tw o sex chromosomes which m ake up the
hum an genom e carry betw een them almost all the genetic inform ation needed
for complete developm ent and functioning of all the cells within the hum an
body. The hum an genome contains 2.8 X 10^ base pairs of DNA, although less
than 3% of this codes for "unique" gene sequences. The rest consists of non
coding regions.
Early studies of hum an genetic diseases involved systematic searches of
biochemical finding w as observed. W hilst this approach provided the solution
to m any diseases, including the thalassaemias, other inherited disorders
involved sym ptom s too complex to allow the direct deduction of the
underlying biochemical defect.
The early 1980's saw the introduction of an alternative approach that allowed
the cloning of the gene by virtue of its chromosomal location. Since this
m ethod bypassed the initial need for know ledge of the basic defect of the
disease, b u t rather allowed this question to be answ ered after the gene had
been cloned, it became know n as "reverse genetics" or "positional cloning".
The chrom osomal localization of a disease locus is the first step in the isolation
and characterization of genes and the defects involved in genetic disorders.
1.4.1 Cytogenetic abnormalities
The identification of a visible cytogenetic abnorm ality present in affected
individuals can indicate the chromosomal location of candidate genes. Genes
know n to m ap near the region of abnorm ality m ust be considered as
candidates. This is especially so if the functional protein could be involved in
the disease process.
The disease locus for Duchenne m uscular dystrophy was initially localized to
the short arm of the X chromosome (Xp21) by the detection of structural
abnorm alities involving this region.
1.4.2 As applied to CM Tl
N o cytological abnorm ality or chromosomal rearrangem ent had been observed
in any patients w ith CM Tl to suggest a chromosomal location for the disease
locus.
1.4.3 Murine hom ology
The use of m an /m o u se syntenic regions represents a powerful tool in the
for Neurofibrom atosis type (1 N F l), or von Recklinghausen disease serves as
a good example of this com parative m apping strategy. The disease locus was
initially m apped to the long arm of chrom osome 17 by genetic linkage analysis
in affected families (Barker et al. 1987a; Seizinger et al. 1987). Cytogenetic abnorm alities were also im portant in isolating the N F l gene. Two
translocation breakpoints w ere m apped to 17qll.2. Com parative m apping
identified the hum an hom ologue for the m ouse ectropic viral integration site-2
gene (Evi-2). This m urine gene was localized to the syntenic region on m ouse chrom osome 11 and had been im plicated in leukaemogenesis (Buchberg et al.
1990). The hum an hom ologue was found to m ap to the interval betw een the
tw o translocation breakpoints described earlier (O'Connell, 1990). However,
m olecular analysis failed to reveal any m utation in N Fl patients. Examination
of further transcribed sequences in the region isolated a gene which was
finally confirmed as the N F l gene by the detection of several apparent disease-
causing m utations (Wallace et al.1990; C aw thon et al.1990)
1.4.4 Murine hom ology for CM Tl
The Trembler m ouse m utation (Tr) has been suggested as an animal m odel for
CM Tl disease (Vance, 1991). This autosom al dom inant trait was first described
by Falconer in 1951. The m utation manifests as a Schwarm cell defect (Aguayo
et al. 1977) and affected anim als suffer from a hypom yelinating neuropathy and continuing Schwann cell proliferation w ith onion bulb form ation in older
animals. The anim als m ove aw kw ardly and suffer from trem ors and transient
seizures. The Tr m utation m aps to m ouse chromosome 11, near a region that
is syntenic to hum an chrom osom e 17 (Buchberg et al. 1989).
Analysis of the protein com ponents of m yelin isolated from trem bler m ouse
sciatic nerve show s Pq and MBP are virtually absent from trem bler m yelin
Suter et al. (1992a) show ed that the Tr m ouse carries a point m utation in the peripheral m yelin protein-22 (PMP-22) gene on m ouse chromosome 11. PMP-
22 was initially identified as a grow th arrest specific (GAS-3) gene expressed
in serum starved m ouse 3T3 fibroblasts (Schneider et al. 1988). A transcript (CD25), hom ologous to the gas-3 gene and prim arily expressed in Schwann
cells, w as also identified by differential screening of rat cDNA libraries m ade
from crushed rat sciatic nerve versus contralateral, non-injured sciatic nerves
(Spreyer et al. 1991).
PMP-22 and gas-3 share 98% amino acid hom ology over the complete protein
sequence (Snipes et al. 1992). The rat hom ologue was show n to encode a m yelin protein (PM P-22/SRI3) expressed in rat peripheral nerve (Welcher et al. 1991). This 160 am ino acid protein has been show n to be expressed at a high level in the peripheral nervous system, accounting for u p to 0.2% of the
total mRNA. The transcript was m ost abundant in intact sciatic nerve and was
very low in other tissues including the central nervous system, suggesting a
high level of tissue specificity in the rat (Spreyer et al. 1991). Im muno- histochemical analysis (Welcher et al. 1991) dem onstrated that PMP-22 was associated w ith the m yelin sheath and correlates tem porally w ith the formation
of m yelin w hen com pared to the expression of MBP (Snipes et al. 1992).
Tem poral changes in the relative abundance of the mRNA in sciatic nerve
w ere analyzed using N orthern blots following tw o types of injury: firstly,
crush injury, which leads to W allerian degeneration in the distal nerve
segm ent prior to regeneration of axons from the proximal stum p into the distal
portion; an d secondly, transection of nerve and perm anent separation of both
portions to prevent axonal grow th into the degenerating distal portion.
In the proxim al portions of both crushed and transected sciatic nerves only
m inor changes in the abundance of mRNA w ere observed for at least four
rapidly decreased w ithin tw o days in the case of a crush injury and one week
following transection. In the regenerating distal portion of crushed nerve, the
transcript levels w ere show n to increase during the second week after the
injury, reaching control values of norm al nerve w ithin six weeks. Conversely,
in the distal portion of transected nerve, w here no axonal regeneration
occurred, the mRNA levels did not return to the norm al levels.
The p attern of expression of PMP-22 in the distal nerve stum p following sciatic
nerve crush injury w as comparable to the expression of other PNS myelin
proteins Pq and MBP (Snipes et a l 1992).
Spreyer et a l (1991) show ed that the re-expression of the transcript in crushed peripheral nerve w as closely related to axonal regeneration. Anastomosis of
a perm anently denervated distal stum p to its non-degenerated proximal nerve
segm ent lead to re-expression of mRNA in the distal stum p portions which
had received regenerating axons. These results suggested that Schwann cells
associated w ith axons express high levels of the transcript, and that
interruption of this relationship leads to a dow n-regulation in expression in
proliferating Schwann cells following nerve injury in vivo. Restoration of
Schwann cell-axon contact in regenerating nerve was thought to re-establish
the elevated levels of transcription to those of non-injured nerve.
H aving established PMP-22 as a putative m yelin protein, its expression was
com pared w ith other m yelin proteins (Snipes et a l 1992). The pattern of PMP- 22 expression in the PNS during developm ent was found to be essentially
identical to other PNS proteins such as Pq and MBP. In the im m ediate post
natal period PMP-22 mRNA is expressed at low levels (10% of the adult
m axim um ), b u t rapidly increases over the first three post-natal weeks w hen
it reaches near maximal levels.
The localisation of PMP-22 mRNA w ithin the m yelin sheath to the perinuclear
m em brane protein (Snipes et al. 1992). This pattern of perinuclear localisation is also seen in the PNS protein Pq and the CNS PLP. This is com pared to the
diffuse cytoplasmic localisation seen w ith MBP mRNA. These patterns of
mRNA expression are considered to dem onstrate the fact that both Pq and PLP
are integral m em brane proteins which m ust undergo intracellular processing
through the rough endoplasm ic reticulum and Golgi apparatus as opposed to
the soluble MBPs which are synthesised on free ribosomes. Lam perth et al.
(1990) have show n directly Pq mRNA processing using mRNA hybridisation
at the ultrastructural level to dem onstrate th at Pq mRNA is localised to the
rough endoplasm ic reticulum. Snipes et al. (1992) also show ed imuno- histochemically that PMP-22 w as not highly expressed in the Schwann cell
cytoplasm and was excluded from the cytoplasmic invaginations into the
m yelin sheath.
A dditional evidence that PMP-22 is an integral m em brane protein was
provided by analysis of its amino acid sequence which reveals four
hydrophobic dom ains thought to function as transm em brane spanning regions
and also a consensus site for N -linked glycosylation. PLP (which is restricted
to the central nervous system) was also predicted to be an integral m em brane
protein w ith four m em brane-associated zones (Pham-Dinh, 1991). M utations
in PLP h ad been identified as the prim ary defect in hereditary conditions
affecting the m yelination of the central nervous system in mouse, dog and
m an (review ed in Pham-Dinh, 1991).
The Trem bler m ouse show ed a point m utation, substituting an aspartic acid
residue for a glycine at position 150, in a putative m embrane-associated
dom ain of the PMP-22 protein (Suter et al. 1992a). This exchange introduces a charged am ino residue in the fourth putative transm em brane-spanning
dom ain and is likely to affect the structure and functioning of the protein.
Tr m ouse phenotype: the PMP-22 protein is expressed predom inantly by the
Schw ann cells of the peripheral nervous system and not w ithin the central
nervous system, the Tr m utation is m anifested as a Schwann cell defect of the
peripheral nervous system w ith no know n consequence in the central nervous
system. Secondly, the PMP-22 protein is localized in the compact myelin
sheath, consistent w ith the hypom yelination of peripheral nervous system
axons seen in Tr m utants. Thirdly, since PMP-22 mRNA expression has been
im plicated in cellular grow th arrest, the abnorm ality of PMP-22 could account
for the persistent Schwann cell proliferation seen in Tr mice.
Trembler-J (Tr^) is a spontaneous m utation th at arose independently from
Trembler. Tr and Tr^ w ere thought to be allelic since the two disorders were
phenotypically so similar and they both show ed linkage to the same m arker
(vestigial tail). Histologically both Tr and TP are characterized by a decrease
in axon m yelination and an increase in the num ber of Schwann cells.
H ow ever, there are m arked differences betw een the two. W hereas expression
of the Tr allele is truly dom inant, that of TP is semi-dominant, perhaps
show ing a dosage effect. Mice hom ozygous for the Tr^ m utation show the
m ost severe peripheral m yelin deficiency and die at 17 or 18 days. Mice
hom ozygous for the Tr m utation are longer-lived (Henry and Sidman, 1988).
Mice heterozygous for these m utations also show m arked differences. T r/+
mice have a m ore severe progression of sym ptom s w ith age than Tr^/+ mice.
This is especially apparent in the "onion bulb" structures, show ing repeated
cycles of dem yelination and rem yelination which are m uch m ore prom inent
in the T r / + animals.
The putative prim ary defect in Titm ice has been identified as a point m utation
at nucleotide position 190 - from thym ine to cytosine - which translates into
an exchange of proline for leucine at residue 16 (Suter et ah 1992b).
The tw o independent non-conservative m utations in the PMP-22 gene,
hereditary peripheral neuropathies in mice and possibly in hum ans.
1.4.5 Linkage approach
For the m ajority of genetic diseases in m an, gross chromosomal
rearrangem ents are not found as m arkers for the position of the disease gene.
In these cases gene localization m ay be achieved through linkage analysis w ith
know n genetic m arkers. The description of the localization of the gene for
cystic fibrosis (CF) illustrates that it is possible to identify a disease locus
solely on the basis of linkage analysis. N o gross chromosomal rearrangem ents
had been observed in affected individuals and no biochemical data was
available to assist in the localization of the gene. The high frequency of CF
m ade it possible to collect sufficient affected families for linkage analysis. The
first linkage to CF was detected w ith an enzym e m arker PON (Eiberg et al.
1985), b u t the chrom osomal location of CF resulted from linkage to an
arbitrary RFLP m arker D7S15 (Tsui et al. 1985). This m arker was m apped to chrom osom e 7 using a somatic cell hybrid (Knowlton et al. 1985). Two further closely linked probes w ere then described, MET (White et al. 1985) and D7S8 (W ainwright et al. 1985). These m arkers w ere show n to flank the CF gene. A variety of m ethods were used to generate probes within the region defined by
MET and D7S8. The CF gene w as eventually cloned through a series of
chrom osom e w alking and jum ping experiments, detection of cross-species
hybridization an d screening cDNA libraries m ade from tissues affected in CF
patients.
1.4.6 Linkage approach for CMT
A utosom al dom inant CMT disease is the m ost frequent form of the disease,
w ith a prevalence estim ated at 36/100,000 (Skre, 1974). The genetic basis for
autosom al dom inant CMT 1 has been extensively investigated in recent years.
In 1978 H eim ler et al. reported a single family w ith a dom inant hereditary neuropathy that appeared to be segregating together w ith the dom inant nevoid
basal cell carcinom a syndrom e. Previous evidence suggested linkage of the
therefore, it w as suggested that the locus for CMT disease could also be on
chrom osom e 1. This lead to the publication of a num ber of papers showing
linkage of the CMT disease locus to chrom osom e 1. Bird et ah (1982) presented tw o families comprising 3 and 4 generations, with a total of 23
affected individuals inform ative for the Duffy blood group locus know n to be
on the long arm of chromosome 1 (lq21 - q25). The m axim um lod score
obtained w as 2.297 at a recombination fraction of 0.10. In the same year
(Guiloff et al. (1982) obtained a slightly positive m axim um lod score of 0.890 at a recom bination fraction of 0.01 w ith the Duffy blood group locus in a study
of four families w ith 22 affected individuals. A stu d y of a single large kindred
of 50 individuals, 18 of w hom w ere affected (Stebbins and Conneally, 1982)
yielded a m axim um lod score of 3.11 at a recom bination fraction of 0.05 with
the Duffy locus. Dyck et al. (1983) described a family segregating for CMT I w ith a m axim um lod score of 1.19 at recom bination fraction 0.01 which added
further to the hypothesis th at type I CMT w as indeed linked to the Duffy locus
on the long arm of chrom osome 1.
Subsequently, several groups failed to confirm this linkage to chromosome 1.
These included Bird et al. (1983) w ith a lod score of -5.383 at a recombination fraction of 0.01 in a large three generation family, Dyck et al. (1983) w ith a lod score of -10.94 at a recom bination fraction of 0.01 and M arazita et al. (1985) w ith a lod score of -1.57 at a recom bination fraction of 0.01. Further
significantly negative lod scores were generated; lonasescu et al. (1988a) -10.83 at a recom bination fraction of 0.01, Griffiths et al. (1988) -15.33 at a recom bination fraction of 0.05 and M iddleton-Price et al. (1989) w ith a lod score of -20.74 at a recom bination fraction of 0.01. The lod scores between
CMT 1 and the Duffy locus are sum m arized in Table 1.2
Based on the genetic linkage results, at least tw o subtypes of autosomal
dom inant CMTl appeared to exist. Bird et al. (1983) proposed that CMT type la should refer to the disorder not linked to the Duffy blood group locus on
*
Table 1.2: Lod scores between CMT I and Duffy Marker (lq21 - q25)
Reference 0 (recom bination fraction)
0.01 0.05 0.10 0.20 0.30
Bird et a/.1982 0.36 1.99 2.30 1.96 1.30
Guiloff et fl/.1982 0.89 0.82 0.73 0.54 0.36
Stebbins & Conneally,1982 2.69 3.11 3.03 -
-Dyck et a/.1983 1.19 1.12 1.02 0.82
Bird et a/. 1983 -5.38 -2.72 -1.68 -0.78
Dyck et af.1983 -10.94 -4.98 -2.65 -0.77
-M arazita et a/. 1985 -1.57 -0.86 -0.55 -0.25
-lonasescu et a/.1988a -5.86 -2.32 -1.31 -0.33 -0.09
Griffiths et fl/.1988 - -15.33 -8.93 -3.71
In 1989 Vance et al. published linkage data on 194 individuals in six families segregating for autosom al dom inant CMT. This show ed significantly positive
lod scores w ith tw o probes m apping to the pericentric region of chromosome
17 and was suggestive of genetic heterogeneity of CMT type 1. Probe p i 0-41
(D15S71) gave a m axim um lod score of 7.36 at a recombination fraction of 0.06,
w hilst EW301 (D17S58) gave a m axim um lod score of 10.49 at a recombination
fraction of 0.05. This was shortly followed by other groups publishing data
from studies of their families w ith these chromosome 17 probes. In a large
pedigree Raeymaekers et al. (1989) w ere able to exclude chromosome 1 as the location for CM Tl and show linkage to chromosome 17. M iddleton-Price et al. (1990) studied eight families w ith CMT type I and confirmed linkage for D17S58 (EW301) w ith a m axim um lod score of 5.89 at a recombination fraction
of 0.08 and for D17S71 ( p i0-41) w ith a m axim um lod score of 3.22 at a
recom bination fraction of 0.08. A study of five Canadian families (MeAlpine
et al. 1990) gave a m axim um lod score of 10.83 at a recombination fraction of 0.00 w ith the probe EW301. Linkage analysis in a large French-Acadian
kindred segregating for CM Tl a (Patel et al. 1990) gave m axim um lod scores w ith EW301 and p i 0-41 of 2.37 (at a recombination fraction of 0.07) and 0.89
(at a recom bination fraction of 0.00). Tim m erm an et al. (1990) further analyzed the five-generation Belgian family affected w ith CMTl a initially reported by
Raeymaekers et al. (1989) for linkage w ith the chromosome 17 markers. Probe p i 0-41 gave a m axim um lod score of 6.13 at a recombination fraction of 0.00
and EW301 a m axim um of 11.29 at a recombination fraction of 0.08. The lod
CO
Table 1.3: Lod scores Betw een CM T I and Chrom osom e 17 M arkers.
6 recom bination fraction)
0.001 0.05 0.10 0.15 0.20 0.30 0.40
Vance e t ai.l989
EW301 6.21 10.49 10.18 9.30 8.18 5.42 2.29
plO-41 5.13 7.26 6.77 5.92 4.93 2.77 0.91
M iddleton - Price e t «1.1990
EW301 -0.14 5.68 5.85 5.49 4.87 3.29 1.52
plO-11 0.31 3.20 3.18 2.95 2.62 1.78 0.84
M cAlpine e t «1.1990
EW301 10.81 9.89 8.91 - 6.78 4.42 1.93
Patel e t «1.1990
EW301 1.89 2.34 2.25 - 1.78 1.14 0.45
plO-41 0.89 0.79 0.67 - 0.43 0.20 0.05
T im m erm an et «1.1990
EW301 2.42 11.04 11.21 - 9.54 6.76 3.33
The genetic relationship and location of D17S58 (EW301) and D17S71 (plO-41)
are well established (Goldgar et ah 1989). Pooled data from both sexes suggests th at EW301 lies approxim ately 5.5cM from the centromere on the
short arm of chrom osom e 17. Probe p i 0-41 is thought to lie 3.3cM distal to
EW301. W hilst initial m ulti-point analysis localized CMT type I to
chrom osome 17 it failed to resolve the relative order of the three loci. The fact
that some meioses show ed crossovers w ith both probes (Middleton-Price et ah
1990) m ade it less likely that the disease gene locus fell betw een the probe loci
than outside them. H ow ever it was unable to confirm w hether the disease
locus w as telomeric or centromeric.
W ith re-exam ination of m any CMTl families supporting a chromosome 17
locus and the low num bers of new chromosome 1-linked families, it was
suggested that the chrom osome 1 form of autosomal dom inant CMTl m ay be
not be a real entity, b u t m ay be a statistical artifact of the linkage data
(M iddleton-Price et ah 1989; Raeymaekers et ah 1989). However, it w ould appear th at genetic heterogeneity does exist for the autosomal dom inant form
of CM Tl. Chance et ah (1990) re-exam ined tw o families previously included in the stu d y of Bird et ah (1982). One pedigree which h ad show n a weakly positive lod score of 0.64 at 0 = 0.15 w ith the Duffy locus w as actually linked
to m arkers on chrom osom e 17 w ith a m axim um lod score w ith probe EW301
of 3.22 at 8 = 0.10. The other family segregating for CMTl had given a
m axim um lod score w ith the Duffy locus of 2.00 at 8 = 0.00 failed to show
linkage to the chrom osom e 17 probes w ith a m axim um negative lod score of
-3.52 w ith probe pA10.41 at 8 = 0.001.
A dditional evidence supporting genetic heterogeneity in CMTl has been
p rovided by Defesche et ah (1990) w ho described five CM Tl pedigrees, one of w hich show ed no linkage to chrom osome 17 m arkers and gave evidence for
lonasescu et al. (1992) described a fam üy segregating for autosomal dom inant CM Tl. Tw o-point and m ulti-point linkage analyses were strongly suggestive
of a CMT locus on chromosome Iq w ith a m axim um m ulti-point lod score of
2.70 at M U C l (0 = 0). M ulti-point analysis excluded the CMTl locus from
chrom osom e 17 m arkers in this family. Affected m em bers of this family also
failed to show evidence of the segmental trisom y detected w ith probe
VAW409R3a, th at has been described in families w ith CMTl a.
M uch less is know n about the genetic locus for CMT2. As CMTl and CMT
2 are clinically indistinguishable in an individual patient (without examination
of the NCVs), allelic heterogeneity has been suggested as a possible aetiology
for the differences in the tw o types. Previous linkage studies for CMT2
included a rep o rt by lonasescu et al. (1988b) of linkage data for CMT2 with the chrom osom e 1 serum amyloid m arker APCS in three families. A maxim um
lod score of 1.24 was achieved at 0 = 0.00. A later report by Loprest et al.
(1992) on three large families segregating for autosomal dom inant CMT2
excluded bo th the CM Tlb locus on chromosome 1 and the CMTl a locus on
chrom osom e 17.
1.5 GENE MAPPING BY PHYSICAL METHODS
Physical m aps m ay be cytogenetically or m olecularly based. Cytogenetically
based physical m aps order loci w ith respect to the visible banding pattern or
their relative position along the chromosome. The data for these m aps comes
prim arily from somatic cell hybrids and in-situ-hybridization. Molecularly
based physical m aps characterize large spans of DNA directly by establishing
m olecular landm arks including restriction endonuclease sites and "sequence
tagged sites". These m aps are usually produced from data generated from
1.5.1 Banding of chromosomes
Cytogenetically based physical m aps order loci w ith respect to the visible
banding p attern or their relative position along the chromosomes. Initially,
h um an chrom osom es were classified into one of seven groups on the basis of
their size. It was not usually possible to further differentiate betw een
chrom osomes unless polym orphic characteristics such as the uncoiler region
of chrom osome 1 allowed for recognition of individual chromosomes. In 1971
the Fourth International Congress of H um an Genetics introduced a num bering
system based on chromosome banding patterns produced by differential
staining techniques which m eant that each chromosome could be distinguished
and allowed for the description of a particular region on either the long or the
short arm of a particular chromosome.
1.5.2 Somatic cell hybrids
Identification of individual chromosomes also lead to the construction of
hum an-rodent cell hybrid panels - a range of rodent cells with a varied content
of hum an chromosomes. This has been used to m ap gene loci to
chromosomes. Somatic cell hybrids form ed a vital resource in the m apping of
the short arm of chromosome 11 in relation to W ilms' tum our. A hum an-
ham ster somatic cell hybrid that had chromosome 11 as its only hum an
com ponent (Puck et ah 1971) was used to generate a series of cell lines containing overlapping portions of chromosome 11. Deletion derivatives of
these lines form ed a deletion m ap of l i p based on the pattern of m arker
segregation in this panel. This has contributed to the developm ent of a
detailed m ap of this region of chromosome 11 by quickly localizing any
m arker or gene to a defined location. It has also proved invaluable in defining
the chrom osom al abnormalities associated w ith familial aniridia and WAGR
syndrom e (Pelletier et al. 1991).
m arkers from the region of chromosome 4 near to the H untington disease
locus (Cox et al. 1989).
1.5.3 Deletion mapping
The precise characterization of deletions has allowed the direct m apping of
som e disease loci. For example, the gene which codes for acid phosphatase 1
(APCl) in erythrocytes was localized to chromosome 2 by cytological
exam ination of tw o children (from tw o separate families) each w ith m ultiple
congenital abnormalities. Both children were show n to carry deletions of the
term inal portion of the short arm of chromosome 2. In one child, the
breakpoint was in the distal section of band 2p23. C ultured cell lines from this
child show ed norm al ACPI activity. The deletion in the second child extended
from the proxim al portion of band 2p23 to the telomere, cell lines containing
this chrom osome show ed no ACPI activity. From this evidence it was
inferred th at the ACPI gene is located w ithin the band 2p23 (Emanuel et al.
1979).
1.5.4 Translocation mapping
The locus for D uchenne m uscular dystrophy was also initially localized by the
detection of structural chromosome abnormalities. These structural
abnorm alities included X-autosome translocations in affected females
(Greenstein et al. 1977; Zatz et al. 1981) and a small deletion of Xp21.1 in a patient w ith m ultiple abnorm alities including DMD and McLeod syndrom e
(Francke et al. 1985).
1.5.5 In-situ-hybridization
Chrom osom e banding could be combined w ith techniques such as in-situ-
hybridization to enable direct m apping of gene probes to m etaphase spreads
(C O L lA l) to chrom osome 17q21-q22 (D'Eustachio and Ruddle, 1983). As well
as hybridizing isotopically labelled probes to chromosome spreads, fluorescent
molecules can be deposited at the sites of specific DNA sequences via
fluorescent in-situ-hybridization (FISH). Cosmids can be m apped w ith a
resolution of approxim ately 3Mb on m etaphase chromosomes, whilst using
FISH on interphase nuclei it has been possible to order seven probes m apping
w ithin 250kb in the DHFR region of Chinese ham ster cells (Trask et al. 1989).
1.5.6 PFGE
Pulsed - field gel electrophoresis (PFGE), which can separate DNA fragm ents
of several million base pairs, provides a m eans of constructing long range
physical m aps w hen used in conjunction w ith restriction endonucleases that
cut infrequently. This enables the identification of deletions and major
chrom osom al rearrangem ents (Schwartz et al. 1984). PFGE was used to generate a complete long-range restriction m ap of the region thought to be
involved in W ilm ' tum our (Rose et al. 1990). A specific deletion of l l p l 3 detected in W ilm 's tum our patients allowed for the characterisation of a
transcript encoding a zinc finger protein thought to represent the W ilm 's
tu m o u r gene (Call et al. 1990).
1.5.7 Chromosome walking and jumping
A chrom osom e w alk starts at a cosmid or YAC containing a stretch of DNA
th at has been m apped and orientated and is w ithin several megabases of the
target gene of interest. The cosmid or YAC is used to isolate other stretches
of DNA from a library w ith which it overlaps. This process is repeated until
the target gene is reached.
The distance covered by one step can be increased by extending the range of
m ethods used to isolate fragments. The circularization of large stretches of
DN A in this technique tu rn a walk into a chromosome jump. Chrom osom e
term inating a chrom osom e walk, it allows these sequences to be jum ped over.
Once a jum p has been m ade and positioned on a pulsed-field m ap,
conventional cosm id or phage walks can be initiated to yield probes suitable
for genetic analysis and physical m apping.
1.6 GENETIC MAPPING
Genetic m aps have been constructed from m any different types of data from
the first genetic linkage m ap produced by Sturtevant in 1913 to the complex
m olecular m aps of today. By 1991,2325 genes had been m apped in the hum an
genome, equivalent to approxim ately 5% of the estim ated 50,000 genes thought
to comprise the hum an genome. M ore than 10000 loci were defined by DNA
m arkers,of w hich about 3,000 are polym orphic (Williamson et a l 1991).
1.6.1 Linkage
Genetic linkage m aps are based on the co-inheritance of allele combinations
across m ultiple polym orphic loci. The parental combinations are usually
transm itted if the loci are molecularly close, b u t recombination at meiosis m ay
generate non - parental combinations m ore frequently if the loci are further
apart. The prim ary source of linkage data is the observation of allele
combinations in gametes. The allelic constitution has been determ ined
indirectly by fam ily studies b u t direct molecular analysis of gametes and single
chrom osomes has recently become possible. Linkage m aps are described in
term s of recom bination fraction and Morgans.
1.6.2 Genetic map distances
The term "recombination fraction" was introduced to describe the proportion
of non - parental recom binants in the total num ber of gametes and, therefore,
the genetic distance betw een them. The M organ (M) w as introduced as the
unit distance over which one crossover should occur in every gamete. Hence,
recom bination accounts for one in every h u n d red gametes. Unlike physical
distances betw een loci m easured in kilobases of DNA, distances m easured as
recom bination fraction are not additive. Therefore,whilst cM units are based
on the recom bination fraction, they are only directly proportional to it over
small distances.
The am ount of recom bination that occurs varies betw een the different
chrom osomes an d also betw een the sexes. The sites at which homologous
chrom osomes appear to exchange genetic m aterial during meiosis are term ed
chiasmata. A t least one chiasma occurs per chromosome arm per meiosis.
A bout 53 chiasm ata occur in the autosom es of the male giving an estim ated
m ale autosom al m ap length of 26.5M.
Recombination frequencies per megabase of DNA vary considerably by
chrom osom e region and by sex. Overall, there are higher frequencies of
recom bination in female meioses than in m ale meioses although the ratios of
sex specific m ap lengths differ am ong the chromosomes. The pattern of
regional variation shows that centromeric regions have proportionally higher
frequencies of recom bination in female meioses, and that telomeric regions
have m ore recom bination in m ale meioses.The higher recombination in females
results in an autosom al m ap 1.5 times that of the male. The predicted total
length for the sex - averaged linkage m ap is 3300cM (Morton, 1982) w ith the
average length of a chrom osome being 1.5M, that is, experiencing an average
of 1.5 chiasm ata per chromosome (Ott, 1991).
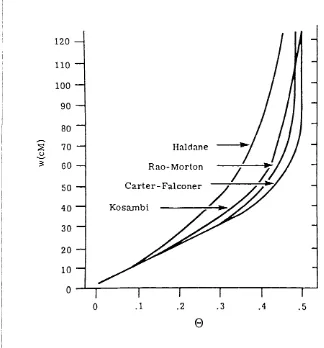
1.6.3 M apping functions
W hilst the frequency of recom bination is directly proportional to the physical
m ap interval over small intervals, the relationship betw een these two
param eters is complex. For larger intervals, this direct relationship is not