Nat. Hazards Earth Syst. Sci., 9, 1021–1031, 2009 www.nat-hazards-earth-syst-sci.net/9/1021/2009/ © Author(s) 2009. This work is distributed under the Creative Commons Attribution 3.0 License.
Natural Hazards
and Earth
System Sciences
Seismic safety assessment of unreinforced masonry
low-rise buildings in Pakistan and its neighbourhood
K. A. Korkmaz
Suleyman Demirel University, Civil Engineering Department, Isparta, Turkey
Received: 2 March 2009 – Revised: 2 June 2009 – Accepted: 10 June 2009 – Published: 29 June 2009
Abstract. Pakistan and neighbourhood experience numer-ous earthquakes, most of which result in damaged or col-lapsed buildings and loss of life that also affect the econ-omy adversely. On 29 October, 2008, an earthquake of magnitude 6.5 occurred in Ziarat, Quetta Region, Pakistan which was followed by more than 400 aftershocks. Many villages were completely destroyed and more than 200 peo-ple died. The previous major earthquake was in 2005, known as the South Asian earthquake (Mw=7.6) occurred in
Kash-mir, where 80 000 people died. Inadequate building stock is to be blamed for the degree of disaster, as the majority of the buildings in the region are unreinforced masonry low-rise buildings. In this study, seismic vulnerability of region-ally common unreinforced masonry low-rise buildings was investigated using probabilistic based seismic safety assess-ment. The results of the study showed that unreinforced ma-sonry low-rise buildings display higher displacements and shear force. Probability of damage due to higher displace-ments and shear forces can be directly related to damage or collapse.
1 Introduction
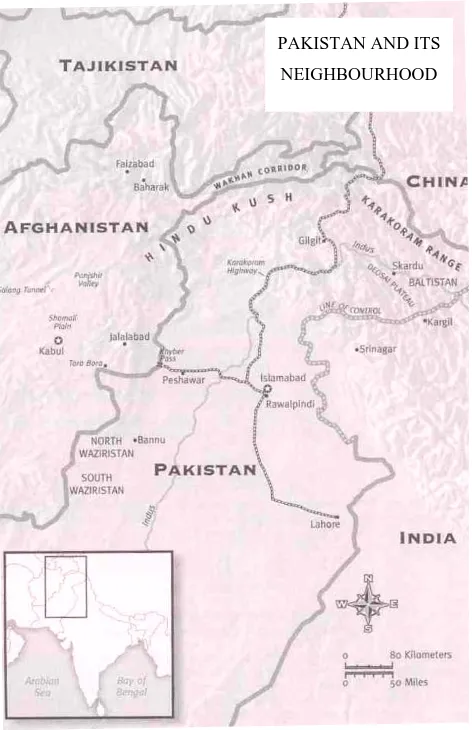
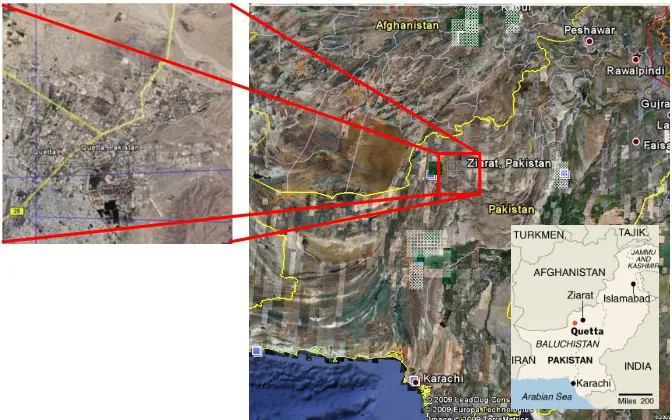
Earthquakes frequently hit different regions in Pakistan and its neighbourhood (see Fig. 1). On 29 October, 2008, a mag-nitude of 6.5 earthquake and more than 400 aftershocks hit Ziarat, Quetta Region, the provincial capital of Baluchis-tan, Pakistan. The Quetta region is one of the popular re-sort regions in Pakistan (see Fig. 2). This earthquake was responsible for more than 200 deaths, most of the existing
Correspondence to: K. A. Korkmaz
(armagan@mmf.sdu.edu.tr)
buildings were collapsed, many villages were completely de-stroyed and left more than 40 000 people homeless. The previous major earthquake, also known as the South Asian earthquake, occurred in Kashmir in 2005 and 80 000 peo-ple died. Quetta was flattened in 1935 by an earthquake that killed 30 000 people.
The vulnerability of urban areas to natural disasters in places like Pakistan and its neighbourhood has attracted sig-nificant attention among practical engineers in industry and researchers in academia (Mitomi et al., 2000). Although much research has been dedicated to prevention of at least reduction of disaster damage and loss, a satisfactory level has not been achieved. The utmost importance to achieve an ef-fective solution is the understanding of the real structural be-haviour. Time history analysis is one of the accurate methods for reliable definition of the structural behaviour of building stock in the region. Various researchers have studied dam-age assessment by using different applications for this region (Khan and Khan, 2008; Lisa et al., 2005; Naseer et al., 2007; Zare et al., 2008).
This study focuses on seismic safety assessment of unrein-forced masonry low-rise buildings in Pakistan and the neigh-bourhood using multiple methodologies. The seismic safety of unreinforced masonry buildings that dominate the build-ing inventory in the region was investigated by multiple ap-proaches. Four different representative buildings were mod-elled to demonstrate the building stock in the region. Non-linear time history analysis and probabilistic based seismic assessment analysis were performed on the representative buildings. The analysis results showed that unreinforced ma-sonry low-rise buildings present higher displacements, shear forces and probability of damage that can be directly related to damage or collapse.
1022 K. A. Korkmaz: Seismic safety assessment of unreinforced masonry low-rise buildings
19 Figure 1. Map of Pakistan and its neighbourhood
PAKISTAN AND ITS
NEIGHBOURHOOD
Fig. 1. Map of Pakistan and its neighbourhood.
2 Seismicity of Pakistan and its neighbourhood
Pakistan and its neighbourhood are prone to earthquakes. A high frequency of earthquakes has been experienced, result-ing in loss of life and property destruction. Accordresult-ing to records, this region sits in a moderate to a high seismic risk level. Parts of the North West Frontier Province, in the vicin-ity of Quetta and along the border with Iran, are in the high risk areas. Historically, earthquakes in the Mw 7.0 range
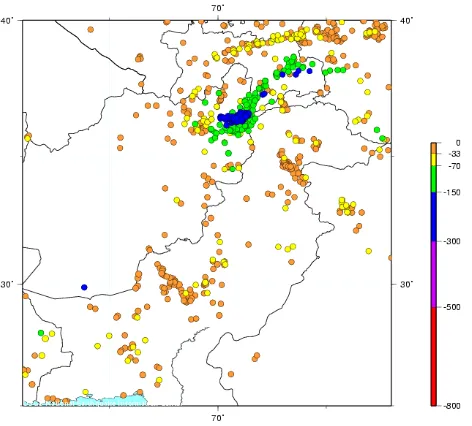
have been experienced in Baluchistan and along the border with Afghanistan and India (ASC, 2009). The seismic map of Pakistan and its neighbourhood is given in Fig. 3 and the major earthquakes are given in Table 1 (GSP, 2009; Zar´e et al., 2008; Khan and Khan, 2008). Earthquakes with a mag-nitude ofM>5 in between 1973 and 2009 are depicted in Fig. 4. The Seismic hazard map is shown in Fig. 5 (USGS, 2009).
Table 1. Major earthquakes in Pakistan.
Date Died People Affected People Damage ($)
31/5/1935 35 000 – N/A
27/10/1945 4000 – N/A
28/12/1974 4700 – 3 million
31/01/1991 5000 – N/A
8/11/2005 73 338 2 869 142 5 billion
29/11/2008 200 40 000 N/A
3 Damage pattern
The majority of the existing buildings in the region have not been designed to withstand earthquakes. Most of them are typically unreinforced masonry low-rise buildings and have been exiguously designed. This structural type is ubiquitous all over the region. Heavy damages and collapses after earth-quakes demonstrated the vulnerability of such unreinforced masonry buildings.
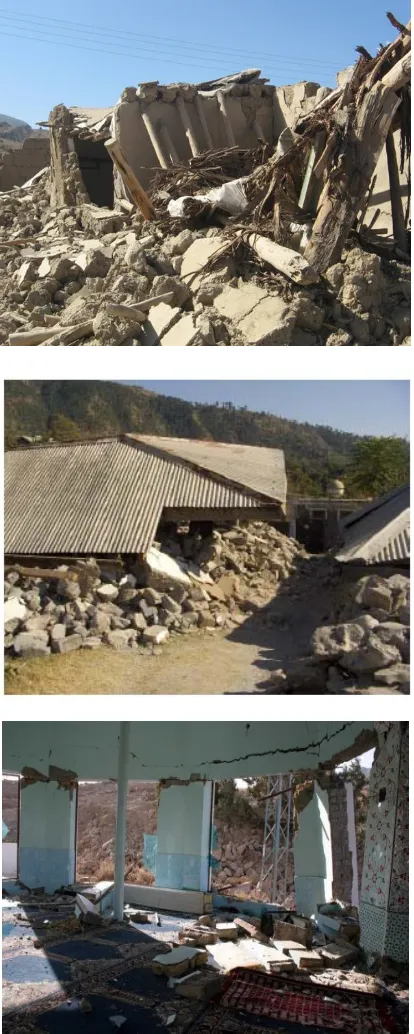
The buildings which have received the most severe dam-age in the recent earthquakes are mostly unreinforced stone, concrete block, and masonry buildings (see Fig. 6). Fig-ure 6 shows some example buildings suffering such damage (Naseer et al., 2007; Khan and Khan, 2008). Performances of stone masonry schools, colleges, universities, old hospi-tals and official buildings were very bad during the earth-quakes. Old age, poor construction and materials, and im-proper design were among the main factors for bad perfor-mance. Damages suffered by the masonry buildings could be explained by diagonal shear failure, combined in and out-plane effects, flexure failure of pier, failure of building cor-ners, separation of orthogonal walls, damages at walls and failure of external masonry and parapet walls (Amjad et al., 2007).
In the region, the construction application is based on ex-periments performed by contractors. In general, the stone masonry buildings have the light weight wooden roof trusses instead of a roof or floor diaphragm to brace the walls. There-fore, the walls are allowed to span horizontally to perpendic-ular walls that are less likely to withstand an earthquake. The spacing between walls is wider (Green, 2007; Tolles et al., 2000).
K. A. Korkmaz: Seismic safety assessment of unreinforced masonry low-rise buildings 1023
20 Figure 2. Map of Pakistan and Location of Ziarat
Fig. 2. Map of Pakistan and Location of Ziarat.
21 Figure 3. Seismic Hazard Map of Pakistan (GSP)
Fig. 3. Seismic Hazard Map of Pakistan (GSP, 2009).
1024 K. A. Korkmaz: Seismic safety assessment of unreinforced masonry low-rise buildings
22 Figure 4.Recent Earthquakes with the Magnitude (M>5) in Pakistan and its neighbourhood (USGS)
Fig. 4. Recent Earthquakes with the Magnitude (M>5) in Pakistan and its neighbourhood (USGS, 2009).
edition of the Pakistan Building Code, which contains rec-ommendations for detailed seismic design, is now in use in the entire country. The new code is mostly based on the 1997 edition of the Uniform Building Code.
4 Seismic assessment
There are two main seismic assessment approaches, namely deterministic and probabilistic. The deterministic based seis-mic assessment is comparatively simple and does not ac-count for the uncertainties and probability of occurrence of an earthquake. For accurate deterministic seismic assess-ment, it is recommended that related long term ground mo-tion data should be used in the analyses. However, this type of data is lacking or limited for most regions. A similar situ-ation of lack of sufficient data also exists for this region (Lisa et al., 2005). For such cases, probabilistic based seismic as-sessments are more reliable. Probabilistic based assessment is denoted by the probability of seismic intensities exceeding a particular value within a specified time interval. In prob-abilistic based seismic assessment, the seismic vulnerability assessment is explained by a recurrence relationship, defin-ing the cumulative number of events per year versus their magnitude. Analyses for different sites can be used to gen-erate hazard curves which define seismicity of the region. In seismic assessment, seismic hazard assessment is used for the determination of the seismic ground motion of the region; seismic safety assessment is used for explaining the seismic vulnerability of the buildings.
23
Figure 5.Seismic Hazard Mapfor Pakistan (USGS)
Fig. 5. Seismic Hazard Map for Pakistan (USGS, 2009).
4.1 Seismic hazard assessment
Seismic hazard assessment can be explained in two ways, pre- and post- evaluations. Pre-evaluation is done immedi-ately following an earthquake. Rapid visual assessment is one of the important tools for a fast evaluation. The method-ology provided in HAZUS is a post evaluation model that can be applied in regions that are at risk of earthquake disas-ter. For long-term evaluation, detailed post-earthquake eval-uation is done to consider the structural damage. Long term evaluation includes nonlinear based performance evaluation analyses.
HAZUS methodology generates estimates of the conse-quences to a city or region due to a scenario earthquake. A scenario earthquake could be a specified earthquake with magnitude and location. The evaluation methodology con-sists of three basic steps (Korkmaz, 2009; Schneider and Schauer 2005).
1. Study region definition: definition of the region, selec-tion of the applicaselec-tion area, and selecselec-tion of the appro-priate data from the earthquakes.
2. Hazard characterization: definition of the earthquake hazard, hazard type and source, fault type, and earth-quake location.
3. Damage and loss estimation: social and economic loss estimation, structural hazard estimation.
K. A. Korkmaz: Seismic safety assessment of unreinforced masonry low-rise buildings 1025
24
Figure 6. Various damages after the earthquake (Naseer et al, 2007; Khan and Khan, 2008)
Fig. 6. Various damages after the earthquake (Naseer et al., 2007;
Khan and Khan, 2008).
than 17 years ago in the US. It is a state-of-art decision sup-port tool for assessing disasters. Capabilities in HAZUS in-clude earthquake, flood and hurricane hazard characteriza-tion, building, essential facilities damage analysis, comput-ing direct economic losses and secondary hazards (FEMA, 1999).
However, HAZUS is not ready for use in Pakistan and its neighbourhood. National and district boundaries and char-acterization of the earthquake data used in HAZUS are cur-rently only available for the US. HAZUS can be used to pro-vide a starting point for the development of a disaster risk as-sessment tool which could be used in Pakistan and its neigh-bourhood considering user requirements and data availability (FEMA, 1999).
4.2 Seismic safety assessment
In the study, seismic safety assessment was used for evalua-tion of buildings. Buildings were evaluated using nonlinear analyses. There are various different methodologies avail-able in the literature for modelling and nonlinear analyses (Agbabian, 1984; Bruneau, 1994; Kim and White, 2004; Lam et al, 2003; Mistler et al, 2006; Moon et al, 2006; Priestly, 1985; Sucuoglu and Erberik, 1992; Vera et al, 2008; Yi et al, 2006).
Since the concern is unreinforced masonry buildings for the region, the evaluation of the seismic behaviour of unrein-forced masonry buildings requires specific procedures. The masonry buildings’ response to dynamical loads often differs substantially from those of ordinary buildings. In order to obtain a reliable estimation of the seismic risk, it is desirable to perform full dynamic analyses that describe the effective transmission and dissipation of the energy coming from the ground motion into the building (Pena et al., 2007).
Probabilistic seismic safety assessment for unreinforced masonry buildings is currently available from HAZUS, a seismic loss estimation framework developed by the Federal Emergency Management Agency (FEMA, 1999). HAZUS uses a systematic approach for probabilistic damage assess-ment of buildings, in which building response is character-ized by building capacity curves and seismic hazard is rep-resented by demand spectra for example, capacity spectrum method (Park, 2009).
Defining seismic risk is the first important step of proba-bilistic based assessments. Probaproba-bilistic based assessments consider probabilistic parameters and variables. FEMA pro-poses performance based procedures. The procedures do not consider probabilistic variables. In the processes, building performance and levels of damage to structural components are considered. Building performance or damage levels are specified as a function of the maximum drift the building sus-tains during an earthquake (FEMA, 2000; Park et al, 2009).
For unreinforced masonry buildings, three performance levels are defined in FEMA 356 as Collapse Prevention, Life Safety, and Immediate Occupancy. HAZUS defines four damage levels as Slight, Moderate, Extensive, and Complete Damages. The procedure does not consider probabilistic variables. HAZUS uses the maximum drift ratio as the dam-age measure following FEMA 356, and the threshold values of the maximum drift ratio corresponding to the limit states
1026 K. A. Korkmaz: Seismic safety assessment of unreinforced masonry low-rise buildings
Table 2. Material properties.
Modulus of Poisson Density
Material Elasticity (Mpa) Ratio kN/m3
Regional Masonry
Stone Material 26 000 0.2 25
are defined based on comprehensive review of past studies on seismic building damage (FEMA, 1999, 2000; Park, 2009).
In the study, seismic safety of unreinforced masonry low-rise buildings in Pakistan and its neighbourhood was investi-gated. Therefore, first, nonlinear time history analyses then probabilistic based assessment analyses were conducted for representative buildings. In the following section, modelling and analysis of the representative building are explained.
5 Seismic safety assessment of unreinforced masonry low-rise buildings in Pakistan and its neighbourhood
In the study, structural performances of unreinforced ma-sonry low-rise buildings in Pakistan and its neighbourhood were estimated through nonlinear time history analysis. Therefore, four different representative buildings were mod-elled and analyzed.
5.1 Modelling representative buildings
When modelling representative buildings two critical mod-elling issues should be considered: (a) representation of the real structural behaviour and (b) non-linear material relation-ships. Masonry consists of mainly unit element and mortar. Most common unit elements are brick and stone. Mortar is used for connecting the units. Compressive, tensile and shear strength, durability, water absorption coefficient and thermal expansion affect the load bearing capacity of masonry. Ma-sonry buildings include blocks connected by mortar joints that are geometrically complex and reflected in the compu-tational effort needed. Modelling of joints is specifically im-portant, since the sliding at joint level often starts the crack propagation. Mortar joints in masonry buildings cause the masonry to be anisotropic. Two different approaches have been adopted to model such anisotropy: the “micro-model” or “two-material approach” and the macro-model. In both models, the discretization follows the actual geometry of both the blocks and mortar joints, adopting different consti-tutive models for the two components.
Strength of stone masonry depends on the material prop-erties and bond materials used. The stone is massive and stiff. Type and thickness of mortar is more effective on the compressive strength of stone masonry than stone units. The strength of stone does not have much effect on stone ma-sonry. The joint behaviour of unit and mortar determines the
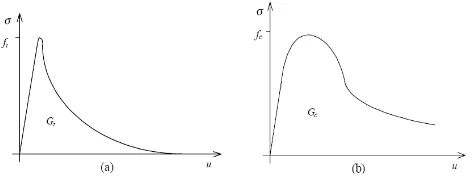
25 Figure 7. Typical behaviour of quasi-fragile materials under uniaxial loading and definition of the fracture energy a) tension loading b) compression loadingFig. 7. Typical behaviour of quasi-fragile materials under uniaxial(Alvarenga 2002).
loading and definition of the fracture energy (a) tension loading (b) compression loading (Alvarenga, 2002).
strength of stone masonry. If the mortar strength is weaker than units, masonry strength primarily depends on the mor-tar strength. The shear strength of the stone masonry is ap-proximately 25% of the compressive strength (Unay, 2002; Lourenco, 1998).
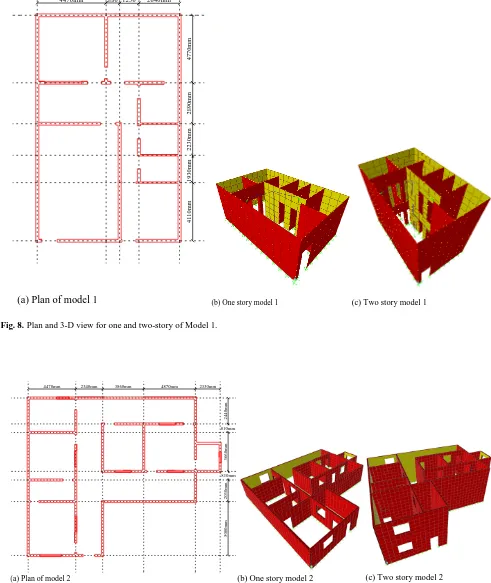
To demonstrate the construction type and determine a path for seismic safety assessment for the region, four different representative buildings were modelled similar to the real examples. The existing building types in the region were adopted from the literature and real examples (Naseer et al., 2007). Models shown in Figs. 8 and 9 were nonlinearly in-vestigated via nonlinear time history analyses (Wilson and Habibullah, 1998). As depicted in Figs. 8 and 9, the plan areas of typical masonry buildings in the region are close to these values. Material properties are given in Table 2. Ma-terial properties are defined according to the stone masonry material which is commonly used for construction in the re-gion. Masonry constructions subjected to seismic events can present damping ratios around 8%–10% (Rivera, 2008). In the present study, damping ratio was taken as 8%.
5.2 Seismic safety assessment of representative buildings
K. A. Korkmaz: Seismic safety assessment of unreinforced masonry low-rise buildings 1027
26
4470mm 880 2640mm
4770mm
289
0mm
2
230mm
1
930mm
411
0mm
1250
(a) Plan of model 1
(b) One story model 1 (c) Two story model 1
Figure 8. Plan and 3-D view for one and two-story of Model 1
26
4470mm 880 2640mm
4770mm
289
0mm
2
230mm
1
930mm
411
0mm
1250
(a) Plan of model 1
(b) One story model 1 (c) Two story model 1
Figure 8. Plan and 3-D view for one and two-story of Model 1
26
4470mm 880 2640mm
4770mm
289
0mm
2
230mm
1
930mm
411
0mm
1250
(a) Plan of model 1
(b) One story model 1 (c) Two story model 1
Figure 8. Plan and 3-D view for one and two-story of Model 1
Fig. 8. Plan and 3-D view for one and two-story of Model 1.
27
4470mm 2540mm 3860mm 4870mm 2330mm
5
080
mm
203
0mm
810mm
36
60
mm
810mm
24
40mm
(a) Plan of model 2
(b) One story model 2 (c) Two story model 2
Figure 9. Plan and 3-D view for one and two-story of Model 2
27
4470mm 2540mm 3860mm 4870mm 2330mm
5
080
mm
203
0mm
810mm
36
60
mm
810mm
24
40mm
(a) Plan of model 2
(b) One story model 2 (c) Two story model 2
Figure 9. Plan and 3-D view for one and two-story of Model 2
27
4470mm 2540mm 3860mm 4870mm 2330mm
5
080
mm
203
0mm
810mm
36
60
mm
810mm
24
40mm
(a) Plan of model 2
(b) One story model 2 (c) Two story model 2
Figure 9. Plan and 3-D view for one and two-story of Model 2
Fig. 9. Plan and 3-D view for one and two-story of Model 2.
1028 K. A. Korkmaz: Seismic safety assessment of unreinforced masonry low-rise buildings 28 1-story-Model1 0 1000 2000 3000 4000 5000 6000 7000 8000
0 500 1000 1500 2000 2500 3000
Displacement (mm) B ase S h ear ( kN )
(a) One story Model 1
2-story-Model1 0 5000 10000 15000 20000 25000 30000
0 500 1000 1500 2000
Displacement (mm) B a se S h ea r ( k N )
(b) Two story Model 1
0 20 0 40 0 60 0 80 0 10 00
1 2 3 4 5 6 7 8 9 10 11 12 13 14 15 16 17 18 19 20
21 22 23 24 25 26 27 28 29 30 31 32 33 34 35 36 37 38 39 40
41 42 43 44 45 46 47 48 49 50 51 52 53 54 55 56 57 58 59 60
Figure 10. Time History Analysis Results For Model 1
28 1-story-Model1 0 1000 2000 3000 4000 5000 6000 7000 8000
0 500 1000 1500 2000 2500 3000
Displacement (mm) B ase S h ear ( kN )
(a) One story Model 1
2-story-Model1 0 5000 10000 15000 20000 25000 30000
0 500 1000 1500 2000
Displacement (mm) B a se S h ea r ( k N )
(b) Two story Model 1
0 20 0 40 0 60 0 80 0 10 00
1 2 3 4 5 6 7 8 9 10 11 12 13 14 15 16 17 18 19 20
21 22 23 24 25 26 27 28 29 30 31 32 33 34 35 36 37 38 39 40
41 42 43 44 45 46 47 48 49 50 51 52 53 54 55 56 57 58 59 60
Figure 10. Time History Analysis Results For Model 1 28
1-story-Model1 0 1000 2000 3000 4000 5000 6000 7000 8000
0 500 1000 1500 2000 2500 3000
Displacement (mm) B ase S h ear ( k N )
(a) One story Model 1
2-story-Model1 0 5000 10000 15000 20000 25000 30000
0 500 1000 1500 2000
Displacement (mm) B a se S h ea r ( k N )
(b) Two story Model 1
0 20 0 40 0 60 0 80 0 10 00
1 2 3 4 5 6 7 8 9 10 11 12 13 14 15 16 17 18 19 20
21 22 23 24 25 26 27 28 29 30 31 32 33 34 35 36 37 38 39 40
41 42 43 44 45 46 47 48 49 50 51 52 53 54 55 56 57 58 59 60
Figure 10. Time History Analysis Results For Model 1
Fig. 10. Time history analysis results for Model 1.
developed based on analysis results and simplified proba-bilistic modelling. For each building, the mean and standard deviation values of these maximum drifts were assumed as parameters of normal distribution functions. According to Cornell et al., a log-normal distribution for the statistical de-scription of the building response would be a reasonable as-sumption (Cornell et al., 2002). By using the distribution functions, probability of exceeding the different drift levels was computed for each model (Park et al., 2009). These dis-tribution functions gave the probabilistic drift demand curves (see Fig. 12). Using these drift demand curves, probability of exceeding different displacement capacity thresholds (dis-placement limits) chosen from dis(dis-placement capacity curves for each model were estimated.
29 1-story-Model2 0 2000 4000 6000 8000 10000 12000
0 200 400 600 800 1000
Displacement (mm) Ba s e S h e a r (k N)
(a) One story Model 2
2-story-Model2 0 5000 10000 15000 20000 25000 30000 35000
0 200 400 600 800 1000
Displacement (mm) B as e S h ear ( k N )
(b) Two story Model 2
0 20 0 40 0 60 0 80 0 10 00
1 2 3 4 5 6 7 8 9 10 11 12 13 14 15 16 17 18 19 20
21 22 23 24 25 26 27 28 29 30 31 32 33 34 35 36 37 38 39 40
41 42 43 44 45 46 47 48 49 50 51 52 53 54 55 56 57 58 59 60
Figure 11. Time History Analysis Results For Model 2 29
1-story-Model2 0 2000 4000 6000 8000 10000 12000
0 200 400 600 800 1000
Displacement (mm) Ba s e S h e a r (k N)
(a) One story Model 2
2-story-Model2 0 5000 10000 15000 20000 25000 30000 35000
0 200 400 600 800 1000
Displacement (mm) B a s e S h ear ( k N )
(b) Two story Model 2
0 20 0 40 0 60 0 80 0 10 00
1 2 3 4 5 6 7 8 9 10 11 12 13 14 15 16 17 18 19 20
21 22 23 24 25 26 27 28 29 30 31 32 33 34 35 36 37 38 39 40
41 42 43 44 45 46 47 48 49 50 51 52 53 54 55 56 57 58 59 60
Figure 11. Time History Analysis Results For Model 2
Fig. 11. Time history analysis results for Model 2.
0,00 0,10 0,20 0,30 0,40 0,50 0,60 0,70 0,80 0,90 1,00
0 10 20 30 40 50 60
Drift Demand (cm)
E x ce ed en ce Pr o b a b ility Model1 1Story Model1 2Story Model2 1Story Model2 2Story
Figure 12. Probabilistic Seismic Safety Assessment
Fig. 12. Probabilistic seismic safety assessment.
K. A. Korkmaz: Seismic safety assessment of unreinforced masonry low-rise buildings 1029
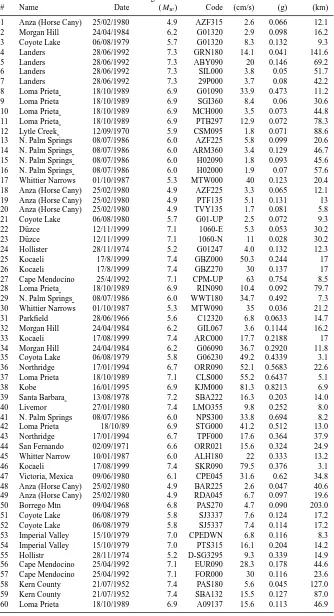
Table 3. Earthquake data.
Magnittude PGV PGA Distance
# Name Date (Mw) Code (cm/s) (g) (km)
1 Anza (Horse Cany) 25/02/1980 4.9 AZF315 2.6 0.066 12.1
2 Morgan Hill 24/04/1984 6.2 G01320 2.9 0.098 16.2
3 Coyote Lake 06/08/1979 5.7 G01320 8.3 0.132 9.3
4 Landers 28/06/1992 7.3 GRN180 14.1 0.041 141.6
5 Landers 28/06/1992 7.3 ABY090 20 0.146 69.2
6 Landers 28/06/1992 7.3 SIL000 3.8 0.05 51.7
7 Landers 28/06/1992 7.3 29P000 3.7 0.08 42.2
8 Loma Prieta 18/10/1989 6.9 G01090 33.9 0.473 11.2
9 Loma Prieta 18/10/1989 6.9 SGI360 8.4 0.06 30.6
10 Loma Prieta 18/10/1989 6.9 MCH000 3.5 0.073 44.8
11 Loma Prieta 18/10/1989 6.9 PTB297 12.9 0.072 78.3
12 Lytle Creek 12/09/1970 5.9 CSM095 1.8 0.071 88.6
13 N. Palm Springs 08/07/1986 6.0 AZF225 5.8 0.099 20.6 14 N. Palm Springs 08/07/1986 6.0 ARM360 3.4 0.129 46.7 15 N. Palm Springs 08/07/1986 6.0 H02090 1.8 0.093 45.6 16 N. Palm Springs 08/07/1986 6.0 H02000 1.9 0.07 57.6 17 Whittier Narrows 01/10/1987 5.3 MTW000 40 0.123 20.4 18 Anza (Horse Cany) 25/02/1980 4.9 AZF225 3.3 0.065 12.1 19 Anza (Horse Cany) 25/02/1980 4.9 PTF135 5.1 0.131 13 20 Anza (Horse Cany) 25/02/1980 4.9 TVY135 1.7 0.081 5.8
21 Coyote Lake 06/08/1980 5.7 G01-UP 2.5 0.072 9.3
22 D¨uzce 12/11/1999 7.1 1060-E 5.3 0.053 30.2
23 D¨uzce 12/11/1999 7.1 1060-N 11 0.028 30.2
24 Hollister 28/11/1974 5.2 G01247 4.0 0.132 12.3
25 Kocaeli 17/8/1999 7.4 GBZ000 50.3 0.244 17
26 Kocaeli 17/8/1999 7.4 GBZ270 30 0.137 17
27 Cape Mendocino 25/4/1992 7.1 CPM-UP 63 0.754 8.5
28 Loma Prieta 18/10/1989 6.9 RIN090 10.4 0.092 79.7
29 N. Palm Springs 08/07/1986 6.0 WWT180 34.7 0.492 7.3 30 Whittier Narrows 01/10/1987 5.3 MTW090 35 0.036 21.2
31 Parkfield 28/06/1966 5.6 C12320 6.8 0.0633 14.7
32 Morgan Hill 24/04/1984 6.2 GIL067 3.6 0.1144 16.2
33 Kocaeli 17/08/1999 7.4 ARC000 17.7 0.2188 17
34 Morgan Hill 24/04/1984 6.2 G06090 36.7 0.2920 11.8
35 Coyota Lake 06/08/1979 5.8 G06230 49.2 0.4339 3.1
36 Northridge 17/01/1994 6.7 ORR090 52.1 0.5683 22.6
37 Loma Prieta 18/10/1989 7.1 CLS000 55.2 0.6437 5.1
38 Kobe 16/01/1995 6.9 KJM000 81.3 0.8213 6.9
39 Santa Barbara 13/08/1978 7.2 SBA222 16.3 0.203 14.0
40 Livemor 27/01/1980 7.4 LMO355 9.8 0.252 8.0
41 N. Palm Springs 08/07/1986 6.0 NPS300 33.8 0.694 8.2
42 Loma Prieta 18/10/89 6.9 STG000 41.2 0.512 13.0
43 Northridge 17/01/1994 6.7 TPF000 17.6 0.364 37.9
44 San Fernando 02/09/1971 6.6 ORR021 15.6 0.324 24.9 45 Whitter Narrow 10/01/1987 6.0 ALH180 22 0.333 13.2
46 Kocaeli 17/08/1999 7.4 SKR090 79.5 0.376 3.1
47 Victoria, Mexica 09/06/1980 6.1 CPE045 31.6 0.62 34.8 48 Anza (Horse Cany) 25/02/1980 4.9 BAR225 2.6 0.047 40.6 49 Anza (Horse Cany) 25/02/1980 4.9 RDA045 6.7 0.097 19.6
50 Borrego Mtn 09/04/1968 6.8 PAS270 4.7 0.090 203.0
51 Coyote Lake 06/08/1979 5.8 SJ3337 7.6 0.124 17.2
52 Coyote Lake 06/08/1979 5.8 SJ5337 7.4 0.114 17.2
53 Imperial Valley 15/10/1979 7.0 CPEDWN 6.8 0.116 8.3 54 Imperial Valley 15/10/1979 7.0 PTS315 16.1 0.204 14.2
55 Hollistr 28/11/1974 5.2 D-SG3295 9.3 0.339 14.9
56 Cape Mendocino 25/04/1992 7.1 EUR090 28.3 0.178 44.6 57 Cape Mendocino 25/04/1992 7.1 FOR000 30 0.116 23.6
58 Kern County 21/07/1952 7.4 PAS180 5.6 0.045 127.0
59 Kern County 21/07/1952 7.4 SBA132 15.5 0.127 87.0
60 Loma Prieta 18/10/1989 6.9 A09137 15.6 0.113 46.9
1030 K. A. Korkmaz: Seismic safety assessment of unreinforced masonry low-rise buildings
6 Conclusions
The present study investigates the seismic safety of common unreinforced masonry low-rise buildings in Pakistan and its neighbourhood, using different assessment and estimation approaches. Probabilistic based seismic safety assessment is processing of a combination of nonlinear analysis and proba-bilistic approach. Time history analyses were conducted with 60 different earthquake data (Table 3). According to time history analysis results, four different representative building models were evaluated. The analysis results show that there are significant amounts of displacements at the unreinforced masonry low-rise buildings. Analysis results indicate quite different responses of the representative buildings to earth-quakes. The non-linear time history analyses indicated that masonry buildings are susceptible to seismic damage that has higher displacements.
The results of the analyses are given in the figures. Ac-cording to analyses results, the studied types of unreinforced masonry low-rise buildings in Pakistan present higher dis-placements and shear forces that can cause damage or col-lapse. By using analysis results, seismic vulnerability of un-reinforced masonry low-rise buildings in the region was in-vestigated. Seismic safety of the investigated unreinforced masonry low-rise buildings is questionable.
There are many lessons learned from the recent earth-quakes. Based on these lessons, in the short and long term, measurements in seismic prone areas in Pakistan and its neighbourhood are essential. In conclusion, a detailed seis-mic safety assessment for all unreinforced masonry low-rise building types in the region is very important. The next step could be definition of strengthening of unreinforced masonry buildings via simplified and fast methodologies.
Edited by: M. E. Contadakis
Reviewed by: two anonymous referees
References
Agbabian, M. S., Barnes, S. B., and Kariotis, J. C.: Methodology for mitigation of seismic hazards in existing unreinforced ma-sonry buildings: The methodology, ABK-TR-08, National Sci-ence Foundation, Washington, DC, 1984..
Alvarenga R.: Theoritical and Experimental Analysis of Prestressed Composite Arch Structures with Shot Concrete, PhD Thesis, University of Sao Paulo, Sao Carlos, 2002.
ASC (Amateur Seismic Center): Global Seismic Hazard Assess-ment, online available at: http://asc-india.org, 2009.
Bruneau, M.: State-of-art report on the seismic performance of un-reinforced masonry buildings, J. Struct. Eng., 120(1), 230–251, 1994.
Cornell, C. A., Jalayer, J., Hamburger, O. R., and Foutch, D. A.: Probabilistic basis for 2000 SAC federal emergency management agency steel moment frame guidelines, J. Struct. Eng., 128(4), 526–533, 2002.
Green, M.: Engineering Research for Non-Engineered Buildings, NA Eng, V37, 1 Spring, 2007.
FEMA 1999: NIBS National Institute of Building Science.
HAZUS: Earthquake loss, estimation methodology, technical manual, Washington, DC, 1999.
FEMA 356, 2000: Prestandard and commentary for the seismic rehabilitation of buildings, Publication No. 356, Federal Emer-gency Management AEmer-gency, Washington DC, USA, 2000. GSP (Geological Survey of Pakistan): Tectonics Zones of Pakistan,
online available at: http://www.gsp.gov.pk/SeismicHazard.jpg, 2009.
Khan, H. and Khan, A.: Natural hazards and disaster management in Pakistan, 12 October 2008, online available at: http://mpra.ub. uni-muenchen.de/11052/, MPRA Paper No. 11052, 2008. Kim S. C. and White D. W.: Nonlinear analysis of a one-story
low-rise masonry building with a flexible diaphragm subjected to seismic excitation, Eng. Struct., 26, 2053–2067, 2004 Korkmaz, K. A: Earthquake disaster risk assessment and evaluation
for Turkey, Environ. Geol., 57, 307–320, 2009.
Lam, N. T. K., Griffith, M., Wilson, J., and Doherty, K.: Time-history analysis of URM walls in out-of-plane flexure, Eng. Struct., 25 743–754, 2003.
Lisa, M., Khwaja, A. A., Javed, M., Ansari, Y. S., and Qasim, J. M.: Seismic Hazard Assessment of Nw Himalyan Fold And Thrust Belt, Pakistan, Using Probabilistic Approach, Proc. Pak-istan Acad. Sci., 42(4), 287–295, 2005.
Lourenco, P. B.: Experimental and numerical issues in the
mod-elling of the mechanical behaviour of masonry, in:
Struc-tural Analysis of Historical Constructions, edited by: Roca, P., Gonz´alez, J. L., O˜nate, E., and Lourenc¸o, P. B., et al., 2nd CIMNE, Barcelona, 57–91, 1998.
Mistler, M, Butenweg, C., and Meskouris, K.: Modelling methods of historic masonry buildings under seismic excitation, J. Seis-mol., 10, 497–510, 2006.
Mitomi, H., Yamazaki, F., and Matsuoka, M.: Automated Detec-tion of Building Damage due to Recent Earthquakes Using Aerial Television Images, The 21st Asian Conference on Remote Sens-ing, 401–406, 2000.
Moon, F. L., Yi, T., Leon, R. T., and Kahn, L. F.: Recommen-dations for Seismic Evaluation and Retrofit of Low-Rise URM Structures, J. Struct. Eng., 132(5), 663–672, 2006.
Naseer, A., Khan, A. N., Hussain, Z., and Ali, M.: Building Code of Pakistan: Before And After The 8 October 2005 Kashmir Earth-quake, Sixth National Conference on Earthquake Engineering, 16–20 October 2007, Istanbul, Turkey, 2007.
Ozen, G. O.: Comparison of elastic and inelastic behaviour of his-toric masonry structures at the low load levels, MSc Thesis, Mid-dle East Technical University, Ankara, Turkey, 2006.
Park, J., Towashiraporn, P., Craig, J. I., and Goodno, B. J.: Seismic fragility analysis of low-rise unreinforced masonry structures, Eng. Struct., 31, 125–137, 2009.
Pena, F., Casolo, S., and Lourenc¸o, P. B.: Seismic analysis of ma-sonry monuments by an integrated approach that combines the finite element models with a specific mechanistic model, in: IX Conference on Computational Plasticity, edited by: O˜nate, E. and Owen, D. R. J., paper 235, Barcelona, 2007.
K. A. Korkmaz: Seismic safety assessment of unreinforced masonry low-rise buildings 1031
Rivera ,D., Meli, R., S´anchez, R., and Orozco, B.: Evaluation of the measured seismic response of the Mexico city Cathedral, Earth-quake Eng. Struc., 37, 1249–1268, 2008.
Schneider, P. and Schauer, B.: An earthquake risk assessment tool for Turkey, HAZTURK strategies for earthquake loss estimation program for Turkey, Istanbul, 2005.
Sucuoglu, H. and Erberik, A.: Performance Evaluation Of A Three-Storey Unreinforced Masonry Building During The 1992 Erzin-can Earthquake, Earthquake Eng. Struc., 26, 319–336, 1997. Tolles, E. L., Kimbro, E. E., Webster, F. A., and Ginell., W. S.:
Seismic Stabilization of Historic Adobe Structures. Final Report of the Getty Seismic Adobe Project, Los Angeles, Calif., Getty Conservation Institute, 2000.
Unay, A.: Earthquake Resistance of Historical Structures METU, Architecture Department, Ankara, Turkey, 2002.
USGS (United States Geological Survey): Earthquake Hazard Ass-esment Products and Tools, online available at: http://neic.usgs. gov, 2009.
Vera, C. O., Mc Verry, G. H., and Ingham, J. M.: Ground mo-tion records for time-history analysis of URM buildings in New Zealand – The North Island, NZSEE Conference Proceedings, p. 25, 2008.
Wilson, E. and Habibullah, A.: SAP 2000 Integrated Finite Ele-ment Analysis and Design of Structures Basic Analysis Refence Manual, Computers and Structures, Berkeley, California, USA, 1998.
Yi, T., Moon, F. L.; Leon, R. T., and Kahn, L. F.: Analyses of a Two-Story Unreinforced Masonry Building, J. Struct. Eng., 132(5), 653–662, 2006.
Zar´e, M, Karimi-Paridari, S., and Lisa, M.: An investigation on Balakot, Muzaffarabad (Pakistan) earthquake, 8 Oct. 2005, Mw 7.6; geological aspects and intensity distribution, J. Seismol., Springer Science and Business Media B.V., 2008.