www.nat-hazards-earth-syst-sci.net/9/43/2009/ © Author(s) 2009. This work is distributed under the Creative Commons Attribution 3.0 License.
and Earth
System Sciences
Study of tropical cyclone “Fanoos” using MM5 model –
a case study
S. Ramalingeswara Rao, K. Muni Krishna, and O. S. R. U. Bhanu Kumar
Department of Meteorology and Oceanography, Andhra University, India
Received: 24 June 2008 – Revised: 30 September 2008 – Accepted: 5 November 2008 – Published: 13 January 2009
Abstract. Tropical cyclones are one of the most intense weather hazards over east coast of India and create a lot of devastation through gale winds and torrential floods while they cross the coast. So an attempt is made in this study to simulate track and intensity of tropical cyclone “Fanoos”, which is formed over the Bay of Bengal during 5–10 December 2005 by using mesoscale model MM5. The simulated results are compared with the observed results of India Meteorological Department (IMD); results show that the cumulus parameterization scheme, Kain-Fritsch (KF) is more accurately simulated both in track and intensity than the other Betts-Miller (BM) and Grell Schemes. The reason for better performance of KF-1 scheme may be due to inclusion of updrafts and downdrafts. The model could predict the minimum Central Sea Level Pressure (CSLP) as 983 hPa as compared to the IMD reports of 984 hPa and the wind speed is simulated at maximum 63 m/s compared to the IMD estimates of 65 m/s. Secondly “Fanoos” development from the lagrangian stand point in terms of vertical distribution of Potential Vorticity (PV) is also carried out around cyclone centre.
1 Introduction
Tropical cyclones are one of the most intense weather hazards of all meteorological phenomena that form over the tropical oceans/seas. The development of cyclonic storms over the Bay of Bengal is accounts for about 7% of the global annual total number of tropical storms (Gray, 1968). These meteorological hazards, which formed during the period, October through December are highly devastating nature and causes loss of life and property damage, especially when they cross the coastal states of India and Bangladesh (De
Correspondence to: S. Ramalingeswara
Rao
last half decade, many of these NWP centers started using higher resolution models for tropical cyclone prediction to reduce errors associated with finite differencing (Dudhia, 1993) and for better representation of topographical features and sub-grid scale physical processes. Observations to date have generally been inadequate to capture mesoscale aspects of the genesis stage of tropical cyclones except for brief glimpses during the process. Experiments such as the tropical experiment in Mexico (Bister and Emanuel, 1997) and Tropical Cyclone Motion Experiments TCM-92 (Ritchie and Holland, 1997) and TCM-93 (Harr et al., 1996a and b) over the Western Pacific Ocean are some recent examples. All of these studies suggest the importance of a preexisting large-scale disturbance that organizes convection and an importance of lower-tropospheric cyclonic PV anomalies that form within the organized convection. One such vortex appears to make a transformation to warm core and form the seed of the tropical cyclone. Simulations of the genesis phase, fully in three dimensions with domains large enough to capture both the evolving meso and synoptic scales and the inner core dynamics, do not exist. Zhang and Bao (1996) produced a marginal tropical storm in 90-h integration, but their resolution (25-km grid spacing) is too coarse to capture the inner structure of the storm. Several recent papers have dealt with the topic of the formation of tropical depressions and tropical storms as an amalgamation of diabatically produced PV maxima in the lower and middle troposphere. Easterly waves (Reed, 1979), the monsoon trough in the Western Pacific Ocean (Simpson et al., 1997), and extra-tropical troughs in the upper troposphere (Riehl, 1954; Molinari and Vollaro, 1989; DeMaria et al., 1993; Montgomery and Farrell, 1993; Molinari et al., 1998) are all thought to provide favorable environments for producing multiple cloud clusters and associated PV anomalies, which can merge and intensify into a nascent tropical cyclone. Observational evidence that a merger process is important comes from Harr et al. (1996a and b) and Ritchie and Holland (1997), who examined Western Pacific systems. Organized latent heating and the generation of multiple PV anomalies on the mesoscale appears to involve background synoptic scale upward motion (Simpson et al., 1997), but the mechanisms producing widespread weak ascent are varied. Wang and Seaman (1997) conducted a comparison study of four convection schemes towards simulation of six precipitation events over continental US. Simultaneously a fairly comprehensive review of tropical cyclone simulations was found in Liu et al. (1997); they even did not simulate tropical storm genesis because their study of tropical cyclone ‘Andrew’ began after the disturbance had reached tropical storm strength. All high-resolution (less than 20-km grid spacing) studies have had to employ a bogusing scheme to initialize a vortex, and in simulations of observed cases, the initial vortex is usually of tropical storm strength. Thus, the imposed initial disturbance is capable of self-amplification, so the question of how this disturbance originates is not
addressed. Braun and Tao (2000) presented a comparison study of four PBL parameterization schemes in simulation of hurricane “Bob” (1991) using MM5 model.
The purpose of this study is to evaluate the influence of the choice of cumulus parameterization schemes in MM5 model to predict “Fanoos” cyclone track, which form over the Bay of Bengal affecting the weather over Tamilnadu region during Northeast Monsoon (NEM) season of 2005 and its features, with an emphasis on the accuracy of predicted rainfall amounts in terms of spatial and temporal distributions.
2 Synoptic description of tropical cyclone “Fanoos” (2005)
cyclonic storm “Fanoos” laid centred 500 km east-south-east of Chennai on 9 December morning and widespread rains are likely to occur along the coasts of Tamilnadu and south Andhra Pradesh. On 10 December 03:00 UTC the SCS further moved in a westward direction and weakened into a cyclonic storm centered within half a degree 10.5◦N and 80.0◦E about 100 km southeast of Nagapattanim. On same day at 12:00 UTC CS further moved westward direction and weakened into deep depression at 10.5◦N and 79.7◦E and Annamalai Nagar received the highest rainfall of 56.6 mm, followed by Chidambaram 53 mm, Kattumannarkoil and Sethiathope 50 mm each, Lalpettai 44 mm, and Cuddalore and Srimushnam 40 mm each. On 11 December at 03:00 UTC deep depression further moved in a westward direction and crossed at Tamilnadu coast near Vedaranyam and weakened into depression over south Tamilnadu region. On 11 December 06:00 UTC depression further weakened into low pressure causing heavy to very heavy rain/thunder shower activity occurred over south coastal Tamilnadu and neighbourhood (Fig. 1).
Cyclone Fanoos has the potential to cause widespread severe to localised devastating flooding across the area in and around where it comes ashore including areas of northern Sri Lanka and coastal Tamilnadu state. This includes storm surge flooding, continued flooding of large area rivers and flash-flooding in hill areas. Chennai’s two main rivers, the Adyar and Cooum continue at or near flood stage in many areas throughout the city and in rural areas. Thus any additional heavy rain in and around Chennai has the potential to make the situation much worse. Gale force wind speed reaching 70–80 kmph are likely along and off Tamilnadu coast between Tondi and Pondicherry damaging hatched huts, breaking of tree branches causing minor damage to power and communication lines. Squally winds with speed reaching 50–60 kmph also likely along and off rest Tamilnadu and south Andhra Pradesh coasts. Storm surge of 1–2 m above astronomical tide occur around the point of landfall inundating low lying areas. State of sea is high to very high along and off Tamilnadu coast between Tondi and Pondicherry and rough to very rough along and off rest Tamilnadu and south Andhra Pradesh coasts. Topography of the point of landfall forced tropical cyclone “Fanoos” to smash its underbelly against the island mass of Sri Lanka, letting open a pressure valve on the left flank and sparing the adjoining south Tamilnadu coast collateral damage.
3 Model description and initial conditions
The non-hydrostatic version of the MM5 modeling system developed at Pennsylvania State University (PSU)/National Center for Atmospheric Research (NCAR) by Anthes, Warner, Ying-Hwa, Kuo and their colleagues is used in this study to simulate one Bay of Bengal cyclone “Fanoos” during NEM season. It is movable, triply nested grid, 3-D
Fig. 1. The bane of west Chennai: The Virugambakkam canal
overflows into adjacent areas such as Sai Nagar.
mesoscale model (Dudhia, 1993; Grell et al., 1995). The non-hydrostatic version employs the same terrain-following “s” coordinate as in the hydrostatic version of the model (i.e., MM4; Anthes et al., 1987), but the pressures at the “σ” levels are determined from a reference state that is estimated using the hydrostatic equation from a given sea level pressure and temperature with a standard lapse rate. There are 24 uneven “σ” levels or 23 “σ” layers (for all grid meshes) with higher resolution in the PBL.
Pressure perturbation p0, three velocity components
(u, v, w), temperature T and specific humidity q are the prognostic variables in non-hydrostatic version of the model. Model equations in the terrain following sigma co-ordinate are written in flux form and solved in Arakawa B grid. Leapfrog time integration scheme with time splitting technique is used in model integration. In time splitting technique, the slowly varying terms are integrated with longer time step and the terms giving rise to fast moving waves are integrated with shorter time step.
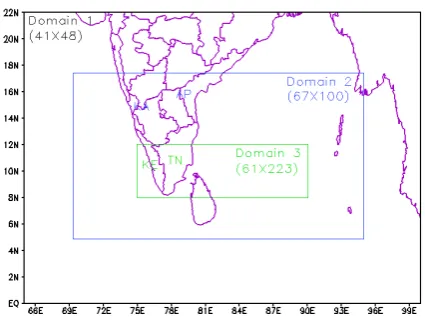
The most useful feature of MM5 model is its flexibility in terms of many options that are user specified and by setting these parameters to appropriate values, the model can be used for a wide range of applications. These include number of nests, type of convection, PBL and radiation parameterization schemes etc. Another advantage of this modeling system is that it is a state-of-the-art model and is under continuous development. A two-way interactive, movable, triply nested grid technique, based on monotonous interpolation (Smolarkiewicz and Grell, 1992), is employed to achieve the multiscale simulations. Figure 2 shows the three model domains used and Table 1 describes the domain design in this study.
Table 1. Domain design of the model.
Model Fifth generation Penn State/NCAR MEsoscale Model (MM5)
Dynamics Version 2.12
Main prognostic variables Non-hydrostatic with three-dimensional Coriolis force Map projection Mercator conformal mapping
Central point of the domain 14◦N, 84◦E
Horizantal grid distance 81 km, 27 km and 9 km Number of vertical levels 23 half sigma levels Horizantal grid system Arakawa B grid
Time integration scheme Leapfrog scheme with time-splitting technique Radiation parameterization scheme Cloud
PBL parameterization scheme MRF
Cumulus parameterization schemes KF, Grell and BM
Microphysics Simple Ice
Soil model Multi-layer soil model
Fig. 2. Domain configuration for MM5 simulations. Dimensions of
three domain (north-south by east-west).
radiation scheme, and the Kain-Fritsch cumulus scheme (Kain and Fritsch, 1993). The PBL scheme is a first-order closure scheme with vertical mixing dependent on stability and shear. In the unstable regime, instantaneous upward transfer of conserved variables occurs; attempting to mimic the effects of strong, large eddies. The NWP explicit microphysics scheme is a three category ice microphysics scheme (rainwater, snow, and graupel) designed to run efficiently. The Dudhia radiation scheme interacts with clouds but does no spectral decomposition beyond long and shortwave radiation. For a more detailed description of MM5, the authors are referred to Dudhia (1993) and Grell et al. (1995).
The authors of the present study adopt an interactive grid nesting approach as done in most other studies of tropical cyclones; use three domains (Fig. 2) with a grid spacing of 81, 27, and 9 km with domain sizes of 41×48, 67×100, and
61×223 grid points respectively. Each nest is free to feed back information to the next coarser domain (i.e. the domains are “two-way interactive”). A total of 37 terrain following coordinate surfaces are used as the vertical discretization. The top of the model is at about 90 hPa. A time step of 240 s is used on the coarsest grid (domain 1), reduced by a factor of three within each successive nest. The physical processes are the same on each domain, including use of the Kain-Fritsch cumulus scheme on the 9 km domain and found that the simulation is significantly improved (relative to observations) by including the Kain-Fritsch scheme at 9 km. However, for the maritime, tropical environment studied herein, it is possible that cumulus towers have a sufficiently small scale compared to the model grid that the use of a cumulus scheme is more appropriate.
The control simulation studied herein is initialized at 00:00 UTC 5 December 2005. Additional simulations show that this is the earliest time that adequate simulations may be initialized, so this time is chosen as it covers the entire spinup process. The NCEP FNL data is used as a first guess and for lateral boundary conditions.
The initial conditions for the three model domains have been interpolated from NCEP FNL data available at 1×1 degree resolution corresponding to 00:00 UTC of 5 December 2005. The model topography for the chosen domain regions is obtained from the USGS topography data. The intensity and position of the tropical cyclone “Fanoos” are taken from the reports on the IMD to compare with the model results. The observations of rainfall recorded at the coastal stations from the IMD and satellite derived 3B42RT merged precipitation product is also collected for comparison of model derived rainfall.
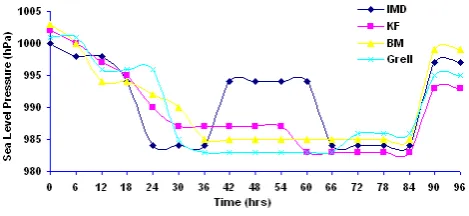
Fig. 3. Time variation of model simulated central sea level pressure
(hPa) along with the IMD estimates.
4 Results
4.1 The evaluation of kain-fritsch scheme in tropical cyclone simulation
The model derived CSLP distribution show the gradual intensification of the system during the first 2 to 3 days and then rapid intensification for about 24 h agreeing with the observations. However the rate of rapid intensification is underestimated and could not be predict truly.
The model could predict the minimum CSLP as 983 hPa as compared to the IMD reports of 984 hPa (Fig. 3) and the wind speed is simulated at maximum 63 m/s compared to the IMD estimates of 65 m/s (Fig. 4).
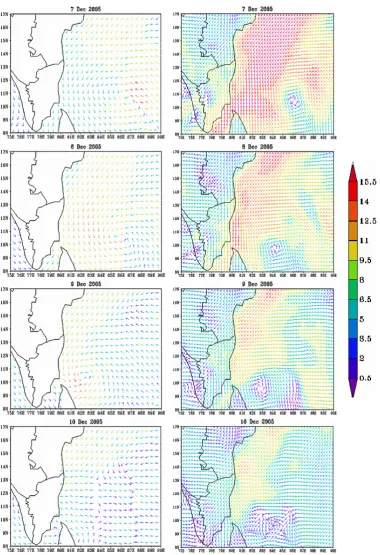
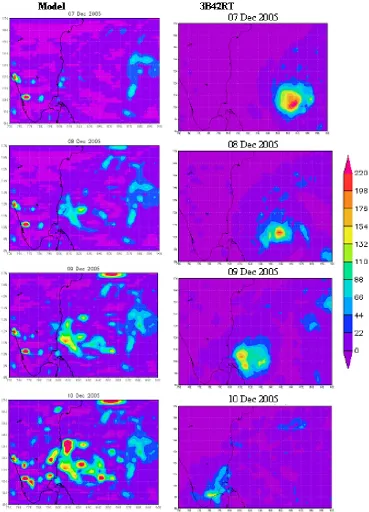
The results from the numerical experiments with KF convection scheme are analysed and compared with satellite derived products. The wind speeds at 10 m level from the model are compared with QuickSCAT winds (Fig. 5). The comparison shows that the satellite data give more intense wind near the eye wall than the model but the circulation wise both are shown in the same way. Similarly the model produced accumulated rainfall is compared with 3B42RT rainfall data (Fig. 6). The model derived rainfall shows reasonable estimates slightly more than the 3B42RT; real-time observations have limited to predict high rainfall intensity. The model predicted area of rainfall lag the 3B42RT location. The model simulates the formation of rainbands extending towards southeast, which indicates the model capability to simulate the meso-scale convective systems. The distributions of grid scale and sub grid scale rainfall indicate that grid scale rainfall is a major contributor for the rainfall over the cyclonic region.
Simulated features of the cyclone are compared with observed features of winds, pressure, rainfall and satellite cloud pictures. Results indicate that the model could fairly simulate the intensification (Fig. 3), movement and rainfall although little difference is seen as noticed from observations. The model-produced structure of the cyclone at the mature stage conforms to the previous findings. The simulated wind observations at lower and upper atmosphere, the vertical velocity in the middle atmosphere
Fig. 4. Time variation of model simulated wind speed (m/s) along
with the IMD estimates.
and vorticity fields at the lower and upper levels all support the intensification of the system. Converging cyclonic winds around the storm, developing winds at the upper troposphere, central warm core show the typical characteristic of a mature tropical storm. The track of the cyclone prediction based upon the initial condition of 5 December 2005 is shown (Fig. 7). The track based on the experimental run (FNL) was close to observations. The track predicted with the KF convection scheme is close to observational best fit IMD track when compared with other BM and Grell schemes. The difference in track prediction between the observed track and model simulated tracks are mainly due to the fact that there is an offset of around 150 km in the initial position between IMD data and model (NCEP-FNL) data. The Meteosat imagery shown at Fig. 8 depicts the characteristics of the cyclone at the time of crossing the coast at 03:00 UTC on 11 December. The present study indicates that the KF convection parameterization scheme gives reasonable prediction of convection associated with a development and movement.
4.2 Development of the cyclone from the lagrangian standpoint
Fig. 5. Comparison of wind speeds between model out put (domain -3) and QuickScat at 10 m level.
The model simulated cyclone structure shows core of cyclonic winds within 50–120 km radius and extending throughout the troposphere. A warm core extending from 3.5 km expanding outward up to 10 km is obtained.
Fig. 6. Comparison between model derived (domain -3) and satellite merged 3B42RT rainfall.
shows dryness at the center between 3.5 to 10 km levels surrounded by highly moist near saturated environment within the 220 km radius.
5 Conclusions
Fig. 7. Tracks of cyclone center for simulations and along with the
IMD observed storm track.
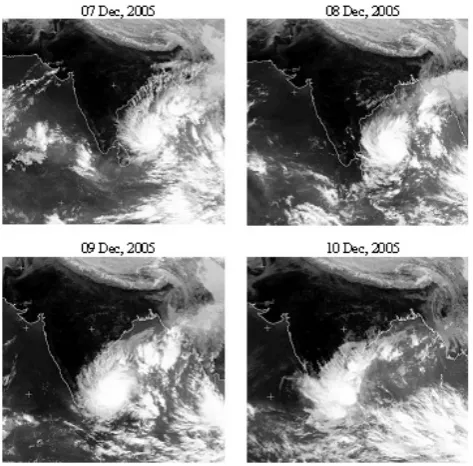
Fig. 8. Satellite imageries of tropical cyclone “Fanoos” during
07–10 December 2005.
The model is reasonably successful in simulating track and intensity of the storm up to 48 h. The performance of the model can be improved by better initial vortex specification (both local and intensity wise) of the storm. Radiation parameterization scheme also have perceptive input in model simulation of storm.
Fig. 9. Vertical distribution of nine-point averaged PV (PVU) of
the cyclone center.
The PV structure and inversion of the cyclogenesis over the south Bay of Bengal during 5–11 December 2005 is investigated with the PV framework. At early stages, the cyclogenesis is manifested by a lower-tropospheric PV anomaly over the south Bay of Bengal, mainly from latent heat release, which influences substantially the evolution of the low-tropospheric height and wind fields associated with the cyclone. At later stages, an upper tropospheric PV anomaly development results in the growth of upstream and downstream positive anomalies over the cyclone. Finally, much work remains to be done to adequately understand how a cumulus parameterization scheme interacts with other components in a numerical weather prediction model. Acknowledgements. The authors are thankful to the Department of Science and Technology, New Delhi, Government of India for their financial support for research (DST project No. ES/48/004/2004), NCAR MM5 team for providing model code and FNL data, Dundee Satellite receiving station, UK and IMD, New Delhi for supplying data. We also acknowledges to the reviewers for their constructive comments to improve the quality of the manuscript.
Edited by: L. Ferraris
References
Anthes, R. A. and Chang, S. W.: Response of the hurricane boundary layer to changes of sea surface temperature in a numerical model, J. Atmos. Sci., 35, 1240–1255, 1978. Anthes, R. A. and Chang, S .W.: Tropical cyclones: Their evolution,
structure and effects, Meteorol. Monogr. Ser., Am. Meteorol. Soc., Boston, MA, 19, 41, 208, 1982.
Anthes, R. A., Chang, S. W., Hsie, E.-Y., and Kuo, Y.-H. : Description of the Penn State/ NCAR mesoscale model version 4 (MM4), NCAR Tech. NoteNCAR/TN-282, 66 (Available from NCAR Publications Office, P. O. Box 3000, Boulder, CO 80307-3000), 1987.
Bayers, H. R.: General Meteorology, McGraw-Hill, 1–670, 1944. Bister, M. and Emanuel, K. A.: The genesis of Hurricane
Guillermo: TEXMEX analyses and a modeling study, Mon. Wea. Rev., 125, 2662–2682, 1997.
Braun S. A. and Tao, W.-K: Sensitivity of high-resolution simulations of hurricane Bob (1991) to planetary boundary layer parameterizations, Mon. Wea. Rev., 128, 3941–3961, 2000. De Angelis, D.: World of tropical cyclones – North Indian Ocean,
Mar. Weather Log., 20, 191–194, 1976.
DeMaria, M., Baik, J.-J., and Kaplan, J.: Upper-level eddy angular momentum fluxes and tropical cyclone intensity change, J. Atmos. Sci., 50, 1133–1147, 1993.
Dudhia, J.: Numerical study of convection observed during the winter monsoon experiment using a mesoscale two-dimensional model, J. Atmos. Sci., 46, 3077–3107, 1989.
Dudhia, J.: A nonhydrostatic version of the Penn State – NCAR mesoscale model: Validation tests and simulation of an Atlantic cyclone and cold front, Mon. Wea. Rev., 121, 1493–1513, 1993. Emanuel, K. A.: An air sea interaction theory for tropical cyclones. Part I: Steady-state maintenance, J. Atmos. Sci., 43, 585–604, 1986.
Emanuel, K. A. and Raymond, D. J.: The representation of cumulus convection in numerical models, Meteorol. Monogr. Ser., Am. Meteorol. Soc., Boston, MA, 46, 246, 1993.
Frank, W. M.: The cumulus parameterization problem, Mon. Wea. Rev., 111, 1859–1871, 1983.
Gray, W. M.: Global view of the origin of tropical disturbances and storms, Mon. Wea. Rev., 96, 669–700, 1968.
Grell, G. A., Dudhia, J., and Stauffer, D. R.: A description of the fifth generation Penn State/NCAR mesoscale model (MM5), NCAR Tech Note NCAR/TN-3981STR, 138 (Available from NCAR Publications Office, P. O. Box 3000, Boulder, CO 80307-3000), 1995.
Harr, P. A., Elsberry, R. L., and Chan, J. C. L. : Transformation of a large monsoon depression to a tropical storm during TCM-93, Mon. Wea. Rev., 124, 2625–2643, 1996a.
Harr, P. A., Elsberry, R. L., Chan, J. C. L., Kalafsky, M. S., and Elsberry, R. L.: Environmental conditions prior to the formation of a midget tropical cyclone during TCM-93, Mon. Wea. Rev., 124, 1693–1710, 1996b.
Hong, S.-Y. and Pan, H.-L.: Nocturnal boundary layer vertical diffusion in a medium-range forecast model, Mon. Wea. Rev., 124, 2322–2339, 1996.
Kain, J. S. and Fritsch, J. M.: Convective parameterization for mesoscale models: The KainFritsch scheme, in: The Representation of Cumulus Convection in numerical Models, K. Emanuel, edited by: Raymond, D. J., Amer. Meteor. Soc.,
Meteorological Monograph Series, 24, number 46, 1–246, 1993. Kuo, Y.-H., Bresch, J. F., Cheng, M.-D., Kain, J., Parsons, D. B., Tao, W.-K., and Zhang, D.-L.: Summary of a mimiworkshop on cumulus parameterization for mesoscale models, Bull.Am. Meteorol. Soc., 78, 475–491, 1997.
Liu, Y., Zhang, D.-L., and Yau, M. K.: A multiscale numerical study of Hurricane Andrew (1992). Part I: Explicit simulation and verification, Mon. Wea. Rev., 125, 3073–3093, 1997. McBride, J. L. and Zehr, R.: Observational analysis of tropical
cyclone formation, Part II: Comparison of nondeveloping versus developing systems, J. Atmos. Sci., 38, 1132–1151, 1981. Molinari, J. and Vollaro, D.: External influences on hurricane
intensity, Part I: Outflow layer eddy angular momentum fluxes, J. Atmos. Sci., 46, 1093–1105, 1989.
Molinari, J., Vollaro, D. and Dudek, M.: Parameterization of convective precipitation in mesoscale numerical models: A critical review, Mon. Wea. Rev., 120, 326–344, 1992.
Molinari, J., Vollaro, D., Dudek, M., Skubis, S., Vollaro, D., Alsheimer, F., and Willoughby, H. E.: Potential vorticity analysis of tropical cyclone intensification, J. Atmos. Sci., 55, 2632–2644, 1998.
Montgomery, M. T. and Farrell, B. F: Tropical cyclone formation, J. Atmos. Sci., 50, 285–310, 1993.
Reed, R. J.: Structure and behavior of easterly waves over West Africa and the Atlantic in: Meteorology over the Tropical Ocean, edited by: Shaw, D. B., Royal Meteorological Society, 57–71, 1979.
Riehl, R. J.: On the formation of typhoons, J. Meteor., 5, 247–264, 1948.
Riehl, R. J.: Tropical Meteorology, McGraw-Hill, 392, 1954. Ritchie, E. A. and Holland, G. J.: Scale interactions during the
formation of Typhoon Irving, Mon. Wea. Rev., 125, 1377–1396, 1997.
Ritchie, E. A. and Holland, G. J.: Scale interactions during the formation of Typhoon Irving, Mon. Wea. Rev., 125, 1377–1396, 1997.
Schultz, P.: An explicit cloud physics parameterization for operational numerical weather prediction, Mon. Wea. Rev., 123, 3331–3343, 1995.
Simpson, J., Ritchie, E., Holland, G. J., Halverson, J., and Stewart, S.: Mesoscale interactions in tropical cyclone genesis, Mon. Wea. Rev., 125, 2643–2661, 1997.
Smolarkiewicz, P. and Grell, G. A.: A class of monotone interpolation schemes, J. Comput. Phys., 101, 431–440, 1992. Wang, W. and Seaman, N. L.: A comparison study of convective
parameterization schemes in a mesoscale model, Mon. Wea. Rev., 125, 252–278, 1997.
Zhang , D. L., Kain, J. S., Fritsch, J. M., and Gao, K. : Comments on Parameterization of convective precipitation in mesoscale numerical models: A critical review, Mon. Wea. Rev., 122, 2222–2231, 1994.