Measuring Learners’ Attitudes
Toward Team Projects: Scale
Development Through Exploratory
And Confirmatory Factor Analyses
Seung Youn (Yonnie) Chyung, Boise State University, USA Donald J. Winiecki, Boise State University, USA
Gary Hunt, Boise State University, USA Carol M. Sevier, Boise State University, USA
ABSTRACT
Team projects are increasingly used in engineering courses. Students may develop attitudes toward team projects from prior experience, and their attitudinal responses could influence their performance during team project-based learning in the future. Thus, instructors need to measure students’ attitudes toward team projects during their learner analysis to better understand students’ characteristics and be proactive in providing effective strategies to help students succeed in a team project environment. The purpose of our study was to develop a survey instrument that measures students’ attitudes toward team projects to be used as a learner analysis tool, derived from our local practical needs and due to the lack of appropriate existing instruments. The study was conducted at a mid-sized university in the northwestern United States during 2015-2016. After we generated an initial pool of 50 items, we administered the survey to 225 undergraduate engineering students, performed exploratory factor analysis on the data, and arrived at a four-factor solution of 20 items and a three-factor solution of 14 items. We tested the two competing solutions with another set of 330 undergraduate engineering students. Based on our confirmatory factor analysis results, we arrived at a three-factor model of 12 items as the finalized scale, which measures: (a) professional capacity building, (b) learning and problem-solving skills development, and (c) workload challenges. We call the scale, the Attitudes toward Team Projects Scale on Capacity, Learning, and Workload (ATPS-CLW). Suggestions for future research include continuous development, testing, and validation of the scale.
Keywords: Attitudes Toward Team Projects; Team Project-Based Learning; Exploratory Factor Analysis; Confirmatory Factor Analysis
INTRODUCTION
and be better prepared to select and implement effective instructional strategies to help students successfully work in a team environment.
In this article, we will discuss the characteristics of team-based learning, the importance of understanding student attitudes toward team projects, and the need for developing a survey instrument that measures students’ attitudes toward team projects. Then, we will explain the process that we used to develop a survey instrument intended to measure student attitudes toward team projects, describe the results, and discuss the application of the survey instrument as a learner analysis tool.
THEORETICAL FRAMEWORK
Cooperative, Team-Based, Problem-Based Approach during Project-Based Learning
First, when we use the word team in this article, we refer to the context where individual members of a group have distinct responsibilities, aiming at producing a shared outcome such as a tangible product or a team project report (Fink, 2002). With that in mind, team-based learning assumes cooperative learning. Based on social interdependence theory, cooperative learning emphasizes that learners work or act together as one to achieve their common goal (Johnson, Johnson, & Smith, 2014; McInnerney & Roberts, 2004). Successful cooperative learning relies on learners’ perception of positive interdependence—learners perceiving that their work benefits others, and others’ work benefits them (Johnson & Johnson, 2004). Successful cooperative learning also depends on individual accountability (the performance of each member) as well as group [team] accountability (the overall performance of the group) (Johnson & Johnson, 2004; Johnson, Johnson, & Smith, 1991; Millis, 2014). Learners during cooperative learning exert considerably greater effort to achieve and experience greater social support than when they are in competitive or individual learning environments (Johnson & Johnson, 2004).
Cooperative, team-based learning often involves problem-based learning with authentic tasks. Started as an innovative educational approach used at a medical school, problem-based learning has earned popularity in various disciplines including engineering education, with slightly different approaches such as problem-focused learning, activity-focused learning, design-based learning, or case studies (Marra, Jonassen, Palmer, & Luft, 2014; Savin-Baden, 2014). The characteristics of problem-based learning include: learner-centered approaches, learning in small groups, teachers as facilitators or guides, focusing on real-world problems to solve, and self-directed learning (Barrows, 1996). Problem-based learning also enables learners to work on authentic tasks in a context reflecting the characteristics of the real-world professional practice. Authentic learning is considered to have the benefits of helping learners develop robust knowledge and better transfer their knowledge to real-world practice (Herrington, Reeves, & Oliver, 2014). Research has shown that engineering students who spent more time in cooperative education (co-op) programs (a form of experiential education that allows students to complement their classroom experiences with real work experience) rated their understanding of engineering problem-solving more highly than those who did not participate in such programs (Yin, 2009).
Benefits and Concerns with Team Project-Based Learning
The amount of literature discussing team-based learning has increased since the late 1990s (Haidet, Kubitz, & McCormack, 2014). In engineering education in particular, team-based learning environments have shown to produce positive outcomes such as improved self-efficacy (Schaffer, Chen, Zhu, & Oakes, 2012), design and professional skills (Pimmel, 2001), and interdisciplinary identities (McNair, Newswander, & Boden, 2011). Senior-level engineering capstone courses are often designed with team-based learning methods using industry client-based projects, which have shown to help students prepare for their engineering careers (Griffin et al., 2004; Todd et al., 1995). Additionally, engineering educators and researchers have been advocating the incorporation of team-based projects even in first-year classes to help students better acquire design skills and to improve student retention through the curriculum (Dym et al., 2005). However, some studies showed that engineering students who participated in cooperative learning did not outperform students in traditional lecture-based learning (Broyles, 1999) or individual learning (Moraga & Rahn, 2007). Other research has pointed out that sufficient time should be given to cooperative learning teams to mature in order for them to produce academic performance superior to that of students in an individualistic learning condition. For example, Hsiung (2012) revealed that students in teams did not start outperforming students in individual learning until the 3rd and 4th units of an 18-week, four-unit course.
Although team projects have potential to provide learners with the benefits of cooperative and authentic problem-based learning, they are not free of problems. The quality of team-problem-based learning may vary depending on the degree of authentic learning and cooperative learning, influenced by various factors. First, from the instructor’s standpoint, designing a course with team projects with highly authentic learning experiences is time-consuming, and it requires substantial commitment. Necessary resources including industry clients are not always available. From the students’ perspective, students may feel frustrated when they experience the “free rider” effect (social loafing) where some team members contribute little while benefitting from other members who do most of the work (Borrego et al., 2013; Griffin et al., 2004; Michaelsen & Knight, 2002). Collaboration without coordination is also a problem. During our teaching, we have also observed—what we call—the “Frankenstein effect” which illustrates that the final outcomes of team projects look as if pieces were brought in from different sources and put together without coordination. The free-rider and Frankenstein effects represent symptoms of ineffective teams.
Another concern is that cooperative learning does not happen automatically or immediately just because multiple learners are assigned to a team (Johnson & Johnson, 1999). Teamwork is developed through several stages from forming (testing and dependence) to storming (intragroup conflict), to norming (development of group cohesion) and performing (functional role-relatedness) (Tuckman, 1965). Effective teams often go through the first three of these stages quickly to arrive at the performing stage where they become effective at both learning and meeting their project goals. Unfortunately, some teams may have difficulty passing through the early stages and never come to fully function as an effective team. Intragroup conflicts might cause some teams to get stuck in the storming stage or to negatively influence the quality of their norming and performing stages. Research has shown that teams of engineering students who provided less peer support were among dysfunctional ineffective teams and also produced lower levels of academic performance (Hsiung, 2010).
Attitudes toward Team Projects
project experience, with some degree of positivity or negativity; they may express their attitudes affectively (feeling), cognitively (deciding), and/or behaviorally (acting on it).
Attitudes vary not only in valence (i.e., positive or negative, or supportive or hostile) but also in terms of the degree of favorability (i.e., strong or weak). Once individuals develop strong attitudes, their attitudes become fairly persistent over time, resistant to persuasive strategies for change, and reliable in predicting behavior (Favor & Harvey, 2016; Krosnick & Petty, 1995; Olson & Fazio, 2009), although some strong attitudes can be changed, as shown in religious conversion and political indoctrination (Eagly & Chaiken, 1993). Attitudes are often context-sensitive, as they are formed based on one’s past experience in certain circumstances. For example, engineering students who participate in team projects during their undergraduate program would likely develop different types of attitudinal responses toward team projects based on their experiences. For example, in one study (Alford et al., 2014), first-year engineering students’ perceptions of ‘fun and learning’ team projects decreased midway through the class likely due to unexpectedly intense and less-than-ideal team experiences. And then, their attitudes toward teamwork somewhat improved by the end of the second project, which is partially attributed to the fact that the second project was more exciting and perhaps because students were instructed to improve team behaviors. During our teaching, we have also observed students expressing both positive and negative comments about their experience with team projects and showing their excitement or hesitation toward team project experience (e.g., “I worked in a great team in my last team project class! I hope to find another great team in this class.” or “I really dislike working in a team. I almost dropped the team project course last semester. Can I work alone in this class?”). In such cases, students’ attitudinal responses can influence their performance in team settings during future courses or even in their future professional careers.
OVERALL RESEARCH PURPOSE
Although students in team settings are exposed to a lot of potential benefits associated with cooperative and authentic problem-based learning as discussed earlier, instructors cannot assume that the students’ attitudes toward team projects or team project-based learning are always as positive as hoped. According to the systematic instructional design process (e.g., Dick, Carey, & Carey, 2014), the step after identifying course goals is to analyze learners and learning context. Following this systematic instructional design principle, one of our instructional goals was to help students develop teamwork through team projects, and we had strong needs to measure students’ attitudes toward team projects specifically to better understand the characteristics of our learners. Measuring students’ attitudes toward team projects would also allow a better prediction of the individual students’ behaviors and better preparation of instructional interventions during team projects. These practical needs led us to a search for existing instruments that measure adult learners’ attitudes toward team projects.
Derived from our local practical needs and due to the lack of appropriate existing instruments, we decided to develop a learner analysis instrument that measures adults’ attitudes toward team projects through exploratory and confirmatory factor analyses. Our research goal was to develop an instrument that is useful in both school and workplace settings — we conducted this research in the context of higher education first, with plans to test the developed instrument at workplace settings in future research. We conducted our study in the College of Engineering at a mid-sized university in the northwestern region of the United States during 2015 and 2016. Our process included several phases – 1. Instrument development, 2. Exploratory factor analysis, 3. Confirmatory factor analysis, and 4. Instrument finalization. During the process, we followed the steps described in DeVellis’ (2012) guidelines in scale development:
1. Determine clearly what it is you want to measure 2. Generate an item pool
3. Determine the format for measurement (the response scale) 4. Have initial item pool reviewed by experts
5. Consider inclusion of validation items 6. Administer items to a development sample 7. Evaluate the items
8. Optimize scale length
For statistical procedures, we referred to multiple comprehensive sources on exploratory and confirmatory factor analyses, including Brown (2015), Byrne (2010), Fabrigar and Wegener (2012), Hair et al. (2010), and Tabachnick and Fidell (2014), as well as other published studies that employed exploratory and confirmatory factor analyses to develop survey instruments to measure constructs, such as engineering students’ contextual competence (Ro, Merson, Lattuca, & Terenzini, 2015), engineering self-efficacy (Marmaril, Usher, Li, Economy, & Kennedy, 2016), interpersonal communication skills (Wilkins, Bernstein, & Bekki, 2015), and K-12 teachers’ self-efficacy for teaching engineering (Yoon, Evans, & Strobel, 2014).
METHODS AND RESULTS
Instrument Development
Since we were clear that we wanted to measure students’ attitudes toward team projects (Step 1: Determine clearly what it is you want to measure), we moved on to Step 2: Generate an item pool. We used several sources to generate survey items. We conducted a literature review on theories and research regarding adult students’ attitudes toward team projects (e.g., Johnson & Johnson, 2004; Johnson, Johnson, & Smith, 1991; Johnson, Johnson, & Smith, 2006; Michaelsen, Knight, & Fink, 2002) and reflected on our decades-long experiences in teaching team-based courses. Then, we conducted an email-based open-ended survey with students, working practitioners, and university faculty members (n = 18) to obtain their perspectives. In the survey, we asked them to list five to ten statements that relate to their thoughts, feelings, and attitudes toward team projects, focusing on benefits or difficulties in completing team projects from a student’s perspective (if they are currently enrolled in a course), from a worker’s perspective (if they are not enrolled in a course, but active as practitioners in the workplace), or from an instructor’s perspective (if they are faculty members). Based on these sources, we developed an initial pool of 66 survey items. The initial pool of items should be considerably more than researchers plan to include in the final scale—in some cases, researchers may “begin with a pool of items that is three or four times as large as the final scale” and in other cases, “as small as 50% larger than the final scale” (DeVellis, 2012, p. 80). We did not pre-determine a specific number of items to be included in our final survey instrument, although we envisioned it (as a learner analysis tool) to be a relatively short, compared to lengthy (60-80 items) psychometric instruments. Thus, we considered 66 survey items to be an appropriate initial pool.
may appear somewhat lengthy. However, the use of this structure served our needs for gathering data during a learner analysis that would allow instructors to understand specific contexts of the team project environment associated with learners’ attitudes. We used a 7-point response scale (1-not true, 2-barely true, 3-slightly true, 4-moderately true, 5-considerably true, 6-mostly true, 7-very true) (Step 3: Determine the format for measurement). We chose to use an odd-numbered response scale (7-point) in order not to force respondents to choose an option from the positive or negative side of the scale. Unlike other Likert-type scales that use ‘neutral’ or ‘uncertain’ as a point, the mid-point on our response scale was labeled ‘moderately true.’
We emailed the survey items back to the 18 people who initially provided input and asked them to provide feedback on the following criteria: 1. if each item seems a valid measure of attitudes toward team projects, 2. if any items need to be revised to improve clarity or to be removed, and 3. if they want to suggest additional items. Seven of them responded with their comments. Three respondents were university faculty members who were knowledgeable in team-based learning—they served as experts to evaluate the clarity of the items as well as face validity (how relevant the items were to what we intended to measure) (Step 4: Have initial item pool reviewed by experts). We revised the initial pool of 66 survey items based on their feedback, and arrived at a 50-item survey.
Among the 50 items, 14 of them described negative aspects of team projects (e.g., “I’d rather work alone because it is difficult to find teammates who have a work ethic similar to mine”). Four of the negatively-worded statements were paired with four of the positively-worded statements—for example:
• “I learn a lot while completing a project with others” (positive) vs. “I do not learn much from my peers in a team project” (negative)
We intended to use the pairs of items as validation items to detect unengaged respondents as described in the Data Screening section below (Step 5: Consider inclusion of validation items). We developed a web-based survey with the 50 items using Qualtrics®. Step 6 (Administer items to a development sample), Step 7 (Evaluate the items) and Step 8 (Optimize scale length) of scale development guidelines are described in the following Exploratory Factor Analysis and Confirmative Factor Analysis sections.
Exploratory Factor Analysis
Purpose
Exploratory factor analysis (EFA) is appropriate when the goal of research is to create a measurement instrument that reflects a meaningful underlying latent dimension(s) or construct(s) represented in observed variables (Fabrigar & Wegener, 2012; Hair et al., 2010). In such context, researchers want to identify groups of variables, each of which has high correlations with only one factor, and to interpret and label each factor (Warner, 2008). We conducted EFA to develop a scale that measures adult students’ attitudes toward team projects. We intended to find out if the finalized scale was unidimensional or multidimensional, and if multidimensional, how many factors (dimensions) the instrument included and which items were grouped together as a factor.
Sample and Data Collection
In the web-based survey questionnaire, the respondents read a definition of a team project and the direction as follows:
A team project is defined as a type of work where two or more people share responsibility to complete a tangible outcome such as a report or a product while working together for two or more weeks. How do you think about, feel about, or approach team projects regarding benefits and problems associated with team projects? Please read each item below. Then, circle one of the numbers (from 1 to 7) that truly applies to you.
The respondents completed the 50 items with the 7-point response scale (1-not true, 2-barely true, 3-slightly true, 4-moderately true, 5-considerably true, 6-mostly true, 7-very true). We analyzed the data with SPSS v. 23.
Data Screening
We first checked for unengaged responses, using multiple methods. The Qualtrics system automatically records each respondent’s survey completion duration with a starting date/time and an ending date/time—we checked respondents who completed the survey in less than five minutes. We also checked respondents who marked all or most questions with the same option on the 7-point scale (by checking each case if its standard deviation is smaller than 0.5). We then compared the data obtained from four matching pairs of items describing positive and negative aspects of team projects to detect possible unengaged respondents. After screening data against these multiple criteria, we excluded ten unengaged respondents. Thus, we had a total of 225 data sets. The average age of the 225 respondents was 21.5 (std. dev. = 4.92). Table 2 compares the characteristics of the COEN population and the study participants in terms of gender, race/ethnicity, citizenship, and enrollment status (full-time and part-time).
We checked for normality of data and removed three items with high levels of both skewness and kurtosis (> |1.0|). Then, we checked for missing values. Only 21 values were missing across 14 items in 17 cases. We performed a missing data analysis and found that the 21 values were missing completely at random (Little's MCAR test: c2 = 692.03, df = 686, p = .428). We replaced the missing data values using the expectation maximization technique, which is “the simplest and most reasonable approach to imputation of missing data” that randomly occurred (Tabachnick & Fidell, 2014, p. 105).
Factorability Check
Then, we checked factorability of the 225 sets of data. The Keiser-Meyer-Olkin (KMO) Measure of Sampling Adequacy was .926, meeting the excellent-level threshold (above .90). More than 60% of correlation coefficient values among the items were greater than .30, and the Bartlett’s Test of Sphericity found that the correlations, collectively, were significant at the .001 level. All anti-image correlations (the KMO measures of individual variables) also fell in the acceptable range (above .50). These results indicated that the data set was appropriate for factor analysis (Tabachnick & Fidell, 2014).
EFA Process and Results
1. Developing professional capacity for the workplace (Capacity) 2. Improving learning and problem-solving skills (Learning) 3. Avoiding workload-related challenges (Workload) 4. Increasing persistence for better outcomes (Persistence)
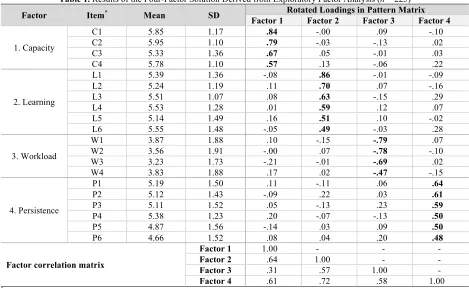
After we arrived at the four-factor solution, we double-checked if the multiple items of each factor are measuring the same factor (convergent validity), while the multiple factors are measuring distinct factors (discriminant validity). The size of factor loading can be used to indicate the degree of convergent validity of a model structure since “high loadings on a factor would indicate that they converge on a common point, the latent construct” (Hair et al., 2010, p. 686). The internal consistency level of multiple items within each factor is another indicator for convergent validity of a measurement model structure. Our four-factor solution showed that each item had a significant loading (defined as a loading above .40) on one factor, without cross-loadings. The levels of internal consistency among the items in Factors 1, 2, 3, and 4 were satisfactory—Cronbach Alpha values were .84, .85, .80, and .79, respectively, and all of them were above the threshold of .70 (Hair et al., 2010, p. 125). Both results supported the convergent validity of the four-factor solution.
Table 1. Results of the Four-Factor Solution Derived from Exploratory Factor Analysis (n = 225)
Factor Item* Mean SD Rotated Loadings in Pattern Matrix
Factor 1 Factor 2 Factor 3 Factor 4
1. Capacity
C1 5.85 1.17 .84 -.00 .09 -.10
C2 5.95 1.10 .79 -.03 -.13 .02
C3 5.33 1.36 .67 .05 -.01 .03
C4 5.78 1.10 .57 .13 -.06 .22
2. Learning
L1 5.39 1.36 -.08 .86 -.01 -.09
L2 5.24 1.19 .11 .70 .07 -.16
L3 5.51 1.07 .08 .63 -.15 .29
L4 5.53 1.28 .01 .59 .12 .07
L5 5.14 1.49 .16 .51 .10 -.02
L6 5.55 1.48 -.05 .49 -.03 .28
3. Workload
W1 3.87 1.88 .10 -.15 -.79 .07
W2 3.56 1.91 -.00 .07 -.78 -.10
W3 3.23 1.73 -.21 -.01 -.69 .02
W4 3.83 1.88 .17 .02 -.47 -.15
4. Persistence
P1 5.19 1.50 .11 -.11 .06 .64
P2 5.12 1.43 -.09 .22 .03 .61
P3 5.11 1.52 .05 -.13 .23 .59
P4 5.38 1.23 .20 -.07 -.13 .50
P5 4.87 1.56 -.14 .03 .09 .50
P6 4.66 1.52 .08 .04 .20 .48
Factor correlation matrix
Factor 1 1.00 - - -
Factor 2 .64 1.00 - -
Factor 3 .31 .57 1.00 -
Factor 4 .61 .72 .58 1.00
* See Appendix A for full statements of individual items.
Figure 1a. Scree plot of the three-factor solution.
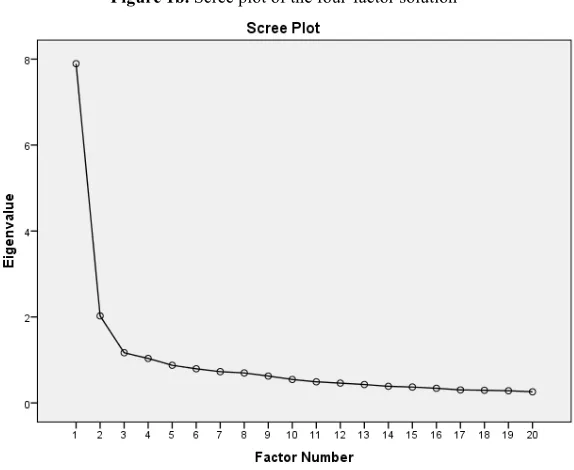
Figure 1b. Scree plot of the four-factor solution
Confirmatory Factor Analysis
Purpose
Sample and Data Collection
We administered the 20-item survey to a total of 379 undergraduate students enrolled in the COEN courses at the same mid-sized university during Spring semester of 2016—including 167 students in two 100-level courses and 212 students in eight 300/400-level courses (Note: 212 = 266 [the total headcounts in eight 300/400 level courses] – 54 [the number of students who were enrolled in two of the eight courses]). The 100-level courses were ‘Introduction to Engineering’ courses. The 300/400-level courses were senior-level project-based courses offered by different departments of the College of Engineering (Computer Science, Electrical and Computer Engineering, Materials Science and Engineering, and Mechanical and Biomedical Engineering). None of the 379 students participated in the EFA study during 2015. Among 379 students, 353 students (93.1%) voluntarily and anonymously submitted the survey—we used an anonymous survey to encourage students to provide honest responses. Students’ demographic information is presented in Error! Reference source not found..
Table 1. Demographic Information
EFA (n = 235) CFA (n = 379)a COEN (n = 2261)b
Category Sub-Category n % n % n %
Gender Female Male 186 49 20.9 79.1 311 68 17.9 82.1 1,931 330 14.6 85.4
Race / Ethnicity
White 146 62.1 241 63.6 1,479 65.4
Hispanic/Latino 23 9.8 32 8.4 214 9.5
Asian 7 3.0 21 5.5 85 3.8
American Indian/Alaska Native 1 0.4 2 0.5 9 0.4
Black/African American 0 0.0 2 0.5 24 1.1
Native Hawaiian/Pacific Islander 0 0.0 0 0.0 6 0.3
Multi-racial 11 4.7 13 3.4 90 4.0
Not reported 47 20.0 68 17.9 354 15.7
Citizenship
U.S. Citizen/Permanent Resident 173 73.6 290 76.5 1,864 82.4
Non-Resident Alien 62 26.4 89 23.5 397 17.6
(Kuwait) (52) (83.9) (51) (57.3) (265) (66.8)
(Saudi Arabia) (8) (12.9) (20) (22.5) (79) (19.9)
(Nepal, China, South Korea) (0) (0.0) (10) (11.3) (26) (6.5)
(Others) (2) (3.2) (8) (9.0) (27) (6.8)
Enrollment Status
Full-time 220 93.6 306 80.7 1,906 84.3
Part-time 15 6.4 73 19.3 353 15.6
Unknown 0 0.0 0 0.0 2 0.1
a 93.1% of this sample group participated in the CFA study. Because we used an anonymous survey, we cannot report the demographic information
of the actual participants.
b Undergraduate students enrolled in the College of Engineering during Spring, 2016.
Data Screening
Validation of the Multidimensional Structure
We performed pooled CFA with the data to assess the measurement model of all four latent constructs together, and then compared the outcomes of the four-factor model with the results of the alternative three-factor model.
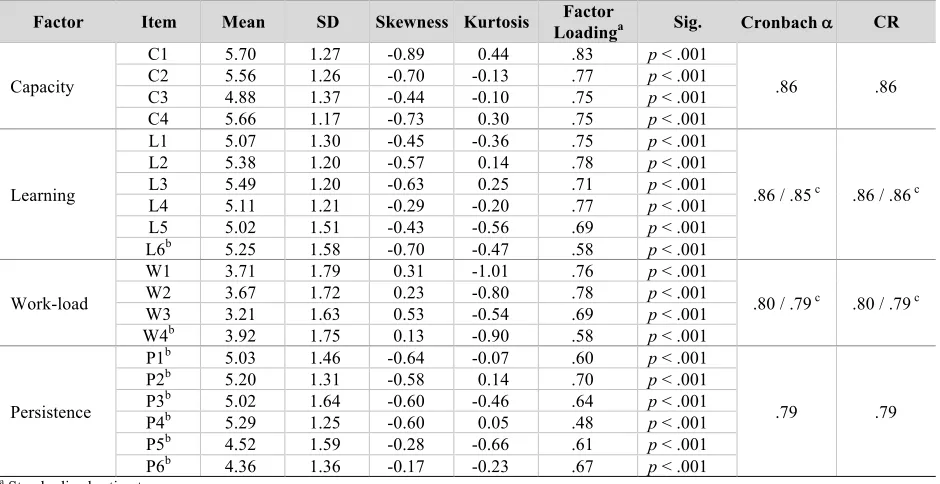
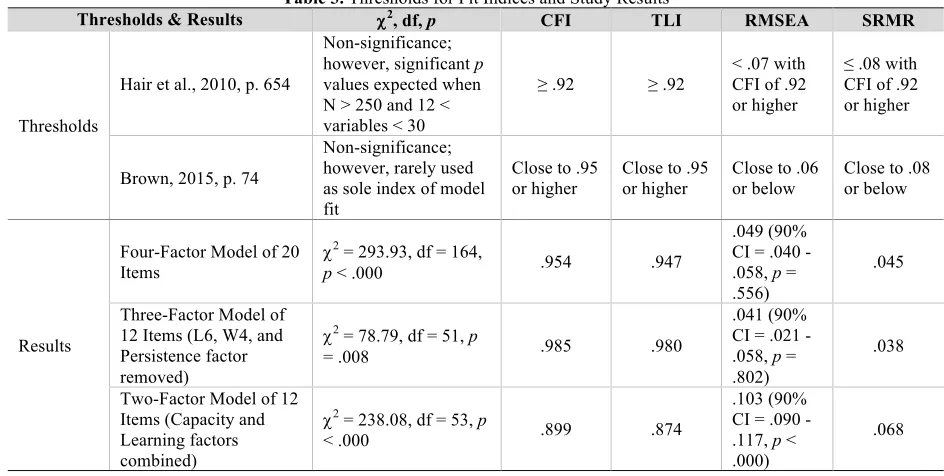
Goodness-of-fit: The fit indices thresholds we used and the fit statistics that we obtained from our study are presented in Table 3. All of the overall fit statistics, compared against the thresholds, indicated close fit of the four-factor model to the data. Standardized residuals under |2.5| indicate good model fit (Hair et al., 2010, see p. 689). All standardized residuals obtained from our data were below the threshold.
However, most of the items in the Persistence factor as well as L6 and W4 showed low factor loadings (Table 2). After removing these items, the respecified three-factor model showed an improvement in fit statistics (see Table 3), supporting the three-factor model as a preferred solution, as was hypothesized at the end of our EFA. We also tested a respecified two-factor model by combining the Capacity and Learning factors as one factor and keeping the Workload factor as a separate factor. We found that the two-factor model was clearly inferior to both the three- and four-factor models in terms of the fit statistics. Thus, we chose the respecified three-factor model of 12 items as our final solution and further tested the validity of the multidimensional model structure during the remaining analyses.
Table 2. Descriptive Statistics, Factor Loadings, and Reliability Results from Confirmatory Factor Analysis
Factor Item Mean SD Skewness Kurtosis LoadingFactor a Sig. Cronbach a CR
Capacity
C1 5.70 1.27 -0.89 0.44 .83 p < .001
.86 .86
C2 5.56 1.26 -0.70 -0.13 .77 p < .001
C3 4.88 1.37 -0.44 -0.10 .75 p < .001
C4 5.66 1.17 -0.73 0.30 .75 p < .001
Learning
L1 5.07 1.30 -0.45 -0.36 .75 p < .001
.86 / .85 c .86 / .86 c
L2 5.38 1.20 -0.57 0.14 .78 p < .001
L3 5.49 1.20 -0.63 0.25 .71 p < .001
L4 5.11 1.21 -0.29 -0.20 .77 p < .001
L5 5.02 1.51 -0.43 -0.56 .69 p < .001
L6b 5.25 1.58 -0.70 -0.47 .58 p < .001
Work-load
W1 3.71 1.79 0.31 -1.01 .76 p < .001
.80 / .79 c .80 / .79 c
W2 3.67 1.72 0.23 -0.80 .78 p < .001
W3 3.21 1.63 0.53 -0.54 .69 p < .001
W4b 3.92 1.75 0.13 -0.90 .58 p < .001
Persistence
P1b 5.03 1.46 -0.64 -0.07 .60 p < .001
.79 .79
P2b 5.20 1.31 -0.58 0.14 .70 p < .001
P3b 5.02 1.64 -0.60 -0.46 .64 p < .001
P4b 5.29 1.25 -0.60 0.05 .48 p < .001
P5b 4.52 1.59 -0.28 -0.66 .61 p < .001
P6b 4.36 1.36 -0.17 -0.23 .67 p < .001
a Standardized estimates b Removed from further analysis c Value without the removed items
Convergent, discriminant, and nomological validity of the multidimensional model structure: We followed Hair et al.’s (2010) guidelines for assessing the construct validity of the 12-item measurement model structure during CFA. A primary objective of CFA is “to assess the construct validity of a proposed measurement theory” and construct validity in CFA refers to “the extent to which a set of measured items actually reflects the theoretical latent construct those items are designed to measure. Thus, it deals with the accuracy of measurement” (p. 686).
factor loadings were statistically significant. All factor loadings also met the .70 threshold (except that L5 and W3 were .69 and .68). Cronbach’s alpha (a) levels and the composite reliability (CR) values were also above the threshold, .70, indicating satisfactory levels of internal consistency among items used in each factor (see Table 2). The ‘alpha if item deleted’ statistics showed that removal of any items would rather decrease the current Cronbach’s alpha levels, indicating that all current items in each factor are contributing to maintain the internal consistency of the measurement. Based on these results, we concluded that the multiple items in each factor represent the same dimension.
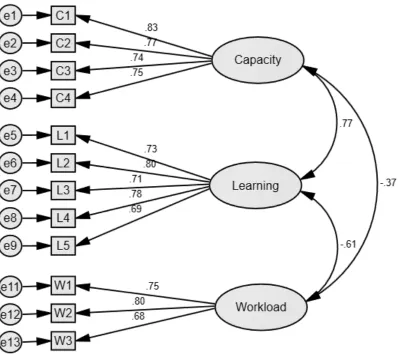
We assessed discriminant validity of the multidimensional measurement model by using multiple methods as well. We reviewed the factor correlations first. Factor correlations of .85 or above indicate problematic CFA-based discriminant validity of a multi-factor model (Brown, 2015, see p. 146). All factor correlations in our study (.77, -61, and .37 as shown in Figure 2) were below the cutoff criterion .85. We then conducted chi-square difference tests on three pairs of the three factors. All chi-square difference tests revealed significance, indicating that two factors in each pair represent distinct factors (Table 5). These two tests supported the discriminant validity of the three-factor model. We conducted a more rigorous average variance extracted (AVE) test—if each factor’s AVE value is greater than its squared correlation estimates with other factors, it supports the discriminant validity of the multiple factors (Hair et al., 2010, p. 688). All AVE values were greater than the squared correlation estimates, except that the Capacity factor’s AVE value (.55) was slightly smaller than its squared factor correlation with the Learning factor (.59) (Table 6).
Another type of construct validity of a measurement model is nomological validity, which assesses if the constructs are expected to relate to one another in a theoretically consistent way (Hair et al., 2010). We assessed nomological validity of our multidimensional model by reviewing the factor correlation matrix (.77, -61, and .37 in Figure 2). All factor correlations supported the expectation that the Workload factor (when not reverse-coded) is negatively related with other factors, while the remaining three factors are positively related with each other. All factor correlations were also statistically significant at the .001 level. The correlation pattern among the factors made sense, and we concluded that nomological validity was achieved.
Table 3. Thresholds for Fit Indices and Study Results
Thresholds & Results c2, df, p CFI TLI RMSEA SRMR
Thresholds
Hair et al., 2010, p. 654
Non-significance;
however, significant p
values expected when N > 250 and 12 < variables < 30
≥ .92 ≥ .92 < .07 with CFI of .92
or higher
≤ .08 with
CFI of .92 or higher
Brown, 2015, p. 74
Non-significance; however, rarely used as sole index of model fit
Close to .95
or higher Close to .95 or higher Close to .06 or below Close to .08 or below
Results
Four-Factor Model of 20 Items
c2 = 293.93, df = 164,
p < .000 .954 .947
.049 (90% CI = .040 - .058, p = .556)
.045
Three-Factor Model of 12 Items (L6, W4, and Persistence factor removed)
c2 = 78.79, df = 51, p
= .008 .985 .980
.041 (90% CI = .021 - .058, p = .802)
.038
Two-Factor Model of 12 Items (Capacity and Learning factors combined)
c2 = 238.08, df = 53, p
< .000 .899 .874
.103 (90% CI = .090 - .117, p < .000)
Table 4. Chi-Square Difference Tests Results
Model 2 with more parameters, fewer df
Model 1 with fewer
parameters, more df c2model1 - c2model2 dfmodel1 - dfmodel2 Sig.
2-factor model (Capacity x Learning)
1-factor model
(two factors combined) 164.30 - 26.20 = 138.10 27 - 26 = 1 p < .001
2-factor model
(Capacity x Workload) 1-factor model (two factors combined) 257.97 - 24.21 = 233.76 14 - 13 = 1 p < .001
2-factor model
(Learning x Workload) 1-factor model (two factors combined) 190.38 - 39.34= 151.04 20 - 19 = 1 p < .001
Table 5. AVE Values (Diagonal) and Squared Correlations between Latent Variables (Off-Diagonal)
Factor Capacity Learning Workload
Capacity .60 - -
Learning .59 .55 -
Workload .14 .37 .56
Instrument Finalization
During the CFA, we assessed if the EFA-generated survey instrument measures a multidimensional construct regarding engineering students’ attitudes toward team projects. Based on the results obtained from the series of analyses on the validity of the multidimensional model structure, we drew a conclusion that an alternative three-factor model of 12 items without L6, W4, and six items of the Persistence factor presents clearer evidence for the multidimensional structure than the four-factor model of 20 items. We call the final instrument of 12 items the Attitudes toward Team Projects Scale on Capacity, Learning, and Workload (ATPS-CLW).
CONCLUSIONS
A Way to Measure Learners’ Attitudes toward Team Projects
People form their attitudes toward an object based on their previous experience with it. Students’ attitudes toward team projects are likely formed based on their previous experience with team projects, observing benefits and challenges in participating in team projects. When designing engineering courses with team-based learning methods, instructors should be aware of students’ attitudes toward team projects up front, in order to provide effective instructional strategies to facilitate the development of effective teams and to prevent dysfunctional teams. However, since a latent variable such as ‘attitudes toward team projects’ is not directly observed, it is difficult to measure and quantify the degree of students’ attitudes toward team projects without using a valid and reliable measurement scale.
The purpose of developing this survey instrument was based on our practical needs for better understanding our students’ attitudes toward team projects during a learner analysis and finding ways to provide them with better learning experiences while they are completing team projects. Researchers use factor analysis to develop an instrument to measure latent constructs—such as ‘attitudes toward team projects.’ EFA is usually used “to identify the latent constructs or to generate hypotheses about their possible structure” whereas CFA is used “to evaluate hypothesized structures of the latent constructs and/or to develop a better understanding of such structures” (Bandalos & Finney, 2010, p. 93). We conducted both EFA and CFA and found one way to measure students’ attitudes toward team projects. From EFA, we found a four-factor model of 20 items that measure different aspects of attitudes toward team projects—Capacity, Learning, Workload, and Persistence. However, we recognized that by removing the Persistence factor (six items), the evidence for the discriminant validity of the three-factor model of 14 items would be stronger. We tested this hypothesis in the subsequent CFA. Based on the CFA results, we decided to exclude the Persistence factor as well as two other items due to the low factor loadings, giving us a three-dimensional structure of a 12-item scale. We intended this scale to be used as a learner assessment tool to measure and diagnose students’ attitudes toward team projects. The multiple items in each of the three factors address specific aspects (variables) of the factor, reflecting benefits or challenges associated with team projects.
Limitations of the Study
We recognized several limitations of our survey development process. First, in retrospect, the study could have benefited by having another expert panel review the survey items before finalizing them. Second, we used a convenience sample (and purposive sample because we recruited students from project-based courses) rather than a random sample as the scale development sample. Also, the CFA data met the univariate normality criteria, but failed to meet the multivariate normality threshold. These characteristics of the development sample could be threats to external validity, limiting generalization of the results.
We specified the scale name with the suffix ‘CLW’ to emphasize that the scale is limited to measuring only these three dimensions of attitudes toward team project. In our CFA study, the six items of the Persistence factor were not confirmed as a strong dimension, and we attribute this mainly to measurement errors. The wordy items included in the Persistence factor (e.g., “When working in a team, I become more willing to put in additional time and effort required to complete challenging tasks than when working alone.”)—although they were derived from our local need (to use them for learner analysis)—could make the factor prone to measurement errors.
Significance of the Study and Classroom Applications
Despite the limitations, we want to highlight several strengths of our study. One strength is that we used both EFA and CFA to develop the scale. When researchers conduct EFA to develop an instrument, they present a model that is yet to be confirmed. The structural measurement model identified from an EFA study represents only one possible type of the relationships among the variables, and other models may represent the data just as well (Bandalos & Finney, 2010). In our study, we conducted EFA and developed a multidimensional structure of the measurement model. We then conducted CFA to validate the multidimensional structure of the instrument. Also, as we discussed in the Overall Research Purpose section, we have not found research that reports the development of a survey instrument that measures engineering students’ attitudes toward team projects, using both EFA and CFA. During the EFA and CFA processes, we used a variety of statistical assessment methods based on multiple sources. We hope that the detailed EFA and CFA processes that we described in this article are helpful to other researchers who wish to conduct studies with similar purposes. The descriptions of the study limitations that we presented above should also alert other researchers regarding what they may experience during their research and help them avoid negative outcomes.
Another significance of our study is that the ATPS-CLW when used as a learner analysis tool—as we intended—can help instructors be proactive in diagnosing positive and negative aspects of team projects that could influence students’ attitudes toward team projects. In instructional design—similar to the engineering practice—diagnosis should precede solutions. Once learners’ characteristics such as attitudes toward team projects are diagnosed, instruction can be designed with adequate strategies that accommodate the learners’ needs. We emphasize the importance of gathering data to better understand learners’ characteristics during the front-end of team project-based instruction. The data obtained from the ATPS-CLW could assist while employing team-building strategies such as: developing a team charter (to set ground rules with which all team members agree to comply), assigning a team leader (to select a person who may take on a project manager’s role), and conducting self/peer evaluations during team projects (to facilitate reflection on areas for improvement, focusing on individual team members’ responsibilities and coordination) (for more information on various team-building strategies, see Johnson & Johnson, 1991; Johnson, Johnson, & Smith, 2006; Slain, 1995; Smith, 2014).
Similar to using a pretest as a pre-instructional strategy that alerts learners to what they are about to learn and facilitates their subsequent learning process (Hartley & Davis, 1976), instructors may use the ATPS-CLW as not only a learner analysis tool but also part of their pre-instructional strategy. Administering the ATPS-CLW in the beginning of a team project followed by an instructional module on effective team building could alert learners to the benefits and challenges associated with working in a team environment and help them increase awareness and readiness to exhibit desirable teamwork behaviors. In doing so, instructors may also incorporate other scales—for example, the Group Work Contribution Scale (GWCS) to measure learners’ teamwork behaviors such as how much effort, initiative, responsibility, and back-up behavior learners need to use during their team project (Joo & Dennen, 2017). Especially, the four items from the GWCS’s back-up behavior dimension can be used to measure and develop learners’ willingness to provide peer assistance to their teammates (help teammates who are unable to fulfill their roles; correct teammates’ mistakes; provide constructive feedback on teammates’ work; help others beyond my assigned tasks).
Suggestions for Future Research
We developed the ATPS-CLW based on our practical local needs for using a valid survey instrument to measure students’ attitudes toward team projects during a learner analysis of the systematic instructional design process. Our study has shown that the ATPS-CLW measures capacity-, learning-, and workload-related dimensions of learners’ attitudes toward team projects. We would like to suggest developing a more comprehensive scale by adding other dimensions to the scale. For example, the Persistence dimension can be redesigned and tested again. We offer some suggestions for survey item development. Although using a mix of positively- and negatively-stated items has been recommended to help reduce response biases by some researchers (Cronbach, 1942), it can also become a threat to the scale validity (Weem, Onwuegbuzie, & Lusting, 2003) because negatively-worded items may “produce artifactual relationship on the questionnaire” (Podsakoff, MacKenzie, Podsakoff, & Lee, 2003, p. 882). In our study, since the Workload factor consists of all negatively-worded items, it would be possible to criticize that the Workload factor was created due to this method bias. While this is a reasonable criticism, we offer the following evidence to argue otherwise. First, not all 14 negatively-worded items fell under the same factor. Second, the items included in the Workload factor share a common, meaningful attitudinal tendency—wanting to avoid workload-related challenges. Third, the respecified two-factor model (dividing positively- and negatively-worded items into separate factors) showed poor fit indices. Nonetheless, using a balanced number of positively- and negatively-worded items in a scale is no longer considered the best practice. Common recommendations in scale development include using only positively-worded items, or if mixing positively- and negatively-worded items, alerting respondents to the presence of negatively-worded items by grouping them together and providing additional instruction (Roszkowski & Soven, 2010). Since the three items in the workload-related challenges dimension in the ATPS-CLW are negatively worded while other items are positively worded, we recommend that instructors and researchers use the latter method— providing informational directions before presenting the group of three negatively-worded items.
Continuous testing of the validity of the scale is also necessary. When it comes to the validity of a measurement instrument, “there are multiple aspects to consider,” and it is not possible to present all aspects of validity evidence in one research report (Douglas & Purzer, 2015, p. 111). In order for the instrument to be applicable to others, it needs continuous testing and validation. We used a male-dominant sample of undergraduate engineering students who were attending classes on campus. Future research may be conducted with samples of students containing balanced proportions of male and female members, students taking online courses, and professionals in the workplace who participate in face-to-face or virtual teams.
to understand potential differences in learners’ attitudes toward team projects influenced by their cultural background. In addition to using an instrument such as the ATPS-CLW, we recommend also employing a qualitative research approach in order to have a deeper understanding of students’ cultural background that may influence their attitudes toward team projects.
AUTHOR BIOGRAPHIES
Dr. Chyung, Ed.D., is a Professor of the Department of Organizational Performance and Workplace Learning in the College of Engineering at Boise State University. She teaches graduate-level evaluation and research courses. She has published research articles in the Journal of STEM Education, Advances in Engineering Education, and the Proceedings of the American Society for Engineering Education (ASEE) Annual Conference. Email: [email protected]
Dr. Winiecki, Ph.D., is a Professor of the Department of Organizational Performance and Workplace Learning in the College of Engineering at Boise State University. He teaches graduate-level needs assessment and research and professional ethics courses. He is Co-Principal Investigator on a grant-funded project in which he is incorporating ethics instruction and practical exercises throughout undergraduate engineering and computer science curricula. Email: [email protected]
Dr. Hunt, Ph.D., is a Lecturer in the College of Engineering at Boise State University. He teaches introductory engineering courses. He has presented papers at American Society for Engineering Education conferences (local and national). Email: [email protected]
Ms. Sevier, B.S., is a Lecturer/Coordinator in the College of Engineering at Boise State University. She teaches introductory engineering courses. She has presented papers at American Society for Engineering Education conferences (local and national). Email: [email protected]
REFERENCES
ABET (2016). Criteria for accrediting computing programs, 2016-2017. Retrieved from
http://www.abet.org/accreditation/accreditation-criteria/criteria-for-accrediting-engineering-programs-2016-2017/#outcomes
Alford, L. K., Fowler, R., & Sheffield, S. (2014, June). Evolution of student attitudes toward teamwork in a project-based,
team-based first year introductory engineering course. Paper presented at the 121st ASEE Annual Conference and Exposition, Indianapolis, IN. Retrieved from https://www.asee.org/public/conferences/32/papers/8444/download
Allport, G. W. (1935). Chapter 17: Attitudes. In C. Murchison (Ed.), Handbook of social psychology (pp. 798-844). Worcester,
MA: Clark University Press.
Bandalos, D. L., & Finney, S. (2010). Factor analysis: Exploratory and confirmatory. In G. R. Hancock & R. O. Mueller (Eds.),
The reviewer’s guide to quantitative methods in the social science (pp. 93-114). New York: Routledge.
Barron, B., & Darling-Hammond, L. (2010). Prospects and challenges for inquiry-based approaches to learning. In H. Dumont,
D. Istance, & F. Benavides (Eds.), The nature of learning: Using research to inspire practice (pp. 199–225). Paris:
OECD.
Barrows, H. S. (1996). Problem-based learning in medicine and beyond: A brief overview. New Directions for Teaching and
Learning, 1996(68), 2-12.
Boise State University (2015). Enrollment profile, Fall 2015. Retrieved from https://analytics.boisestate.edu/default.aspx
Borrego, M., Karlin, J., McNair, L., & Beddoes, K. (2013). Team effectiveness theory from industrial and organizational
psychology applied to engineering student project teams: A research review. Journal of Engineering Education, 102(4),
472-512.
Brinkerhoff, R. O. (2003). The success case method: Find out quickly what’s working and what’s not. San Francisco:
Berrett-Koehler.
Brown, T. A. (2015). Confirmatory factor analysis for applied research (2nd ed.). New York: The Guildford Press.
Broyles, M. L. (1999). A comparison of the participation in cooperative learning on the success of physics, engineering and
mathematics students (Doctoral dissertation). Bell & Howell Information and Learning Company. (9949284) Burkett, S., Kotru, S., Lusth, J. C., McCallum, D., & Dunlap, S. (2014). Introducing creativity in a design laboratory for a
freshman level electrical and computer engineering course. American Journal of Engineering Education, 6(1), 11-26.
Byrne, B. M. (2010). Structural equation modeling with AMOS: Basic concepts, applications, and programming (2nd ed.). New
Cronbach, L. J. (1942). Studies of acquiescence as a factor in the true-false test. Journal of Educational Psychology, 33(6), 401-415.
Davidson, N., & Major, C. H. (2014). Boundary crossings: Cooperative learning, collaborative learning, and problem-based
learning. Journal on Excellence in College Teaching, 25(3&4), 7-55.
Davidson, N., Major, C. H., & Michaelsen, L. K. (2014). Small-group learning in higher education—cooperative, collaborative,
problem-based, and team-based learning: An introduction by the guest editors. Journal on Excellence in College
Teaching, 25(3&4), 1-6.
DeVellis, R. F. (2012). Scale development: Theory and applications (3rd ed.). Thousand Oaks, CA: Sage.
Dick, W., Carey, L., & Carey, J. O. (2014). The systematic design of instruction (8th ed.). Boston, MA: Pearson.
Douglas, K. A., & Purzer, S. (2015). Validity: Meaning and relevancy in assessment for engineering education research. Journal
of Engineering Education, 104(2), 108-118.
Dym, C. L., Agogino, A.M., Eris, O., Frey, D. D., & Leifer, L. J. (2005). Engineering design thinking, teaching, and learning.
Journal of Engineering Education, 94(1), 103-120.
Eagly, A. H., & Chaiken, S. (1993). The psychology of attitudes. Fort Worth, TX: Harcourt.
Eagly, A. H., & Chaiken, S. (2007). The advantages of an inclusive definition of attitude. Social Cognition, 25(5), 582-602.
Fabrigar, L. R., & Wegener, D. T. (2012). Exploratory factor analysis. New York: Oxford University Press.
Favor, J. K., & Harvey, M. (2016, January). We shall not be moved: Adult learners' intransigent attitudes about group projects.
Paper presented at the 2016 Adult Education Research Conference, Charlotte, NC. Retrieved from http://newprairiepress.org/cgi/viewcontent.cgi?article=1018&context=aerc
Fink. L. D. (2002). Beyond small groups: Harnessing the extraordinary power of learning teams. In L. K. Michaelsen, A. B.
Knight, & L. D. Fink (Eds), Team-based learning: A transformative use of small groups (pp. 3-25). Westport, CT:
Praeger Publishers.
Gaskin, J. (2016). Exploratory factor analysis. Retrieved from
http://statwiki.kolobkreations.com/index.php?title=Exploratory_Factor_Analysis
Griffin, P. M., Griffin, S. O., & Llewellyn, D. C. (2004). The impact of group size and project duration on capstone design.
Journal of Engineering Education, 93(3), 185-193.
Haidet, P., Kubitz, K., & McCormack, W. T. (2014). Analysis of the team-based learning literature: TBL comes of age. Journal
on Excellence in College Teaching, 25(3&4), 303-333.
Hair, J. F., Black, W. C., Babin, B. J., & Anderson, R. E. (2010). Multivariate data analysis (7th edition). Upper Saddle River,
NJ: Prentice Hall.
Hartley, J., & Davis, I. K. (1976). Pre-instructional strategies: The role of pretests, behavioral objectives, overviews, and advance
organizers. Review of Educational Research, 46(2), 239-265.
Hayton, J. C., Allen, D. G., & Scarpello, V. (2004). Factor retention decisions in exploratory factor analysis: A tutorial on
parallel analysis. Organizational Research Methods, 7(2), 191-205.
Herrington, J., Reeves, T. C., & Oliver, R. (2014). Authentic learning environments. In J. M. Spector et al. (Eds.), Handbook of
research on educational communications and technology (pp. 401-412). New York: Springer.
Hsiung, C. M. (2010). Identification of dysfunctional cooperative learning teams based on students’ academic achievement.
Journal of Engineering Education, 99(1), 45-54.
Hsiung, C. M. (2012). The effectiveness of cooperative learning. Journal of Engineering Education, 101(1), 119-137.
Johnson, D. W., & Johnson, R. T. (1991). Learning together and alone: Cooperative, competitive, and individualistic learning
(3rd ed.). Needham Heights, MA: Allyn and Bacon.
Johnson, D. W., & Johnson, R. T. (1999). Making cooperative learning work. Theory into Practice, 38(2), 67-73.
Johnson, D. W., & Johnson, R. T. (2004). Assessing students in groups: Promoting group responsibility and individual
accountability. Thousand Oaks, CA: Corwin Press.
Johnson, D. W., Johnson, R. T., & Smith, K. A. (1991). Cooperative learning: Increasing college faculty instructional
productivity. ASHE-ERIC higher Education Report No. 4. Washington D. C.: The George Washington University, Graduate School of Education and Human Development.
Johnson, D. W., Johnson, R. T., & Smith, K. A. (2006). Active learning: Cooperation in the college classroom (3rd ed.). Edina,
MN: Interaction Book Company.
Johnson, D. W., Johnson, R. T., & Smith, K. A. (2014). Cooperative learning: Improving university instruction by basing practice
on validated theory. Journal on Excellence in College Teaching, 25(3&4), 85-118.
Johnson, D. W., Johnson, R., & Anderson, D. (1983). Social interdependence and classroom climate. Journal of Social
Psychology, 120(1), 135-142.
Joo, M-H., & Dennen, V. P. (2017). Measuring university students’ group work contribution: Scale development and validation.
Small Group Research, 48(3), 288-310. DOI: https://doi.org/10.1177/1046496416685159
Korkmaz, O. (2012). A validity and reliability study of the online cooperative learning attitude scale (OCLAS). Computers &
Education, 59(4), 1162-1169.
Krosnick, J. A., & Petty, R. E. (1995). Attitude strength: An overview. In R. E. Petty & J. A. Krosnick (Eds.), Attitude strength:
Kubiszyn, T., & Borich, G. (1996). Educational testing and measurement: Classroom application and practice (5th ed.). New
York: HarperCollins College Publishers.
Loughry, M. L., Ohland, M., W., & Moore, D. D. (2007). Development of a theory-based assessment of team member
effectiveness. Educational and Psychological Measurement, 67(3), 505-524.
Marmaril, N. A., Usher, E. L., Li, C. R., Economy, D. R., & Kennedy, M. S. (2016). Measuring undergraduate students’
engineering self-efficacy: A validation study. Journal of Engineering Education, 105(2), 366-395.
Marra, R., Jonassen, D. H., Palmer, B., & Luft, S. (2014). Why problem-based learning works: Theoretical foundations. Journal
on Excellence in College Teaching, 25(3&4), 221-238.
McInnerney, J. M., & Roberts, T. S. (2004). Collaborative or cooperative learning? In T. S. Roberts (Eds.), Online collaboration
learning: Theory and practice (pp. 203-214). Hershey, PA: Idea Group.
McNair, L. D., Newswander, C., & Boden, D. (2011). Student and faculty interdisciplinary identities in self-managed teams.
Journal of Engineering Education, 100(2), 374-396.
Michaelsen, L. K., & Knight, A. B. (2002). Creating effective assignments: A key component of team-based learning. In L. K.
Michaelsen, A. B. Knight, & L. D. Fink (Eds), Team-based learning: A transformative use of small groups (pp. 53-75).
Westport, CT: Praeger Publishers.
Michaelsen, L. K., Knight, A. B., & Fink, L. D. (Eds.). (2002). Team-based learning: A transformative use of small groups.
Westport, CT: Praeger Publishers.
Millis, B. J. (2014). Using cooperative structures to promote deep learning. Journal on Excellence in College Teaching, 25(3&4),
139-148.
Moraga, R., & Rahn, R. (2007). Studying knowledge retention through cooperative learning in an operations research course. In
G. Bayraksan, W. Lin, Y. Son, & R. Wysk (Eds), Proceedings of the 2007 Industrial Engineering Research Conference
(pp. 1161-1166). Retrieved from ProQuest Database.
National Science Foundation (2014). Chapter 2. Higher education in science and engineering. In Science and Engineering
Indicators 2014.Retrieved from http://www.nsf.gov/statistics/seind14/content/chapter-2/chapter-2.pdf
O’Connell, R. M. (2011). Adapting team-based learning to early engineering courses. In the Proceedings of the 2011 Midwest
Section Conference of the American Society for Engineering Education. Retrieved from https://www.asee.org/documents/sections/midwest/2011/ASEE-MIDWEST_0012_013783.pdf
Oh, E. (2015). Case studies of team project based instruction. International Journal of u-and e-Service, Science and Technology,
8(9), 231-240.
Ohland, M. W., Loughry, M. L., Woehr, D. J., Finelli, C. J., Bullard, L. G., Felder, R. M., Layton, R. A., Pomeranz, H. R., & Schmucker, D. G. (2012). The comprehensive assessment of team member effectiveness: Development of a
behaviorally anchored rating scale for self and peer evaluation. Academy of Management Learning & Education, 11(4),
609-630.
Olson, M. A., & Fazio, R. H. (2009). Implicit and explicit measures of attitudes: The perspective of the MODE model. In R. E.
Petty, R. H. Fazio, & P. Briñol (Eds.), Attitudes: Insights from the new implicit measures (pp. 19-63). New York:
Psychology Press.
Ostrom, T., Bond, C., Krosnick, J. A., & Sedikides, C. (1994). Attitude scales: How we measure the unmeasurable. In S. Shavitt,
& T. C. Brock (Eds), Persuasion: Psychological insights and perspectives (pp. 15-42). Needham Heights, MA: Allyn
& Bacon.
Parks, D. K., Onwueguzie, A. J., & Cash, S. H. (2001). Development of a measure for predicting learning advancement through
cooperative education: Reliability and validity of the PLACE scale. Journal of Cooperative Education, 36(1), 23-31.
Peterson, S. E., & Miller, J. A. (2004). Quality of college students’ experiences during cooperative learning. Social Psychology of
Education, 7, 161-183.
Pimmel, R. (2001). Cooperative learning instructional activities in a capstone design course. Journal of Engineering Education,
90(3), 413-421.
Podsakoff, P. M., MacKenzie, S. B., Podsakoff, N. P., & Lee, J-Y. (2003). Common method biases in behavioral research: A
critical review of the literature and recommended remedies. Journal of Applied Psychology, 88(5), 879-903.
Ro, H. K., Merson, D., Lattuca, L. R., & Terenzini, P. T. (2015). Validity of the contextual competence scale for engineering
students. Journal of Engineering Education, 104(1), 35-54.
Roszkowski, M., & Soven, M. (2010). Shifting gears: Consequences of including two negatively worded items in the middle of a
positively worded questionnaire. Assessment & Evaluation in Higher Education, 35(1), 117-134.
Savin-Baden, M. (2014). Using problem-based learning: New constellations for the 21st century. Journal on Excellence in
College Teaching, 25(3&4), 197-219.
Schaffer, S., Chen, X., Zhu, X., & Oakes, W. (2012). Self-efficacy for cross-disciplinary learning in project-based teams. Journal
of Engineering Education, 101(1), 82-94.
Senior, B., & Swailes, S. (2007). Inside management teams: Developing a teamwork survey instrument. British Journal of
Management, 18, 138-153.
Slain, R. E. (1995). Cooperative learning: Theory, research, and practice (2nd ed.). Needham Heights, MA: Allyn and Bacon.
Spector, P. E., Van Katwyk, P. T., Brannick, M. T., & Chen, P. Y. (1997). When two factors don’t reflect two constructs: How
item characteristics can produce artifactual factors. Journal of Management, 23(5), 659-677.
Tabachnick, B. G., & Fidell, L. S. (2014). Using multivariate statistics (6th ed.). London: Pearson Education Limited.
Thurstone, L. L. (1928). Attitudes can be measured. American Journal of Sociology, 33(4), 529-554.
Todd, R. H., Magleby, S. P., Sorensen, C. D., Swan, B. R., & Anthony, D. K. (1995). A survey of capstone engineering courses
in North America. Journal of Engineering Education, 84(2), 165-174.
Tseng, H., Ku, H-Y., Wang, C-H., & Sun, L. (2009). Key factors in online collaboration and their relationship to teamwork
satisfaction. The Quarterly Review of Distance Education, 10(2), 195-206.
Tuckman, B. (1965). Developmental sequence in small groups. Psychological Bulletin, 63(6), 384–399.
Warner, R. M. (2008). Applied statistics: From bivariate through multivariate techniques. Thousand Oaks, CA: Sage.
Weem, G. H., Onwuegbuzie, A. J., Lustig, D. (2003). Profiles of respondents who respond inconsistently to positively- and
negatively-worded items on rating scales. Evaluation & Research in Education, 17(1), 45-60.
Wilkins, K. G., Bernstein, B. L., & Bekki, J. M. (2015). Measuring communication skills: The STEM interpersonal
communication skills assessment battery. Journal of Engineering Education, 104(4), 433-453.
Yin, A. C. (2009). Learning on the job: Cooperative education, internships and engineering problem-solving skills (Doctoral
dissertation). Retrieved from the ProQuest Dissertations Publishing. (399731)
Yoon, S. Y., Evans, M. G., & Strobel, J. (2014). Validation of the teaching engineering self-efficacy scale for K-12 teachers: A
structural equation modeling approach. Journal of Engineering Education, 103(3), 463-485.
APPENDIX A
A Four-Factor Solution with 20 Items
Factor Aspect Measurement Item Used
Developing
Professional Capacity for the Workplace (Capacity)
Developing professional
/career capacity C1. The more experiences I have working in teams, the better for developing my professional/career capacity. Developing project
management skills C2. Participating in team projects helps me develop project management skills.
Developing civic values C3. Team projects help me adopt civic values needed to be part of a professional community. Developing professional
skills C4. Working in teams helps me develop professional skills that are valuable in the workplace.
Improving Learning and Problem Solving Skills (Learning)
Improving application skills L1. Team projects help me see how principles and concepts apply to solving real problems.
Improving analytic skills L2. Communicating with team members helps me become analytic.
Developing new
perspectives L3. I gain new perspectives or useful insight from working with others in a team.
Increased amount of
learning L4. I learn a lot while completing a project with others.
Increased interests in
problem solving L5. Team projects help me become more interested in solving problems in the workplace.
Efficient learning
L6. I learn difficult concepts and applications more quickly when discussing them with team members than when learning them alone.*
Avoiding Workload-Related Challenges (Workload)
Increased workload
W1. I try to avoid team projects because I often have to take on more than my share of the workload because of low performing teammates.
Dealing with different work
ethics W2. I’d rather work alone because it is difficult to find teammates who have a work ethic similar to mine.
Wasteful logistical issues W3. I want to avoid team projects because they involve a lot of wasted time to handle logistical issues.
Overworked feelings W4. I dislike that I feel overworked during team projects.*
Increasing Persistence for Better Outcomes (Persistence)
Focusing on successful
outcomes P1. Working in a team allows me to successfully produce products that I wouldn’t be able to do if working alone.*
Overcoming difficulties
through interaction P2. Having team members to talk with helps me persist through challenging tasks that I would have difficulty handling alone.*
Willing to spend more time for better outcomes
P3. I’d rather work in a team to produce a better quality product
even if it takes longer than when I work alone.*
Willing to accommodate others’ needs
P4. I am willing to accommodate the varying schedules
(availability) of team members to support better teamwork.*
Willing to put more time and effort during difficulty
P5. When working in a team, I become more willing to put in additional time and effort required to complete challenging tasks
than when working alone.*
Being persistent due to peer support
P6. I become persistent when completing a team project because of
the support that I receive from my team members.*