Sustainable Government Debt:
The Case Of Poland
Gorm Jacobsen, University of Agder, Norway
ABSTRACT
Due to government budget deficits in many countries for decades, government debt has become a big problem for some of these countries. This problem accelerated further after the financial crises starting at the end of 2008, a crisis that led to a low and even negative economic growth for many countries. The first part of this article gives a standard theoretical discussion of what could be meant by sustainable government debt. At the end, there is an illustration with some figures for Poland where the conclusion seems to prove the need for a reduced government budget deficit to avoid a serious government debt problem in the future.
Keywords: Transition Economics; Economic History; Public Debt
INTRODUCTION
fter the Second World War until the first half of the 1970s, most OECD-countries had a strong economic growth. Public expenditure was growing in most countries, but due to low interest rates and strong economic growth, the size of the public debt was not seen as any problem for these countries. Only scientists of economic history were engaged in studying the problems of public debt.
After the oil-crisis in the first half of the 1970s, and also after the financial crisis starting at the end of 2008, there have been periods with low, and even negative economic growth, and also some periods with high interest rates. As a result, the development of public debt has been a huge problem for many countries. Because of this economists have been more interested in the problem of government debt and have started to study it more carefully.
In this article we will study the development of public debt in Poland, and look closer to what could be determined as sustainable public debt for the country in the long run.
THE MODEL
To discuss the development of public debt we will use the following model:
When we ignore the possibility of financing the government budget deficit by selling government property and by issuing money, the budget constraint is as follows:
T + ∆D = G + rD (1)
where T means taxes and G is government spending, while r is the interest rate and D is the public debt. The left side of the equation shows revenue and the right side represents expenditure. This equation can be written as:
∆D = G – T + rD (2)
where ∆D is net public borrowing requirement. With the primary budget T – G balanced, debt will increase with interest on the existing debt. To have constant debt we must have a surplus on the primary budget equal to the interest payment; i.e. T – G = rD
A more interesting feature is the size of public debt compared to gross domestic product (GDP), i.e. the debt ratio. We will discuss what is meant by sustainable debt in the long run. Sustainable debt can be defined as a situation when the relationship between government debt and GDP is constant over time.
From this definition we have sustainable debt s if the relationship
(3)
is constant over time, where Y is GDP. This relationship is of course constant if D and Y increase by the same rate of percentage over time.
Assuming that the annual growth rate in GDP is g, we have
∆Y = gY (4)
From our definition the debt is sustainable if
∆D = gD (5)
Then s is constant if
= (6)
We assume that the government budget surplus T – G is a fraction b of GDP; i.e.
T – G = bY 0˂ b ˂ 1 (7)
From (2) and (7) we find that ∆D = rD – bY, and from (4) and (6) we get the formula: . From these we
obtain the expression: . We obtain the following result:
=
= s (8)
From this formula we come to the following conclusion: If r ˃ g then b ˃ 0 if the debt shall be sustainable. If g ˃ r, i.e. if the GDP growth is higher than the interest rate, there might be a primary budget deficit, i.e. b ˂ 0, and the debt may still be sustainable. The level of sustainable debt depends on values of b, r and g, which are changing over time. As we see, the greater is b, the greater is s.
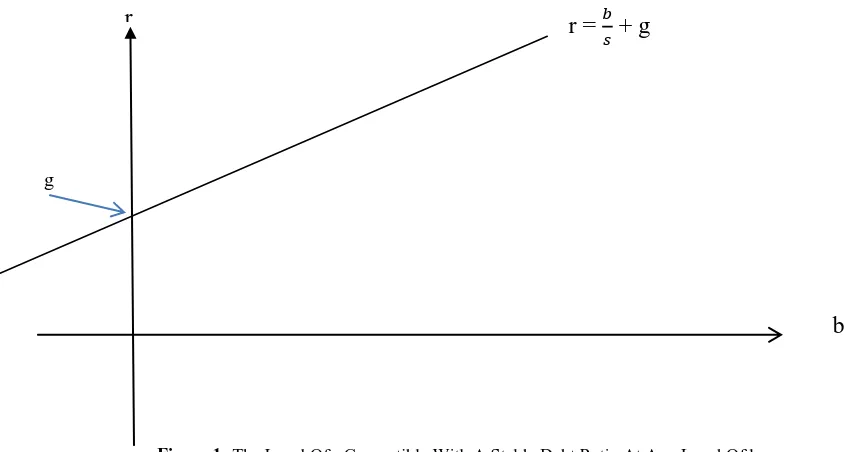
From formula (8) we get the following result:
r = + g (9)
g
Figure 1: The Level Of r Compatible With A Stable Debt Ratio At Any Level Of b
The value of g and r may be affected by the value of b. Increased b may indicate that the government has a debt problem. Furthermore a high b, i.e. reduced government spending and/or increased taxes will in the short run lead to reduced or even negative GDP growth, i.e. reduced g. However in the long run it may lead to increased growth since a big b indicates that the government takes the debt problem seriously. Investors may therefore become more optimistic about the future development of the economy.
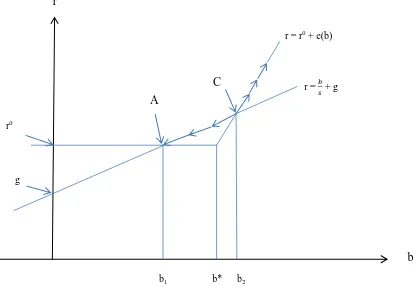
At least, in the short run a big or increased b may increase the uncertainty about the country’s possibility to pay their debt or not. This may lead the lenders in the financial market to charge a risk premium e when b exceeds a certain value b*. This can be formulated as follows:
r =
where r0 is the risk free interest rate the government has to pay for their debt. The relationship between r and b in this situation is shown in figure 2.
r
Figure 2. The Relationship Between r And b Including A Risk Premium
If b is greater than b* the lenders will issue a risk premium e, which increases with b, at least in the short run.
When b is smaller than b2, then b can be reduced and the debt will still be sustainable, i.e. we have a stable
equilibrium in A. However, if b is greater than b2 the risk premium and therefore the interest rate is so high that b
has to be increased to remain a sustainable debt, but then r increases further and b has to be increased over and over again, C is therefore an unstable equilibrium.
FIGURES FOR POLAND
Poland was one of the first post-socialist countries which changed from a central planning economy to a market economy. The new economic system was introduced on January 1, 1990.
The Polish economy like the economy of many other post-socialist countries was characterised by disequilibrium in almost every market. Most people had to spend a great part of their time queuing up to buy what was necessary for their daily life.
The transformation of the Polish economy to a market economy led to a deeper recession than expected during the two first years of the transformation process. GDP fell by 18,3 per cent from an already low level. During this period unemployment rose to more than 2 000 000 people, close to 12 per cent of the labour force, while consumer prices increased by almost 1 070 per cent.
During the whole period 1990 – 2012 the average annual rate of GDP-growth was 3.0 per cent. If we look r = r0 + e(b)
r
b
r = + g
A
C
g r0
After the introduction of a market economy January 1st 1990, the Polish government has run with deficit every year until today. Due to many years with high economic rate of growth and some years with relatively low interest rates, government debt has so far not been a significant problem. During this period the government was able to finance parts of their expenses by income from the privatization of state owned enterprises. Poland’s government debt was also reduced in the middle of the 1990s following a decision by the Paris and the London Clubs to half its debt to them.
Public debt has been fluctuating from around 36 per cent to 56 per cent of GDP for the last two decades; see table 1.
Table 1: GDP-Growth, Government Debt And Primary Budget Deficit Year GDP-Growth (%) In Fixed
Prices From Previous Year
Government Debt As Per Cent Of GDP
Primary Budget Deficit As Per Cent Of GDP
1990 -11.6 na na
1991 -7.6 na na
1992 1.5 na na
1993 3.8 na na
1994 5.2 na na
1995 7.0 49.0 -4.4
1996 6.0 43.4 -4.9
1997 7.1 42.9 -4.6
1998 5.0 38.9 -4.3
1999 4.5 39.6 -2.3
2000 4.2 36.8 -3.0
2001 1.1 37.6 -5.3
2002 1.4 42.2 -5.0
2003 3.9 47.1 -6.2
2004 5.3 45.7 -5.4
2005 3.6 47.1 -4.1
2006 6.2 47.7 -3.6
2007 6.8 45.0 -1.9
2008 5.0 47.1 -3.7
2009 1.6 50.9 -7.4
2010 3.9 54.8 -7.9
2011 4.5 56.2 -5.0
2012 1.9 55.6 -3.9
Sources: www.mf.gov.pl & www.stat.gov.pl
During the last decade Poland has had an increase in the debt ratio; see table 1. After a debt ratio of 47.1 per cent in 2008, it increased to 54.8 per cent just two years after the start of the financial crisis. This occurred in the only EU-country to exhibit economic growth in 2009.
Source: www.nbp.pl/
Figure 3: Long Term Real Interest Rates (%) On Government Bonds; 2003 – 2012.
According to the OECD, GDP per capita in 2012 measured in Purchasing Power Parity was on average USD 36 383 for the whole OECD-area, while it was USD 22 167 for Poland. Assuming that Poland will manage to achieve the current OECD-level 15 years from now, the annual rate of growth has to be 3.4 per cent on average. If we look at historical data reported earlier in this article, this growth rate seems realistic. Assuming that the average real interest rate in the coming years will be the same as the average for the last ten years, equation (8) shows that Poland can still run a small primary budget deficit, and then have sustainable debt.
Since the privatization process is almost completed and that there is no reason to expect debt reduction from abroad, there are strong reasons to assume that Poland may get a government debt problem if they do not manage to reduce primary budget deficit compared to average deficit of 4.6 per cent for the last 18 years. Of course, if they manage to achieve higher economic growth and lower interest rates than used in this example the government deficit and debt ratio may be reduced to a lower scale.
CONCLUDING REMARKS
Since government income from the privatization process will become relatively small in the future, and since the debt reduction from abroad like in the middle of the 1990’s is not likely to happen in the coming years, Poland needs to reduce government budget deficit to keep its debt below 60 per cent of GDP, which is one of the criteria in the Maastricht treaty. With realistic figures on interest rates and economic growth, it is necessary for Poland to succeed in its aim to get people to stay longer at work before retirement. This will increase tax income and reduce government spending. A new pension reform introduced from 2014 will be an important factor to reach this goal.
AUTHOR INFORMATION
Gorm Jacobsen has a bachleor’s degree in business administration from University of Lund in Sweden (1977) and 0
1 2 3 4 5 6
REFERENCES
1. Hoel M. & Qvigstad J.F. (1986): Statsgjelden – et problem når veksten er lav og renten høy? Sosialøkonomen nr.1.
2. Jacobsen G. (2011): Turning Poland around – The Polish Economy 1990 – 2009. Journal of Business Case Studies Volume 7, number 5.
3. Mehlum H. (2010): Sustainable debt and oil fund; University of Oslo.