Research article
Available online
www.ijsrr.org
ISSN: 2279–0543
International Journal of Scientific Research and Reviews
Comparison of MATLAB and FPGA Implementation of PAPR
Reduction Technique Using Polar Clipping
Manpreet Kaur* and Harjinder Singh
Department of Electronics and Communication Engineering UCoE Patiala-147002, Punjab, India
__________________________________________________________________________________
ABSTRACT:
The spectral efficient modulation techniques introduced in 3G and 4G suffer from a high Peak-to-Average Power Ratio. High PAPR results in in-band and out-band distortion. Various PAPR reduction techniques are available in literature. But due to its less hardware complexity, polar clipping is widely used. This paper presents the FPGA and MATLAB implementation of polar clipping technique.
KEYWORDS:
Crest Factor, FPGA, Peak to Average Power Ratio, Polar Clipping, Clipping Threshold_________________________________________________________________________________
Corresponding Author
Manpreet Kaur
Department of Electronics and Communication Engineering UCoE Patiala-147002, Punjab, India
1.
INTRODUCTION
3G wireless networks are progressing out nearly all over the world. Interest in streaming media and other high-speed wireless data applications are rising. To make sure wireless networks can meet future users demand, operators and manufacturers plan for the fourth generation (4G) mobile communication systems. These systems which are estimated to have a wider bandwidth with bit rates of up to 100 Mbps able to hold interactive multimedia services, global mobility, teleconferencing and wireless.The spectral efficient modulation techniques such as Wideband-Code Division Multiple Access system (W-CDMA) and Orthogonal Frequency Division Multiplexing (OFDM) used in 3G and 4G suffer from a high Peak-to Average Power Ratio (PAPR). It means that there is a large variation between
the average signal power and the maximum signal power. The PAPRis stated as 1,2.
PAPR= ( ( ))
( ( )) (1.1) Where x (t) is the amplitude of the signal.
PAPR is directly related to Crest Factor (CF) ,2
CF=√ (1.2) To spread the signal through the antenna, it is first converted to analog time domain by means of
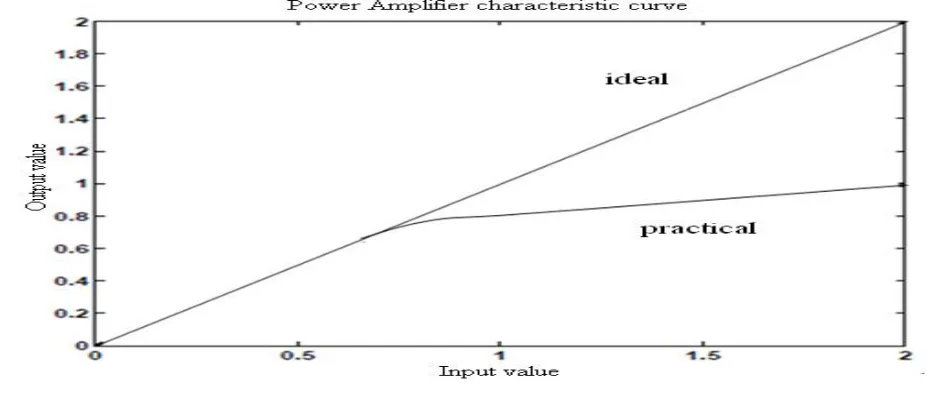
a D/A converter and then amplified with an RF power amplifier. High PAPR causes nonlinear distortion because of the nonlinear component in the transmitter i.e. Power Amplifier (PA). Characteristic curve of
power amplifier has been shown in Fig 1.
It shows two operating regions, namely linear and the saturation regions. When the amplifier operates in the linear region, signals are linearly amplified. However, when it operates in the saturation region, signals are not amplified anymore; they are compressed at the maximum output power of the amplifier.
Fig 1. Non-linear amplifier characteristic curve
.
To minimize these peaks, PA of the transmitter wants a very large dynamic range. Increasing the linear region of a PA is very exclusive and it is ineffective in this case. Also, the larger the PA’s dynamic range is, the more battery it consumes and since most of the systems are power limited, an PA with a large linear region would use most of the battery of the system, which is another reason why increasing the dynamic range of the PA is not a good solution. A high PAPR causes saturation in power amplifiers, leading IMD products among the sub carriers and disturbing out of band energy. Therefore, it is desirable to reduce the PAPR by means of PAPR reduction schemes -3.
1.1.
PAPR Reduction Using Polar Clipping
Among all other techniques clipping has been identified as the most efficient and simplest technique. Clipping too large peaks is a simple solution to the PAPR problem. Clipping reduces large peaks but also introduces distortion in the signal. But due to low probability of occurrence of too large
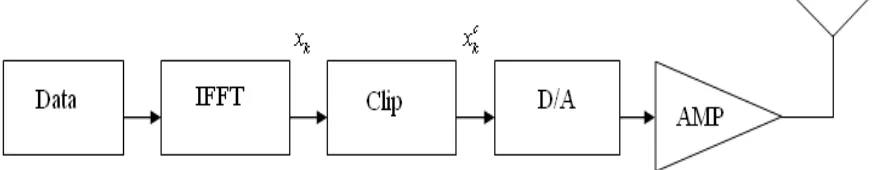
peaks this nonlinear distortion is generally small. The maximum peak power allowed is determined by the system specifications. A maximum peak amplitude A is chosen so that the signal does not exceed the limits of this region, symbols that exceed this maximum amplitude, will be clipped. The clipping function is performed in digital time domain, before the D/A conversion as shown in Figure 2 and the
process is described by the following expression:
= | |Φ≤ ,0≤ ≤ −1 | | >
Fig 2. Clipping function
Where xkcis the clipped signal, xkis the transmitted signal, is the clipping amplitude and f (xk) is the phase of the transmitted signal xk. The graphical expression of this function is shown in Fig 3.
Fig 3. Clipping in the transmitter
The Clipping Ratio (CR) is defined as
CR = (4)
And the Clip Ratio in dB is given by
CR [dB] = 20 log (5)
Where
is the root mean squared value of the unclipped OFDM signal and its mathematical expressionis
= ∑ (6)
The simplest way to remove the peaks is by clipping the signal such that the peak amplitude becomes limited to some predefined maximum level. By defining the highest accepted peak value as the Clipping Threshold, any peak above this value can be clipped appropriately. Clipping Threshold is defined as
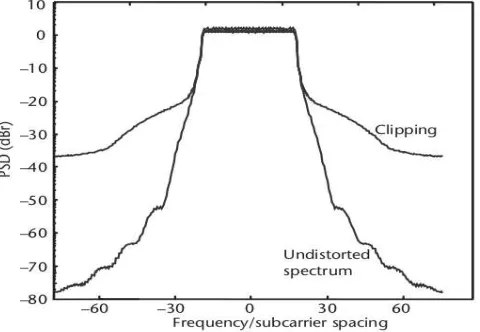
Clipping is a non-linear process so it introduces in-band distortion, also called clipping noise, out-of-band radiation and inter-carrier interference shown in Fig 4, which degrade the system performance and the spectral efficiency 4.
In-band distortion: This distortion occupies the same bandwidth as the desired signal. It can be seen as additive noise and it reduces BER performance of a communication system.
Out-of-band distortion: The inter-modulation products produce undesired frequency components at frequencies that are not occupied by signal of interest. This can cause high out-of-band radiation, which can interfere with other signals and can render a system unable to comply with spectral regulations.
Fig 4. . Out-of-band radiation due to clipping5
clipped signal and the original signal. The noise shaping filter can be defined to reduce unnecessary out-of-band energy6,7.
2. MATLAB IMPLEMENTATION OF PAPR REDUCTION TECHNIQUE.
2.1. Implementation of Crest Factor Reduction
The System Generator block diagram of the CFR design has been shown in Fig 5. It describes the implementation details of each module such as clipping error, noise shaping filter and subtract. For the CFR design implementation, the clipping ratio is assumed to be 7.7 dB to meet the desired target of PAPR reduction of 1.5 dB at an EVM of 2%. So if the clip ratio is 7.7 dB and average
power is 0.0524.
Fig 5. System Generator Block Diagram of CFR
CT= 10 . ∗ _ ∗ _ (8) Then according to the given formula, the clipping threshold can be calculated as 0.555dB which has been used in this polar clip design.
2.2) Simulation and Results
been evaluated on the basis input spectrum and output spectrum, clipping noise, Peak-to-Average Power Ratio reduction and Error Vector Magnitude.
2.3) Clipping Noise Spectrum for Different Bandwidths
The clipping noise spectrum for the bandwidth of 3.5 MHz, 5 MHz, 7 MHz and 10 MHz has been shown in Fig 6, Fig 7, Fig 8 and Fig 9 respectively.
Fig 6.Signal and Noise Spectrum for 3.5 MHz Fig 7.Signal and Noise Spectrum for 5 MHz
Fig 8.Signal and Noise Spectrum for 7 MHz Fig 9.Signal and Noise Spectrum for 10 MHz
that clipping noise is very high, the noise shaping filter confines the clipping-noise spectrum to the same spectrum occupied by the unclipped input signal.
3. FPGA IMPLEMENTATION OF PAPR REDUCTION TECHNIQUE
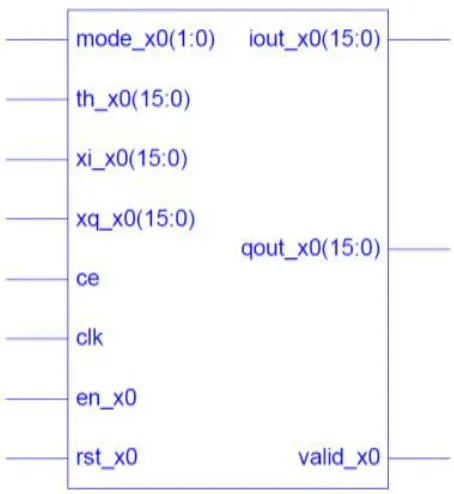
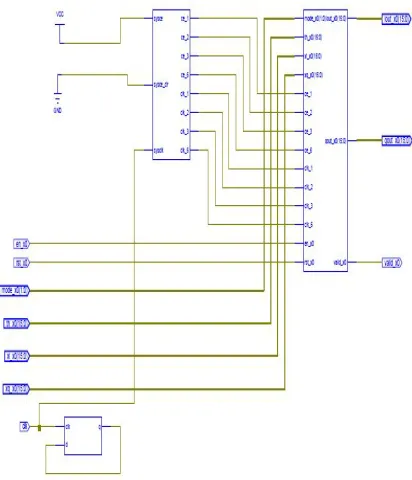
Fig.10 and Fig.11 shows a top level and internal structure Register Transfer Level schematic diagrams of proposed Crest Factor Reduction technique. In this design, RTL is a level of abstraction used in describing the operation of a synchronous digital circuit.
Fig 10 Top level RTL Schematic diagram of CFR Module
In RTL design, a circuit's behavior is defined in terms of the transfer of data between hardware registers, and the logical operations performed on those signals. Register transfer level concept is used in Hardware Description Languages (HDLs) like Verilog and VHDL to create high-level representations of a circuit, from which lower-level representations and ultimately actual wiring can be derived.
Fig.11.Internal Structure of RTL Schematic diagram of CFR Module
3.1Resource Utilization
Table 1 shows the resources used in this model which just takes a small part in Xilinx Virtex-4 Kit for CFR.
Table1.Device Utilization Summary of Xilinx FPGA for Polar Clipping
Device Utilization Summary (Estimated Values)
Logic Utilization Used Available Utilization
Number of Slices 938 6144 15%
Number of Slice Flip Flops 1384 12288 11%
Number of 4 input LUTs 1275 12288 10%
Number of bonded IOBs 86 240 35%
Number of GCLKs 1 32 3%
4. CONCLUSION
identical to each other and the distortion is almost negligible. Thus the comparison shows that the proposed PAPR reduction technique gives better performance for 10 MHz bandwidth.
The implementation of the proposed clipping technique is done using Virtex-4 FPGA; it shows an efficient utilization of internal resources. The resource utilization for polar clipping and noise-shaping filter shows that almost every item is below 40%. The FPGA implementation has been done for 10 MHz bandwidth. The comparison shows that FPGA implemented model has almost same performance as given by the simulated model.
REFRENCES
1. H G.Bae, M. Helaoui, A.Seregin, S.Boumaiza, F M. Ghannouchi, ‘Blind Peak-to-Average Power
Ratio reduction technique for WiMAX RF front-end’ IEEE 36th European Microwave Conference, 2006; 149-152;
2. N .Revueto “PAPR reduction in OFDM systems”, Master Thesis, Polytechnic University of Catalonia, Spain, 2008.
3. J. Armstrong, “New OFDM Peak-to-Average reduction scheme”, IEEE 53rd Vehicular Technology Conference, 2001;1:756-760.
4. S-K. Deng, M-C Lin, ‘OFDM PAPR Reduction Using Clipping with Distortion Control’, IEEE International Conference on Communications ICC, 2005; 4:2563-2567.
5. Ramjee Prasad,‘OFDM for Wireless Communication Systems’, London: Artech House Publishers;2004.
6. M. U. Rahim, T.H. Stitz, M. Renfors, ‘Analysis of Clipping-based PAPR-reduction in Multicarrier system’, IEEE 69th Vehicular Technology Conference, 2009;1 – 5;.
7. O.Vaananen, ‘Digital Modulators with Crest Factor Reduction Techniques’ Ph. D. Thesis, Helsinki University of Technology, Finland;2006.
Authors: