GSJ© 2018 www.globalscientificjournal.com
GSJ: Volume 6, Issue 2, February 2018, Online: ISSN 2320-9186
www.globalscientificjournal.com
THE
EFFECT
OF
REPLACING
THE
JOUKOWSKI
MAP
WITH
THE
GENERALIZED
KARMAN-TREFFTZ
MAP
IN
THE
METHOD
OF
ZEDAN
1
Swem S.T, 2 Manjak N.H and 2Okai J.O
1
Department of Mathematics/Statistics/Computer Science, University of Agriculture, Markurdi Benue, Nigeria.
2
Department of Mathematical Sciences,
Abubakar Tafawa Balewa University,Bauchi, Nigeria.
ABSTRACT
In this research paper, the conformal mapping aspect of the method of Zedan (1990) for
computation of the lift coefficient ( ) and surface pressure coefficient distribution ( ) on
arbitrary airfoils in potential flows is generalized by replacing the inverse Joukowski
transformation in the method by an inverse of the Karman-Trefftz transformation in order to
asses its performance.The generalization which ensures that the airfoil contour at and around
the trailing edge region is now more properly accounted for in the mapping process is applied
to the NACA 4412 airfoil and its performance measured by comparing its values
with those of the original version of the method by Zedan (1990) using NACA experimental
data as yardstick. The modified method has given reasonable predictions of these
aerodynamic coefficients and has outperformed the original version of the method by Zedan
(1990)
GSJ© 2018 www.globalscientificjournal.com
1.0 INTRODUCTION
The method of Zedan (1990) for computation of the lift coefficient ( ) and surface pressure
coefficient distribution ( ) on arbitrary airfoils in potential flows uses the inverse Joukowski
transformation to conformally map the flow around and on the boundary of an airfoil (except
at the trailing edge) in the plane onto the flow exterior to and on the boundary of a pseudo
circle, respectively, in the plane where the on the arbitrary airfoil are now
computed. The Joukowski map used in the mapping process permanently fixes the trailing
edge angle of the airfoil at zero degree. The value is not a realistic one since real
airfoils have blunt trailing edges or can be modified to have finite none zero angles at their
trailing edges for computational purposes (Gómez and Álvaro, 2006, Nico, 2012).
Consquently, the Joukowski map may not be able to properly account for the airfoil contour
at and around the trailing edge point (Kapania et al. 2008). It is therefore expected that if a
mapping function can be found with the ability to correct the defect in the Joukowski map,
the accuracy of the method may likely improve since the pseudo circles generated in this case
will be more truly the images of these airfoils. This suggests replacement of the Joukowski
map in the method of Zedan (1990) with the generalized Karman-Trefftz map that has a
parameter that controls the trailing edge angle and includes the Joukowski map as a special
case. This research paper therefore intends to explore this modified approach by applying it
to the NACA 4412 airfoil at two different flow angles of attack and measuring its
performance by comparing its values with those of the original method of Zedan
(1990) using NACA experimental data as yardstick. We shall also be interested in the results
on the modified NACA 4412 which is done by adjusting the coefficient in the
formula for thickness to have the value . This modification results in the least
GSJ© 2018 www.globalscientificjournal.com
2.0 THE GENERALIZED CONFORMAL MAPPING ASPECT OF THE
METHOD OF ZEDAN FOR COMPUTATION OF THE LIFT AND PRESSURE DISTRIBUTION ON ARBITRARY AIRFOILS
In this modified approach, an inverse of the Karman-Trefftz transformation defined by
Mateescu and Abdo (2005) as
(
) ( ) (1)
Where is the trailing edge angle of the airfoil, is now used to transform an arbitrary airfoil
with its tail at the point in the plane on to a pseudo circle in the plane. The
constant in equation (1) is estimated as ⁄ of the distance between the trailing edge and a
point mid way between the leading edge and the centre of curvature of the nose. The leading
edge radius of the the NACA 4412 airfoil is given by Abbot and Von Doenhoff (1959) as
, where is the maximum thickness of the airfoil.The centroid of the pseudo circle
in the plane is then determined using the approximation given by Bj rn (2006) and the
axes of the plane are translated to and rotated by angle so that the real axis is in the
direction of the free stream. The coordinate plane obtained following axes translation and
rotation is called the plane. The translation of axes and rotation by angle is equivalent to
the transformation
( ) (2)
GSJ© 2018 www.globalscientificjournal.com
The relationship between the velocities at points in the plane of the airfoil to the
corresponding points in the plane of the pseudo circle is derived as
| | | | | | (3)
where
( ( ) ( ) [( ) ( ) ] )
(4)
and
| | (5)
from equations (1) and (2). Notice from equation (3) that the singularity is a source
of error for the computation of the velocity field and hence pressure distribution on the
airfoil.
To compute , the method assumes a solution for the complex potential ( ) of the flow
past the pseudo circle as
( ) ∑ (6)
where the coefficients of the series in the second term ( ). The
first term in equation (6) represents a uniform flow with free stream velocity of magnitude
, the infinite series in the middle represents a doublet at the origin and the higher order
terms to account for the deviation from an exact circle. The last term represents a vortex flow
with circulation taken clockwise.
The complex velocity
∑ (7)
is analytic everywhere except at the origin; the point . This singularity is within the
contour of the pseudo circle and therefore posses no problem to the method since the flow
GSJ© 2018 www.globalscientificjournal.com
plane of the pseudo circle also satisfies the infinity boundary condition in equation (7); that
is,
| | .
If ( ) and in equaton (6) , then
∑ { ( ) ( )} ( ) (8)
The function is the stream function of the flow. Setting the stream function to a constant
generates the streamlines of the flow. Let denote the stream line corresponding to the
flow on the boundary of the pseudo circle. On applying the condition of constant stream line
to equation (8) and noting that since is finite, the infinite series on the right hand side of
the equation must converge, the equation then takes the form
∑ ( ) ∑ ( ) ( ) (9)
on retaining a limited number of terms , say , in the series.Since the derivative of the
complex potential yields the conjugate of the velocity field, if we let
then we have on retaining the first terms of the infinite series in equation (7), that
( ) ∑ ( ( ) ) ∑ ( ( ) ) (10)
( ) ∑ ( ( ) ) ∑ ( ( ) ) (11)
The Kutta condition requires that the trailing edge is a stagnation point where the fluid
velocity vanishes identically (Anderson, 1991); that is, . Thus,
∑ ( ( ) ) ∑ ( ( ) ) (
)
(12)
∑ ( ( ) ) ∑ ( ( ) ) (
GSJ© 2018 www.globalscientificjournal.com
Determination of the series coefficients ( ), circulation , and the
pseudo circle streamline , is done by taking control points on the contour of the pseudo
circle and applying the condition of constant streamline given by equation (9) and the Kutta
condition represented by equations (12) and (13). These control points are selected by the
cosine spacing of the closed interval to obtain the airfoil coordinates which are
then projected onto the pseudo circle by the inverse Karman-Trefftz map. Alternatively, the
coefficients ( ) , and constant stream line are
determined by applying equation (9) to a number of control points on the boundary
of the pseudo circle, where is low and is relatively large, to obtain an over determined
system of equations. This system is then solved using a least square error minimization
scheme. The determined values of the coefficients ( ) and circulation
are substituted in equations (10) and (11) to obtain the components of the velocity
vector on the surface of the pseudo circle. The total velocity is then evaluated as
| | √ (14)
The velocity on the surface of the airfoil can now be computed in terms of using
equation (3). Finally the pressure coefficient distribution is obtained using the formula
given by Deglaire (2008) and Anderson (1991) as
( ) (15)
The lift coefficient is computed using the formula given by Anderson (1991) and Karamcheti
(1966) as
GSJ© 2018 www.globalscientificjournal.com
where is the airfoil length and is the value of circulation computed from the system of
equations.
3.0 COMPARISON OF THE LIFT COEFFICIENT DATA FOR THE NACA 4412
AIRFOIL BETWEEN THE MODIFIED ZEDAN AND ZEDAN’S METHOD
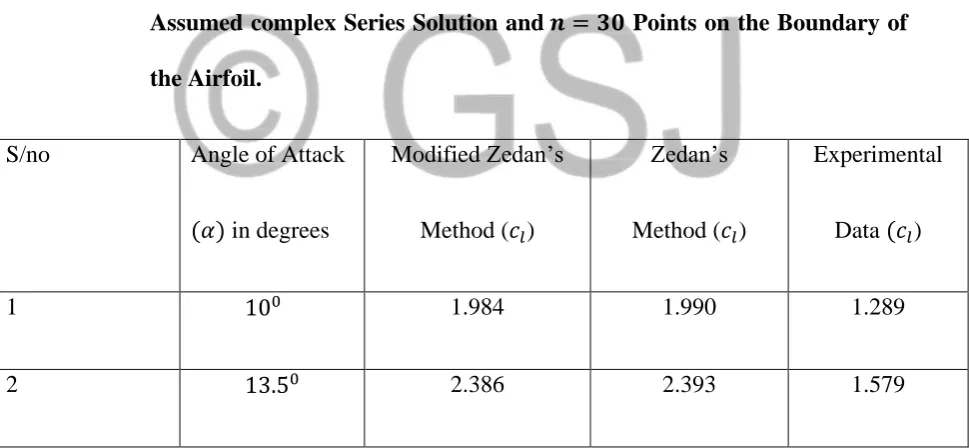
Tables 1 show comparisons between the lift coefficient as a function of the angle of attack on
the NACA 4412 airfoil for the modified method of Zedan, Zedan’s method, and experiment
(Pinkerton, 1936), respectivey, while Table 2 are results on the modified airfoil.The
presented in the tables and indeed the entire paper were generated taking terms in the
assumed complex series solution and points on the boundary of the pseudo circle.
Table 1: Lift Coefficients for the NACA 4412 Airfoil taking terms in the Assumed complex Series Solution and Points on the Boundary of the Airfoil.
S/no Angle of Attack
( ) in degrees
Modified Zedan’s
Method ( )
Zedan’s
Method ( )
Experimental
Data ( )
1 1.984 1.990 1.289
2 2.386 2.393 1.579
GSJ© 2018 www.globalscientificjournal.com
S/no Angle of Attack
( ) in degrees
Modified Zedan’s
Method ( )
Zedan’s
Method ( )
Experimental
Data ( )
1 1.707 1.708 1.289
2 2.113 2.115 1.579
Observe from Tables 1 and 2 that in either form of the airfoil’s shape the predicted values
by both methods do not accurately predict the experimental value with higher deviations
occurring in the case of the NACA 4412 airfoil.This is due to the fact that the theory does not
take into consideration the effects of the viscous boundary layer. However, the values
predicted by the modified method of Zedan (1990) are certainly a reasonable improvement
over those of Zedan’s method moreso that the portion of the airfoil under consideration is
small.
4.0 COMPARISON OF THE PRESSURE COEFFICIENT DISTRIBUTION DATA
FOR THE NACA 4412 AIRFOIL BETWEEN THE MODIFIED ZEDAN AND ZEDAN’S METHOD
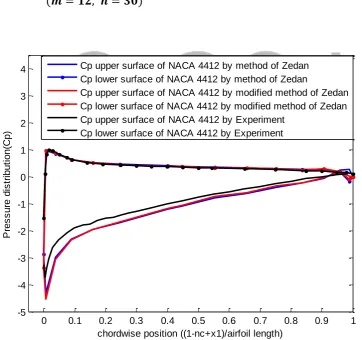
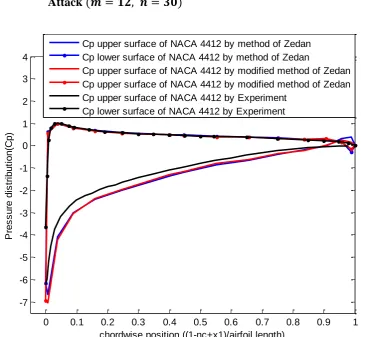
Figures 1 and 2 show MATLAB plots of the pressure coefficient distribution as a function of
chordwise position for the NACA 4412 at flow angles of attack and ,
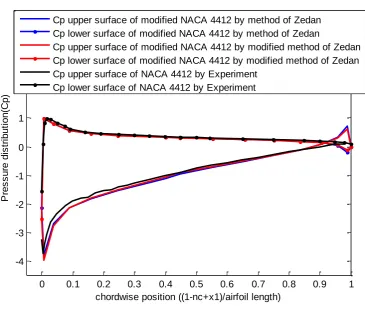
respectively, by the modified Zedan’ method, Zedan’s method, and experiment, while figures
3 and 4 are predictions on the modified NACA 4412 airfoil at and ,
respectively. Figures 1 and 2 show that the prediction of pressure distribution by both
methods on the lower surface of the NACA 4412 airfoil is fairly good except at and around
GSJ© 2018 www.globalscientificjournal.com
Figure 1: Pressure Distribution for the NACA 4412 Airfoil at Angle of Attack ( )
0 0.1 0.2 0.3 0.4 0.5 0.6 0.7 0.8 0.9 1
-5 -4 -3 -2 -1 0 1 2 3 4
chordwise position ((1-nc+x1)/airfoil length)
P
re
s
s
u
re
d
is
tr
ib
u
ti
o
n
(C
p
)
Cp upper surface of NACA 4412 by method of Zedan Cp lower surface of NACA 4412 by method of Zedan
Cp upper surface of NACA 4412 by modified method of Zedan Cp lower surface of NACA 4412 by modified method of Zedan Cp upper surface of NACA 4412 by Experiment
GSJ© 2018 www.globalscientificjournal.com
Figure 2: Pressure Distribution for the NACA 4412 Airfoil at Angle of Attack ( )
0 0.1 0.2 0.3 0.4 0.5 0.6 0.7 0.8 0.9 1
-7 -6 -5 -4 -3 -2 -1 0 1 2 3 4
chordwise position ((1-nc+x1)/airfoil length)
P
re
s
s
u
re
d
is
tr
ib
u
ti
o
n
(C
p
)
Cp upper surface of NACA 4412 by method of Zedan Cp lower surface of NACA 4412 by method of Zedan
Cp upper surface of NACA 4412 by modified method of Zedan Cp upper surface of NACA 4412 by modified method of Zedan Cp upper surface of NACA 4412 by Experiment
GSJ© 2018 www.globalscientificjournal.com
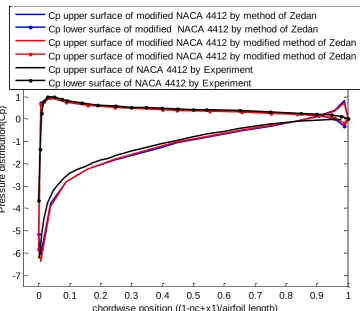
Figure 3: Pressure Distribution for the Modified NACA 4412 Airfoil at Angle of Attack ( )
0 0.1 0.2 0.3 0.4 0.5 0.6 0.7 0.8 0.9 1
-4 -3 -2 -1 0 1 2 3 4
chordwise position ((1-nc+x1)/airfoil length)
P
re
s
s
u
re
d
is
tr
ib
u
ti
o
n
(C
p
)
Cp upper surface of modified NACA 4412 by method of Zedan Cp lower surface of modified NACA 4412 by method of Zedan
Cp upper surface of modified NACA 4412 by modified method of Zedan Cp lower surface of modified NACA 4412 by modified method of Zedan Cp upper surface of NACA 4412 by Experiment
GSJ© 2018 www.globalscientificjournal.com
Figure 4: Pressure Distribution for the Modified NACA 4412 Airfoil at Angle of Attack ( )
0 0.1 0.2 0.3 0.4 0.5 0.6 0.7 0.8 0.9 1
-7 -6 -5 -4 -3 -2 -1 0 1 2 3 4
chordwise position ((1-nc+x1)/airfoil length)
P
re
s
s
u
re
d
is
tr
ib
u
ti
o
n
(C
p
)
Cp upper surface of modified NACA 4412 by method of Zedan Cp lower surface of modified NACA 4412 by method of Zedan
Cp upper surface of modified NACA 4412 by modified method of Zedan Cp upper surface of modified NACA 4412 by modified method of Zedan Cp upper surface of NACA 4412 by Experiment
GSJ© 2018 www.globalscientificjournal.com
Unfortunately, the predictions of the the pressure coefficient distribution on the lower airfoil
surfaces is not so good. However, when the airfoil is modified the predictions of pressure
coefficient distribution by both methods now agree better with experiment as is evident from
figures 3 and 4. From the pressure distribution curves it is clear that the prediction of pressure
coefficient distribution by both methods agree closely. This is not surprising since the lift
coefficients predicted by both methods are approximately equal. A more careful observation
of the pressure distribution curves, particularly on the lower airfoil surfaces in the figures,
reveals that the prediction of the pressure coefficient distribution at and around the leading
edge region by the method of Zedan (1990) is better than that of the modified Zedan’s
method. However, over a far wider range along chorwise position of the airfoil, the prediction
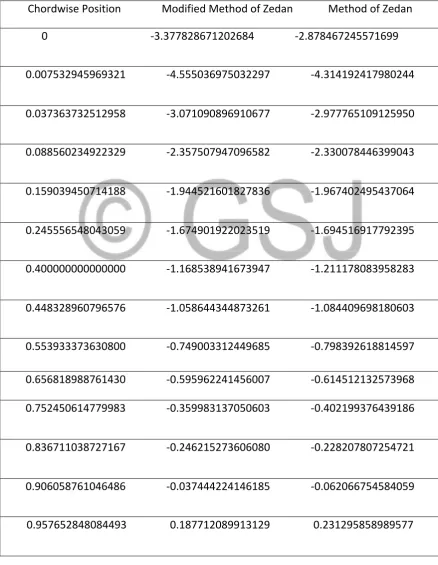
of pressure distribution by the generalized method is better. This is further expressed in Table
1 which shows comparison between the data along the lower surface of NACA 4412
GSJ© 2018 www.globalscientificjournal.com
Table 1: Pressure Coefficient Distribution along Lower surface of NACA 4412 Airfoil at Angle of Attack
Chordwise Position Modified Method of Zedan Method of Zedan
0 -3.377828671202684 -2.878467245571699
0.007532945969321 -4.555036975032297 -4.314192417980244
0.037363732512958 -3.071090896910677 -2.977765109125950
0.088560234922329 -2.357507947096582 -2.330078446399043
0.159039450714188 -1.944521601827836 -1.967402495437064
0.245556548043059 -1.674901922023519 -1.694516917792395
0.400000000000000 -1.168538941673947 -1.211178083958283
0.448328960796576 -1.058644344873261 -1.084409698180603
0.553933373630800 -0.749003312449685 -0.798392618814597
0.656818988761430 -0.595962241456007 -0.614512132573968
0.752450614779983 -0.359983137050603 -0.402199376439186
0.836711038727167 -0.246215273606080 -0.228207807254721
0.906058761046486 -0.037444224146185 -0.062066754584059
GSJ© 2018 www.globalscientificjournal.com
0.989434997013202 0.016518421015997 0.257609866939174
1.000166526287315 0.219076290518619 0.522027014917768
5.0 CONCLUSION
In this research paper the conformal mapping aspect of the method of Zedan (1990) is
modified by replacing the inverse Joukowski map in the method by an inverse of the
Karman-Trefftz map to also account for the nonzero angles at the trailing edge of real airfoils.
The modified method has given reasonable predictions on the and for the NACA 4412
and modified NACA 4412 airfoils and has outperformed the original version of the method
GSJ© 2018 www.globalscientificjournal.com
REFERENCES
Abbot, I. H. and Von Doenhoff, A. E. (1959). Theory of Wing Sections Including a Summary of Airfoil Data. Dover Publications Inc, New York, pp.359-516
Anderson, J. K. (1991). Fundamentals of Aerodynamics. McGraw-Hill, New York, pp. 93-275
Bj rn, R. (2006). Conformal Mapping Potential Flow around a Wing SectionUsed as a Test Case for the Inviscid Part of Rans Solvers. Paper presented at the European Conference on Computational Fluid Dynamics, TU Delft, The Netherlands.
Deglaire, P., Ågren, O., Bernhoff, H. and Leijon, M. (2008). Conformal Mapping and Efficient Boundary Element Method without Boundary Elements for Fast Vortex Particle Simulations. European Journal of Mechanics B/Fluids 27: 150-176.
Gómez, A. and Álvaro, P. (2006). Aerodynamic Characteristics of Airfoils with Blunt Trailing Edges. Aerodinámica, Perfiles Aerodinámicos, CFD, EnergíaEólica, Aerogeneradores. :23-33.
Kapania, N. R., Terracciano, K. and Taylor, S. (2008). Modelling the Fluid Flow Around Airfoils Using Conformal Mapping. Society for Industrial and Applied Mathematics
1:70-99.
Karamcheti, K. (1966). Principles of Ideal-Fluid Aerodynamics. John Wiley and Sons, New York, pp. 312-627
Nico, C. A. (2012). Studying the Effect of Boundary Layer Suction. Unpublished master’s thesis, Delft University of Technology, The Netherlands.
Pinkerton, R. M. (1936). Calculated and Measured Pressure Distributions Over the Midspan Section of the NACA 4412 Airfoil, NACA Report No. 563.
Mateescu, D. and Abdo, M. (2005). Efficient Second-Order Analytical Solutions for Airfoils in Subsonic Flows. Aerospace Science and Technology. 9: 110-115.
Zedan, M. F. (1990), Series-Complex Potential Solution of Flow around Arbitrary airfoils.