Key words:Acuros XB, Anisotropic Analytical Algorithm, Prostate Cancer, TCP, NTCP, RapidArc..
Calculation Algorithm on Low-Risk Prostate Cancer
Treatment Plans Created by RapidArc Technique.
1,2Suresh Rana, M.S., 2Kevin Rogers, M.S.
1Department of Medical Physics, ProCure Proton Therapy Center, 5901 West Memorial Road, Oklahoma City, OK 73142, USA. 2Department of Radiation Oncology, Arizona Center for Cancer Care, 14155 N 83rd Avenue, #127, Peoria, Arizona 85381, USA.
Algorithm (AAA). Next, AXB plans were created by performing dose re-calculation using AXB for same number of monitor units and identical beam set up as in the corresponding AAA plans. Radiobiological modeling response evaluation was done by calculating Niemierko’s Equivalent Uniform Dose (EUD)-based Normal Tissue Complication Probability (NTCP) and Tumor Control Probability (TCP) values. Additionally, the PTV coverage in AXB and AAA plans was evaluated.
Results: The averaged TCP values of AAA plan (98.39%) and AXB plans (98.26%) were comparable with difference of 0.14% (P = 1.580 × 10⁻⁷). The averaged NTCP values
for bladder (P = 0.265) and femur heads (P = 0.281) were well below 0.1 % with no statistical significant differences. However, the averaged NTCP values for the rectum of 0.56 % (AAA) vs. 0.48 % (AXB) suggested the statistical significance (P = 8.741 × 10⁻³). The PTV coverage in AXB plans was
lower by an average 0.89% compared to AAA plans with no statistical significance (P = 0.254).
Conclusion: Both the AAA and AXB predicted comparable NTCP and TCP values for low-risk prostate cancer plans created by RapidArc technique. The reduced PTV coverage due to dose re-calculation from AAA to AXB was observed.
ABSTRACT
Objective: The purpose of this study was to assess the radiobiological impact of Acuros XB dose calculation algorithm (AXB) on prostate cancer treatment plans created by RapidArc technique.
INTRODUCTION
RapidArc (Varian Medical Systems, Palo Alto, CA) is a volumetric arc therapy (VMAT) technique that delivers modulated radiation beams with simultaneous adjustment of multi-leaf collimator (MLC) field aperture, dose rate and gantry rotation speed.1, 2 The radiation dose distributions from RapidArc planning are conformal to the tumor while minimizing to the surrounding critical structures.1, 2 One of the major components that plays a crucial role in the resultant dose distribution and extent of tumor dose heterogeneity is the dose calculation algorithm.3 Thus, in order to achieve the best therapeutic advantage from RapidArc planning for prostate cancer, media heterogeneities in the photon beam path must be incorporated in the dose calculation algorithm. Moreover, the incident of modulated radiation beams from different directions results in dose heterogeneity within the tumor and small volumes of normal tissues receive doses higher than the prescribed dose.3
Several authors have investigated the treatment planning for prostate cancer4, 5, 6, 7, 8, 9 and reported the inconsistent dosimetric results mainly due to the variations found among these studies in terms of target shape, planning target volume (PTV) margins, planning techniques and objectives, beam angles, plan optimization methods and choice of dose calculation algorithm.4−9 To the best of our knowledge, no previous study has been done on prostate cancer treatment plans investigating the radiobiological impact of commercially available new dose calculation algorithm called Acuros XB algorithm (AXB). Thus, it is important to further investigate how the choice of AXB in RapidArc planning will affect the radiobiological parameters for prostate cancer before using the AXB for real patient treatment cases.
The objective of this study was to asses the radiobiological impact of AXB using real computed tomography (CT) data sets of low-risk prostate cancer patients. No comparison between AXB calculations and measurements or Monte Carlo simulations was exploited in this study. However, for the purpose of comparison, the results from prostate cancer treatment plans calculated by Anisotropic Analytical Algorithm (AAA) were used as the standard since AAA is widely tested and validated for radiation dose calculation. Both algorithms (AXB and AAA) are implemented within the Eclipse treatment planning system (TPS) (Varian Medical Systems, Palo Alto, CA).
METHODS AND MATERIALS
CT Simulation
Ten patients with localized prostate cancer underwent through the AnchorMarker-fiducial markers (Biocompatibles, Inc., Oxford, CT) placement performed by the radiation oncologist at our cancer center. Prior to CT simulation, the patients were immobilized in a supine position on a flat tabletop of General Electric LightSpeed CT Scanner using head sponge and vac-lok cushions (CIVCO Medical Solutions, Kalona, Iowa). The CT scans were acquired with 512×512 pixels at 0.25 cm slice spacing from the top of the iliac crests superiorly to the perineum inferiorly. All the CT images were verified by the radiation oncologist before transferring them via computer network to the Eclipse TPS for subsequent contouring and planning purposes
Contouring
The clinical target volume (CTV) comprised of prostate and seminal vesicles were contoured by the radiation oncologist on the axial CT slices. The organs at risk (OARs) such as rectum, bladder and femur heads were delineated based on the CT images. The planning target volume (PTV) was generated from the CTV by an isotropic expansion of 5 mm in all directions to compensate for the variability of treatment setup and internal organ motion. A shell-shaped avoidance structure called “Ring” was created at a distance of 5 mm from the PTV for the plan optimization process in order to achieve the conformal dose plans.
TREATMENT PLANNING AND
OPTIMIzATION
Dose Prescription and Dose Constraints
Treatment Plan Setup
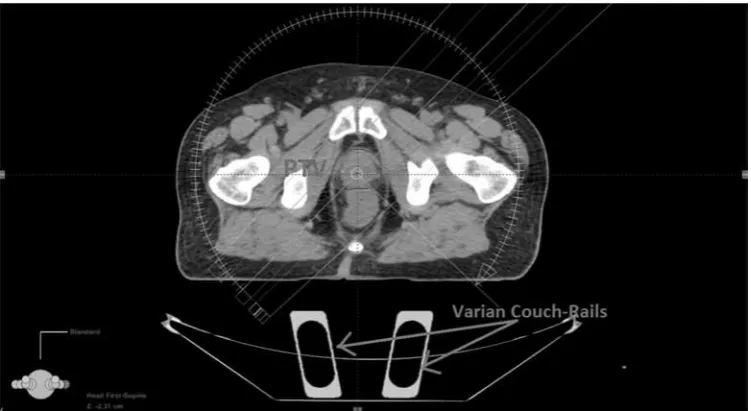
The beam parameters for prostate cancer treatment plans were set up in the Eclipse TPS (version 10.0.26) using Varian Clinac iX with 120-leaf millennium MLC and 6X mode of 600 MU/min dose rate. All treatment plans were generated using a single coplanar arc and the Beam’s-Eye-View graphics in Eclipse TPS was used to define the field sizes. The isocenter of each treatment plan was placed at the center of prostate (Figure 1).
Treatment Plan Optimization
All treatment plans were generated using the volumetric dose optimization method that followed the same systematic strategy in regarding objectives and priorities,
which are summarized in TABLE 2.
DOSE CALCULATION
In this study, the plans computed by AAA and AXB (both include same version 10.0.26) are referred as AAA and AXB plans respectively. First, initial dose calculation of the optimized plans was performed by AAA. The AAA plans were then normalized such that 100% of the prescribed dose covers the 95% of the PTV (V100 = 95%), and monitor units (MUs) from the normalized AAA plans were recorded. Second, the AXB plans were calculated using the identical beam setup and same number of MUs as in the normalized AAA plans. The dose calculation grid was set to 2.5 mm for all cases. TABLE 1: Dose specification for OARs
Normal Organ Limit* D15% D25% D35% D50%
Rectum < 75 Gy < 70 Gy < 65 Gy < 60 Gy
Bladder < 80 Gy < 75 Gy < 70 Gy <65 Gy
Femoral Heads Mean Dose < 45 Gy
*Normal organ limit refers to the volume of that organ that should not exceed the dose limit. Abbreviations: OAR = Organ at risk, Dx% = Dose received by X% of total OAR volume, where X % = 15, 25, 35 and 50.
Since this study was focused on real clinical usage of AAA and AXB, only brief introduction of dose calculation algorithms are presented. The AXB, first published by Vassiliev et al.,10 solves numerically Linear Boltzmann Transport Equation (LBTE) which describes the macroscopic behavior of radiation particles as they travel through and interact with matter. The AXB is considered to be similar to classic Monte Carlo methods for accurate modeling of dose deposition in heterogeneous media.10, 11, 12 Since AXB explicitly solves for radiation transport in materials, the by default dose reporting mode in AXB is dose-to-medium (Dm) and we selected Dm for all the AXB calculations in this study.
The AAA, first developed by Ulmer et al.,13, 14 and Tillikainen et al.15, 16 is an analytical photon dose calculation algorithm based on a pencil-beam convolution/superposition technique. The beam model for AAA include separately-modeled contributions from three different photon sources13−16 and the tissue heterogeneity is handled by radiologic scaling of primary photons and photon scatter kernel scaling in lateral directions according to local electron density.13−16 For more detailed descriptions on the AAA and AXB, readers are advised to refer to publications by Tillikainen et al.15, 16 and Vassilev et al.10
RADIOBIOLOGICAL MODELING
For radiobiological model response evaluation, cumulative dose-volume histograms (DVHs) of calculated treatment plans (AAA and AXB) were exported from the Eclipse TPS using dose bins of 40 cGy. The MATLAB and Simulink Student Version -R2012a (The MathWorks,
Inc., Natick, Massachusetts) was used for radiobiological modeling analysis. We utilized the MatLab program17 to calculate the Niemierko’s Equivalent Uniform Dose (EUD)-based Normal Tissue Complication Probability (NTCP) and Tumor Control Probability (TCP) values. The Niemierko’s phenomenological model was based on the original definition of the EUD that was derived on the basis of a mechanistic formulation using a linear-quadratic (LQ) cell survival model.17, 18
According to Niemierko’s phenomenological model, EUD17, 19 is defined as
(
)
(
1)
1a a EUD v EQDi i
i
= ∑
= (1)
This model can be used for both tumors and normal tissues. In equation (1), a is a unit less model parameter that is specific to the normal structure or tumor of interest, and vi is unit less and represents the i’th partial volume
receiving dose Di in Gy. Since the relative volume of the whole structure of interest corresponds to 1, the sum of all partial volumes vi will equal 117 Furthermore, in equation (1), EQD19 is the biologically equivalent physical dose of 2 Gy and defined as:
2 D n f EQD D
α β α β + = ×
+
(2)Table 2: Parameters used to calculate Niemierko’s EUD-based TCP and NTCP
Tissue Volume Type 100% dpf #f a γ50 TD50(Gy) TCD50(Gy) Dpf(Gy) α/β(Gy)
Prostate Tumor 1.8 44 -10 1.0 - 28.34 2 1.20
Rectum Normal 1.8 44 8.33 4 80 - 2 3.90
Bladder Normal 1.8 44 2 4 80 - 2 8.00
Femur Normal 1.8 44 4 4 65 - 2 0.85
where, nf and df = D/nf are the number of fractions and dose per fraction size of the treatment course, respectively. The α/β is the tissue-specific LQ parameter of the organ being exposed19
TUMOR CONTROL PROBABILITy
Niemierko’s EUD-based TCP17, 19 is defined as
1 50 50 1
TCP
TCD EUD
γ =
+
(3)where, TCD50 is the tumor dose to control 50% of the tumors when the tumor is homogeneously irradiated and the γ50 is a unit less model parameter that is specific to the tumor of interest and describes the slope of the dose response curve.17
Malignant tumor targets generally have large negative values of a.19, 20 In this study, we chose a = -10 which was reported by Oinam et al.19 Other EUD-based TCP parameters (Table 3) used in this study are based on the data published by Okunieff et al.21 For prostate tumor, the alpha/beta value of 1.2 Gy22 was selected for this study.
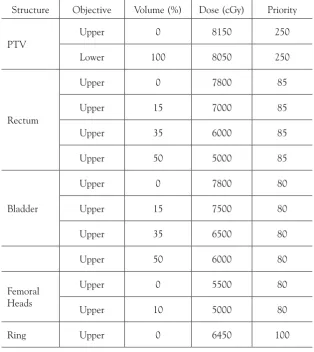
TABLE 3: Dose-volume constraints and priorities used for optimization of RapidArc prostate plan
Structure Objective Volume (%) Dose (cGy) Priority
PTV
Upper 0 8150 250
Lower 100 8050 250
Rectum
Upper 0 7800 85
Upper 15 7000 85
Upper 35 6000 85
Upper 50 5000 85
Bladder
Upper 0 7800 80
Upper 15 7500 80
Upper 35 6500 80
Upper 50 6000 80
Femoral Heads
Upper 0 5500 80
Upper 10 5000 80
Ring Upper 0 6450 100
NORMAL TISSUE COMPLICATION
PROBABILITy
Niemierko’s EUD-based NTCP17, 19 is defined as
1 50 50 1
NTCP
TD EUD
γ =
+
(4)where, TD50 is the tolerance dose for a 50% complication rate at a specific time interval (e.g., 5 years in the Emami et al. normal tissue tolerance data23) when the whole organ of interest is homogeneously irradiated. The γ50 is a unit less model parameter that is specific to the normal structure of interest and describes the slope of the dose response curve17, 19, 21
Since parameter a and the Lyman model parameter n are related by a =1/n,19, 20 the values for a and TD50 were obtained from the Emmai-Burman parameters for NTCP calculations.24 The same model parameter γ
50 = 4 was used for all OARs.19 For bladder, Stewart et al.25 published a high value for the alpha/beta ratio, in the region of 5 to 10 Gy, and we chose to investigate for alpha/beta = 8 Gy. The alpha/beta values for femur heads (0.85) and rectum (3.9) were taking from the studies of Withers et al.26 and Deore et al.27 respectively.
STATISTICAL ANALySIS
The statistical analysis was done using two-sided student’s t-test in a Microsoft Excel spreadsheet, and P
value of less than 0.05 (i.e., P < 0.05) was considered to be statistically significant.
RESULTS AND DISCUSSION
In this radiobiological model response study, we compared two dose calculation algorithms (AAA and AXB) that were used to calculate the dose for low-risk prostate cancer treatment plans created by RapidArc technique.
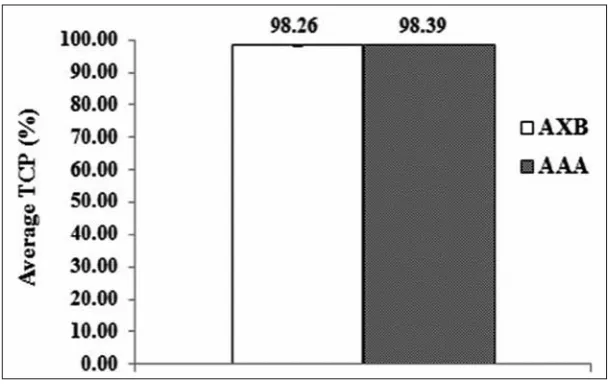
Figure 2 shows the Niemierko’s EUD-based TCP value averaged over the ten analyzed patients for AXB and AAA plans. For the localized prostate cancer at Stages T0 and T1, the average TCP values of AAA plans (98.39 ± 0.06 %) and AXB plans (98.26 ± 0.05%) were comparable with average difference of 0.14%. Although the comparison between the TCP values of AAA and AXB plans showed the statistical significance (P = 1.580 × 10⁻⁷), the difference (0.14%) between them is unlikely to be clinically significant.
Figure 2: The EUD-based average TCP from DVHs of AAA and AXB plans.
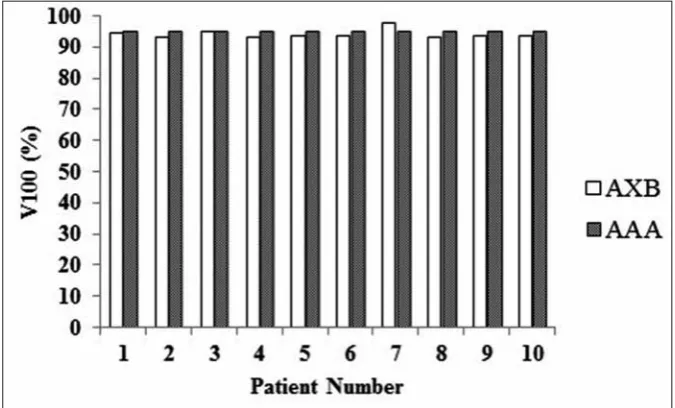
Figure 3: The PTV coverage by 100 % of the prescribed dose of 79.2 Gy in AAA and AXB plans. Abbreviations: PTV = Planning Target Volume, V100 (%) = Percentage of PTV covered by 100% of the prescribed dose, AAA = Anisotropic Analytical Algorithm, AXB = Acuros XB Algorithm.
For the purpose of discussion, the percentage of PTV covered by 100% of the prescribed dose (V100) due to dose re-calculation from AAA to AXB was studied. Figure 3 shows the V100 for the ten individual prostate cancer patients in AAA and AXB plans. The averaged V100
of AXB plans (average: 94.15%; range: 93.1−97.9%) was slightly lower than the V100 of AAA plans (95%). However, the V100 values of AAA and AXB were differed by an average of 0.89%, which is a smaller value compared to its standard deviation (±1.47%), and the difference did not show the statistical significance (P = 0.254).
Table 4 summarizes the Niemierko’s EUD-based NTCP values averaged over the ten analyzed patients in the AAA and AXB plans. The averaged bladder NTCP values were very small for both the AAA (5.69 × 10⁻⁴ %) and AXB (4.17 × 10⁻⁴ %), and the difference was not statistically
Table 4: EUD-based average NTCP values from DVHs of AAA and AXB plans
Organ NCTP AAA AXB P
(Avg. ± SD) % (Avg. ± SD) %
Rectum NTCP 0.56 ± 0.51 0.48 ± 0.47 8.741 × 10⁻³
Bladder NTCP 5.69 × 10⁻⁴ ± 1.53 × 10⁻³ 4.17 × 10⁻⁴ ± 1.13 × 10⁻³ 0.265 Femur NTCP 8.28 × 10⁻⁵ ± 2.29 × 10⁻⁴ 4.72 × 10⁻⁵ ± 1.33 × 10⁻⁴ 0.281
Abbreviations: EUD = Equivalent Uniform Dose, NTCP = Normal Tissue Complication Probability, DVH = Dose-Volume Histogram, AAA = Anisotropic Analytical Algorithm, AXB = Acuros XB Algorithm; Avg. = Average, SD = Standard Deviation, Femur = Femur Heads
* = statistically significant p-value calculated with two-sided Student’s t-test (Values are averaged over the 10 analyzed patients)
significant (P = 0.265). Again, for femur heads, the averaged NTCP values of AAA (8.28 × 10⁻⁵ %) and AXB (4.72 × 10⁻⁵ %) were very low and the difference between their values was not statistically significant (P
= 0.281) either. However, the averaged NTCP values for the rectum of 0.56 % (AAA) vs. 0.48 % (AXB) suggested the statistical significance (P = 8.741 × 10⁻³).
In this study, both the AXB and AAA demonstrated comparable TCP and NTCP values; however, the difference between the results of AXB and AAA may become clinically significant for high-risk prostate cancer that generally involves radiation doses to the lymph nodes as well as to the larger volume of tissues with different densities such as pelvic bone, bladder, femur heads and rectum. Thus, the more accurate dose calculation algorithm plays an important role in avoiding the MU miscalculation which will result into dose overestimation or underestimation during the actual patient treatment. It is essential to further investigate the limitations of AXB before using it for real patient treatment cases because the dose underestimation may increase the local disease recurrence, whereas the dose overestimation will likely increase the normal tissue toxicities. The presence of metallic hip prosthesis and its effect on the TCP and NTCP due to dose recalculation from AAA to AXB will be an interesting topic for future studies.
Although we could not find the literature to make the direct comparisons against our radiobiological modeling study data for prostate cancer treatment plans created with RapidArc technique, it is relevant to mention two previous radiobiological modeling studies done on prostate cancer.28, 29 In the study by Vlachaki et al.,28 the averaged TCP values were 99.52% and 97.92% using 3D conformation radiation therapy (3DCRT) and intensity modulation radiation therapy (IMRT) respectively. In the study by Luxton et al.,29 the averaged NTCP values for rectum were 1.7% for IMRT vs. 3.2% for 3DCRT, and these values were later confirmed by Vlachaki et al.28 By using RapidArc technique in our study, rectum NTCP values were found to be less than 1% for both the AAA and AXB. Both the previous studies28, 29 reported NTCP values of bladder and femur heads below 0.1%. Similar findings were observed in our study for NTCP values of bladder and femur heads being well below 0.1%.
CONCLUSION
Both the AAA and AXB predicted comparable NTCP and TCP values for low-risk prostate cancer plans created
by RapidArc technique. In comparison to AAA, the AXB produced slightly lower PTV coverage by average 0.89% due to dose recalculation from AAA to AXB.
Conflict of Interest: None
REFERENCES
1. Ling CC, zhang P, Archambault y, Bocanek J, Tang G, Losasso T. Commissioning and quality assurance of RapidArc radiotherapy delivery system. Int J Radiat Oncol Biol Phys 2008; 72:575–81 2. Tang G, Earl MA, Luan S, Wang C, Mohiuddin MM, yu CX.
Comparing radiation treatments using intensity-modulated beams, multiple arcs, and single arcs. Int J Radiat Oncol Biol Phys 2010; 76:1554–62
3. Goitein M, Niemierko A. Intensity modulated therapy and inhomogeneous dose to the tumor: A note of caution Int J Radiat Oncol Biol Phys 1996; 36:519-522
4. Kjaer-Kristoffersen F, Ohlhues L, Medin J, Korreman S. RapidArc volumetric modulated therapy planning for prostate cancer patients. Acta Oncol 2009; 48:227–32
5. Palma D, Vollans E, James K, Nakano S, Moiseenko V, Shaffer R, McKenzie M, Morris J, Otto K . Volumetric modulated arc therapy for delivery of prostate radiotherapy: Comparison with intensity-modulated radiotherapy and three-dimensional conformal radiotherapy. Int J Radiat Oncol Biol Phys 2008; 72: 996–1001 6. Guckenberger M, Richter A, Krieger T, Wilbert J, Baier K, Flentje
M. Is a single arc sufficient in volumetric-modulated arc therapy (VMAT) for complex-shaped target volumes? Radiother Oncol 2009; 93:259–65
7. Shaffer R, Morris WJ, Moiseenko V, Welsh M, Crumley C, Nakano S, Schmuland M, Pickles T, Otto K. Volumetric modulated arc therapy and conventional intensity-modulated radiotherapy for simultaneous maximal intraprostatic boost: A planning comparison study. Clin Oncol R Coll Radiol 2009; 21:401–7 8. Wolff D, Stieler F, Welzel G, Lorenz F, Abo-Madyan y, Mai S,
Herskind C, Polednik M, Steil V, Wenz F, Lohr F. Volumetric modulated arc therapy (VMAT) vs. serial tomotherapy, step-and-shoot IMRT and 3D-conformal RT for treatment of prostate cancer. Radiother Oncol 2009; 93:226–33
9. yoo S, Wu QJ, Lee WR, yin FF. Radiotherapy treatment plans with RapidArc for prostate cancer involving seminal vesicles and lymph nodes. Int J Radiat Oncol Biol Phys 2010; 76:935–42 10. Vassiliev O, Wareing T, McGhee J, Failla G, Salehpour M,
Mourtada F. Validation of a new grid based Blotzmann equation solver for dose calculation in radiotherapy with photon beams. Phys Med Biol 2010; 55:581–598
11. Bush K, Gagne IM, zavgorodni S, Ansbacher W, Beckham W. Dosimetric validation of Acuros XB with Monte Carlo methods for photon dose calculations. Med Phys 2011; 38:2208–2221 12. Fogliata A, Nicolini G, Clivio A, Vanetti E, Mancosu P, Cozzi L.
Dosimetric validation of Acuros XB Advanced Dose Calculation algorithm: fundamental characterization in water. Phys Med Biol 2011; 56:1879–1904
13. Ulmer W, Harder D. A triple gaussian pencil beam model for photon beam treatment planning. z Med Phys 1995; 5:25–30 14. Ulmer W, Harder D. Applications of a triple gaussian pencil beam
model for photon beam treatment planning. z Med Phys 1996; 6:68–74
photon dose calculation in heterogeneous media. Phys Med Biol 2008; 53:3821–3839
16. Tillikainen L, Siljamäki S, Helminen H, Alakuijala J, Pyyry J. Determination of parameters for a multiple-source model of megavoltage photon beams using optimization methods. Phys Med Biol 2007; 52:1441–1467
17. Gay HA, Niemierko A. A free program for calculating EUD-based NTCP and TCP in external beam radiotherapy. Phys Med 2007; 23(3-4):115-25
18. Wu Q, Mohan R, Niemierko A, Schmidt-Ullrich R. Optimization of intensity-modulated radiotherapy plans based on the equivalent uniform dose. Int J Radiat Oncol Biol Phys 2002; 52: 224-35 19. Oinam AS, Singh L, Shukla A, Ghoshal S, Kapoor R, Sharma
SC. Dose volume histogram analysis and comparison of different radiobiological models using in-house developed software. J Med Phys 2011; 36:220-9
20. Qi XS, Semenenko VA, Li XA. Improved critical structure sparing with biologically based IMRT optimization. Med Phys 2009; 36(5):1790-9
21. Okunieff P, Morgan D, Niemierko A, Suit HD. Radiation dose-response of human tumors. Int J Radiat Oncol Biol Phys 1995; 32(4):1227-37
22. Brenner DJ, Martinez AA, Edmundson GK, Mitchell C, Thames HD, Armour EP. Direct evidence that prostate tumors show high sensitivity to fractionation (low alpha/beta ratio), similar to late-responding normal tissue. Int J Radiat Oncol Biol Phys 2002; 52(1):6-13
23. Emami B, Lyman J, Brown A, Coia L, Goitein M, Munzenrider JE, Shank B, Solin LJ, Wesson M. Tolerance of normal tissue to therapeutic irradiation. Int J Radiat Oncol Biol Phys 1991; 21(1):109-22
24. Burman C, Kutcher GJ, Emmai B, Goitein M. Fitting of normal tissue tolerance data to an analytic function. Int J Radiation Oncology Biol Phys 1991; 21:123-135
25. Stewart FA, Randhawa VS, Michael BD. Multifraction irradiation of mouse bladders. Radiother Oncol 1984; 2(2):131-40 26. Withers HR, Peters LJ, Taylor JM, Owen JB, Morrison WH,
Schultheiss TE, Keane T, O Sullivan B, van Dyk J, Gupta N, et al. Late normal tissue sequelae from radiation therapy for carcinoma of the tonsil: patterns of fractionation study of radiobiology. Int J Radiat Oncol Biol Phys 1995; 33(3):563-8
27. Deore S M, Shrivastava S K, Supe S J, Viswanathan PS, Dinshaw KA. Alpha/beta value and importance of dose per fraction for the late rectal and recto-sigmoid complications. Strahlenther Onkol 1993; 169(9):521-6
28. Vlachaki MT, Teslow TN, Amosson C, Uy NW, Ahmad S. IMRT versus conventional 3DCRT on prostate and normal tissue dosimetry using an endorectal balloon for prostate immobilization 2005; 30(2):69-75