Assessment of Technologies for Quasi Govt and Govt Discoms in
National Capital Region and Development of Power Distribution
Technology Implementation Index
Vipin Khurana1,Varun Prakash†, ORS Rao*
1-Associate Professor & Area Coordinator (QT) IBS Business School, Gurgaon †Sr Manager, BSES Rajdhani Power Limited (Reliance Energy)
* Vice Chancellor, ICFAI University, Jharkhand
Abstract: Power distribution system acts as a bridge between the customers and the utility. With changing times, the consumer’s expectation is not power supply to them but a reliable and quality power supply with timely redressal of complaints. With advent of IT , and mobile technologies changing of our lives , consumers expects the utilities with accurate metering and billing free from any errors with facilities like online payment of bills and from mobile applications All of these can be possible only by adopting innovative and smarter technologies to curb human intervention and provide better services to the consumers in terms of handling complains and automate the consumer’s redressal mechanism. IT and associated technologies also address in solving energy audit issues and identification of more problematic areas and which needs more focus and attention.
1.INTRODUCTION
The paper tries to access the level of technologies implementation in power distribution companies in National Capital Region and proposes a power distribution Technology Index.
2.LITERATURE REVIEW
M P Gupta(2007) et all empirically assessed the level of IT use in government organizations, and study the role of top management, IT management, user satisfaction, organizational culture, and IT use through descriptive and inferential statistics.
Meeta Dasgupta (2011) tried to bring together different aspects of technological innovation and technology strategy at North Delhi Power Ltd, Delhi which has taken various initiatives to turnaround the dilapidated power distribution industry in India. It details the various technological initiatives taken by the company to revamp the power distribution situation of the country.
Hiroshi Kashiwazaki et.al(2002) elaborates New Technologies for Electric Power Distribution Systems, the intelligent substations applying IT (information technology)
and system configurations aimed at high-speed communication. , with the incorporation of needs for the future intelligent control of substations, protection, monitoring, and communication systems that have advantages in terms of high performance, functional distribution, information-sharing and integrated power distribution management.
Kam-Hoong Cheong in his thesis on IT Strategy for utilities did extensive study on existing IT strategies within electric utilities, mostly formulated with the traditional mind-set of the industrial-age that focused primarily on technology, is inadequate and ineffective in dealing with today's IT which has a broader implication on an organization's business activities. In order to enhance the effectiveness of future IT strategy, a framework that adopts a system approach is proposed in this thesis.
P.V.Chopade B.E.Kushare Dr. D.G.Bharadwaj discusses Information Technology Solution for Power Distribution System Automation, provided IT solution which will enable the business operation at the transaction level and improve the overall quality in Decision Support System. Information Technology (IT) would thus become the foundation for sustainable reforms.
R. P. Gupta and S. C. Srivastava (2007), described the indigenous development and implementation of a Power Distribution Automation system at pilot level in Indian Institute of Technology (IIT) Kanpur, India. Electric Power Distribution Automation (DA) system is being increasingly adopted by the electric utilities to reduce the operational problems of distribution networks.
Aurobinda Basu, Surajit Banerjee, Gautam Banerjee(2006) focuses on Reduction in T&D Losses in CESC by IT based Surveillance focuses on various IT based initiatives which had led to reduction of T&D losses in Kolkata.
load factor , demand factor transmission and distribution network and tariff structure.
United Energy (2013), a Victorian power distribution Company in Melbourne, in its Distribution annual Planning Report, elaborates the company strategy in effective utilization of various technologies like GIS, SAP, SCADA, AMI etc for better services to the customers and increasing efficiency of the organization.
Robinson (2013) has effectively tries to gives the brief idea regarding the impact of electricity on economic status of people in Delhi and effectiveness of Delhi Electricity Regulatory Commission (DERC) regulation for annual/multiyear tariff rates calculation.
3.RESEARCH OBJECTIVE
To empirically evaluate the status of technology implementation among the power distribution companies by developing a comprehensive index, viz., Power Distribution Technology Index (PDTI). The paper also tries to find out correlation between the AT&C losses incurred by the power utilities over the years and automation and information technologies they have implemented in improving their system.
4.HYPOTHESIS
The through literature review of technologies used by Discoms in India as well as over the world and interaction with Discom officials at various forums and meetings led to formulation of hypothesis. The hypotheses are as follows:
Ho1- There is no difference in level of technology implementation in power distribution companies.
Ho2: There is no correlation between technology implementation index & AT&C loss of power distribution companies.
A.RESEARCH TECHNIQUES USED
The tools and techniques used in this study is mixed mode approach was adopted including qualitative analysis and grounded theory which is one of the well known qualitative analysis techniques has been used in this research. Along with grounded theory of research, few simple quantitative methods too has been used to develop technology index
GROUNDED THEORY
‘‘Grounded Theory is the study of a concept! It is not a descriptive study of a descriptive problem’’ (Glaser, 2010).‘‘Most grounded theorists believe they are theorizing about how the world is rather than how respondents see it’’ (Steve Borgatti).
A grounded theory design is a systematic, qualitative procedure used to generate a theory that explains, at a broad conceptual level, a process, an action, or an interaction about a substantive topic (Creswell, 2008).The phrase "grounded theory" refers to theory that is developed inductively from a corpus of data. ‘‘Grounded Theory is the most common, widely used, and populer analytic technic in qualitative analysis’’ (the evidence is: the number of book published on it) (Gibbs, 2010). It is mainly used for qualitative research, but is also applicable to other data (e.g., quantitative data; Glaser, 1967, chapter VIII).
The basic idea of the grounded theory approach is to read a textual database and "discover" or label variables (called categories, concepts and properties) and their interrelationships.
The data do not have to be literally textual -- they could be observations of behavior. Often they are in the form of field notes, which are like diary entries.
Types of data collections: • Interviews
• Observations • Documents • Historical Records
•
Vidoetapes1) The data collection was basically in two forms:
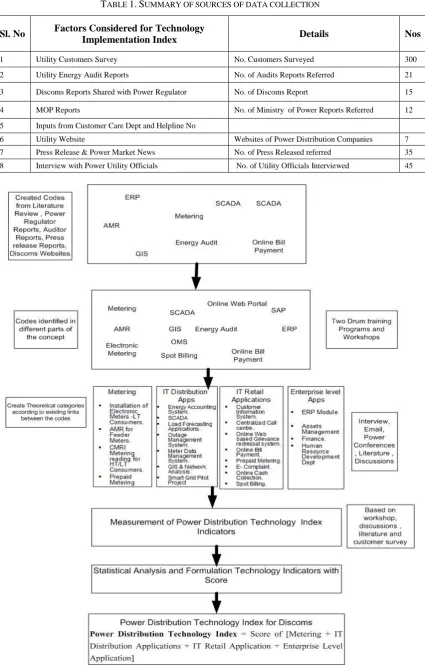
Primary Data collection: The methods of data collection were basically in form of survey, focused and unstructured interview. The researcher made use of various forums, seminars and workshop for conducting interviews and collect the data from the Discoms officials.
Secondary Data Collection: The secondary data collection mainly comprised regulatory and audit reports, information from Discoms websites etc,
TABLE 1.SUMMARY OF SOURCES OF DATA COLLECTION
Sl. No Factors Considered for Technology
Implementation Index Details Nos
1 Utility Customers Survey No. Customers Surveyed 300
2 Utility Energy Audit Reports No. of Audits Reports Referred 21
3 Discoms Reports Shared with Power Regulator No. of Discoms Report 15
4 MOP Reports No. of Ministry of Power Reports Referred 12
5 Inputs from Customer Care Dept and Helpline No
6 Utility Website Websites of Power Distribution Companies 7
7 Press Release & Power Market News No. of Press Released referred 35
8 Interview with Power Utility Officials No. of Utility Officials Interviewed 45
The author made use of MOP DRUM training program where Haryana Discoms officials came to BSES for training. The author conducted semi structure interview with Haryana Discoms officials about various technologies being currently used and technology which are at different stages of implementation. The workshop and DRUM training program interaction and semi structured interview helped in grouping of ideas and concepts.
Codes identified during earlier workshops facilitated by constant comparison between data from participants from the Discoms, data and category, category and other categories.
B.POWER DISTRIBUTION TECHNOLOGY INDEX (PDTI)
Measuring multiple dimensions of IT & an automation technology in Power distribution sector is indispensable in understanding its components, benchmarking success, and catalyzing improvement. While there have been some laudable efforts to measure wellbeing, these captures only limited aspects of technology implementation in power utility sector, and are uneven in breadth and scope across different utilities in Indian Power Sector scenario.
Power Distribution Technology Index (PDTI) is a tool designed to comprehensively measure and track the level of Information Technology (IT) and automation technologies implementation in power distribution companies. The research area currently is National Capital Region of India. The instrument designed can be used a powerful tool to measure the success and failures of different which are being implemented in power distribution sector.
The research focuses on development of Power Distribution Technology Index (PDTI) is to provide a rigorous tool to benchmark technology adoption and diffusion within utilities. Power Distribution Technology Index depends on the policy choices, investments, and implementation capabilities of multiple stakeholders— mainly utility, government, civil society, and business.
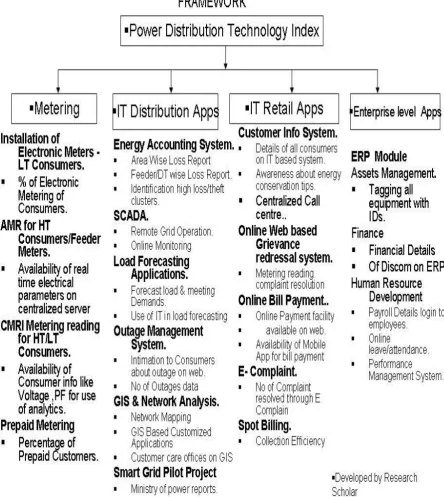
The overall definition can be disaggregated into various dimensions of Power Distribution Technology Index that define the basic architecture of the model which has been defined below:
4.DIMENSION OF POWER DISTRIBUTION TECHNOLOGY INDEX (PDTI)
The four dimensions of the of Power Distribution Technology Index roughly mirror of the progression of contemporary technologies which are being implemented in achieving automation and increasing efficiency for better customer satisfaction.
The first dimension captures the degree to level of implementation of different types of metering technologies which are the most essential part for any Power distribution company. The current scenario has witnessed the major sea change transformation in metering from mechanical meters to current prepaid meters just as we do pre paid recharge in our mobiles. The Metering technologies discussed in the research are divided into four components:
Installation of Electronic Meters -LT Consumers. AMR for HT Consumers.
AMR for Feeder Meters.
CMRI Metering reading for HT/LT Consumers. Prepaid Metering
The second dimension of Power Distribution Technology Index captures the degree to which a power utility has implemented IT (Information Technology) to address its various needs and developing Power Distribution applications. IT Distribution Apps are divided into following major components:
Energy Accounting System.
SCADA
Load Forecasting Applications. Outage Management System. Meter Data Management System. GIS & Network Analysis.
Smart Grid Pilot ProjectThe third dimension IT Retails Application confine the level customers are able to get in touch with power distribution Company for their various issues. This dimensions exhibits initiatives and ways developed by power utility to reach its consumers and how IT applications can help in solving its various issues.
The IT Retails Applications dimension is divided into the following components: Customer Information System.
Centralized Call centre.
Online Web based Grievance redressal system. Online Bill Payment.
Prepaid Metering. E- Complaint.
Online Cash Collection. Spot Billing.
The fourth dimension Enterprise Level Apps mainly arrests the degree to which power utility has implemented SAP Module or any other similar modules in assets management and its human resource details.
The Enterprise Level Applications dimension is divided into the following two components: Assets Management
Finance
Human Resource Development Dept. Performance Management System
The Power Distribution Technology Index provides the platform to assemble sets of technology implementation
It lets each power distribution companies to discover explicit areas of strength or weak point in context to technology being implemented and executed by them, as well as to benchmark them against peer power distribution.
The Power Distribution Technology Index is designed based on extensive research on technologies being implemented by power utilities and quantify in depth each components and dimensions which leads to overall score of utilities. As mentioned the Index spotlights on indicators of technology implementation results; rather than measuring inputs, the Power Distribution Technology Index focuses on what level of technology progress has already been achieved within a power utility.
5.MEASURING INDIVIDUAL COMPONENTS
Each technology identified in the research which has been used by the power Discoms are well defined in order to measure the level of technology implementation. The measurement of the technology implementation is being done using indicators against each technology.
TABLE 2:THE INDIVIDUAL INDICATORS WITHIN THE POWER DISTRIBUTION TECHNOLOGY INDEX FRAMEWORK
Sl Category Technologies Indicators Definition
1 Metering
Installation of Electronic Meters -LT Consumers
Reduction of AT&C Losses. Decrease in AT&C losses over the years
100 % Metering of Consumers. Increase
in electricity consumption % People having electronic meters
AMR for Feeder Meters Availability of real time electrical parameters on web
Automated capturing & monitoring of data from Meter
Prepaid Metering % of prepaid meters installed in the Discoms Total no of prepaid consumers by total consumers
2 IT Distribution
Apps
Energy Accounting System
Area Wise Loss Report Divisionwise/Circlewise loss report
Feeder/DT wise Loss Report. DT wise Loss Report.(Year)/Chapter)
Identification high loss/theft clusters Use of energy accounting system to identify areas/pockets with high losses
SCADA
Remote Grid Operation. Manless Grids of Discom
Online Monitoring Centralized SCADA Centre
Load Forecasting Applications Use of IT in forecasting load Load Forecasting application is being done using software or application
Meter Data Management System Existence of analytics based Reports
Prevention of theft & various reports based on data collected from meters by use of analytics
Outage Management System
Intimation to Consumers about outage on web.
Providing accurate Information on the extent of outages and number of customers affected.
Outage Data History/Causes
Identifying the location of fuse(s) or breaker(s) that operated to interrupt a circuit or portion of a circuit
No of Outages data Data Availability of no of outage area wise per day on software application .
Geographical Information System & Network Analysis
Network Mapping Network Maps availability on website
GIS Based customized applications Availability of customized GIS Applications
Customer care offices on GIS Mapping of Discom Offices.
Smart Grid Pilot Project Ministry of power reports.
3 IT Retail
Applications
Customer Information System
Time Taken for new Connection /Details of all consumers in IT system
Discom maintains all consumers details in IT module / Time taken to new connection from Discom
Awareness about energy conservation tips
Awareness among consumers to save electricity and reduce their bills.
Centralized Call Centre Round the clock customer care No Availability of Customer care no which is available round the clock
Online Bill payment
Various types of Bill payment options on website of Discom
Availability of Mobile App for Bill Payment
E Complaint No of Complaint resolved through E
Complaint
Spot Billing Collection Efficiency Consumers gets bill at spot when meter
comes in his home to take reading
4
Enterprise level Apps
ERP Module for Finance ERP Module implementation for Finance Dept
Financial Details
Of Discom on ERP
ERP Module for HR Payroll Details login to employees. Payroll details of all employees are in ERP
ERP Module for HR Online leave/attendance Employees attendance management
system is through ERP
Performance Management
System of employees
Appraisal and Performance of Employees using ERP Software
ERP platform is being used for appraisal system
ERP for Assets Management Tagging all equipment with IDs. All Discom Assets are maintained in
ERP
6.DATA ANALYSIS
CALCULATION OF POWER DISTRIBUTION TECHNOLOGY INDEX (PDTI)
Based on the data primary data collected by the researcher and also information derived from the secondary sources of information , technologies in each category has been assigned a marks out of 5 which helps in judging the level of technology implantation in the Discoms.
FORMULA FOR POWER DISTRIBUTION TECHNOLOGY INDEX
Power Distribution technology index is an indicator of extend of the technologies being used by the Discoms and also how this has helped in reducing their operational efficiency.
Total Technology Score = Summation of Individual Technology Scores of Discoms
Power Distribution Technology Index of Discom = Summation of (Weights * Individual Technology Indicators Score)
The table below shows the different technologies taken up for study and their individual scores and weights: TABLE NO 4:DISCOMS POWER DISTRIBUTION TECHNOLOGY INDEX SCORE
Sl Category Technologies Total
Score Weights
Avg Score (Delhi)
Avg Score (Haryana
Discom)
Delhi Weighted Score
Haryana Weighted Score
1 Metering
Installation of Electronic Meters
-LT Consumers 5 0.4 4 4 1.6 1.6
AMR for Feeder Meters 5 0.05 4 3 0.2 0.15
Prepaid Metering 5 0.05 4 1 0.2 0.05
2 IT Distribution
Apps Energy Accounting System 5 0.15 5 2 0.75 0.3
Power Distribution Technology Index = Score of [Metering + IT Distribution Applications + IT Retail
SCADA 5 5 1 0.75 0.15
Load Forecasting Applications 5 4 1 0.6 0.15
Meter Data Management System 5 5 1 0.75 0.15
Outage Management System 5 5 1 0.75 0.15
Geographical Information System
& Network Analysis 5 5 2 0.75 0.3
Smart Grid Pilot Project 5 1 0 0.15 0
3 IT Retail
Applications
Customer Information System 5
0.2
5 4 1 0.8
Centralized Call Centre 5 5 3 1 0.6
Online Bill payment 5 5 4 1 0.8
E Complaint 5 4 3 0.8 0.6
Mobile Apps 5 4 1 0.8 0.3
Spot Billing 5 5 4 1 0.8
4 Enterprise level Apps
ERP Module for Finance 5
0.15
5 1 0.75 0.15
ERP Module for HR 5 4 1 0.6 0.15
Performance Management System
of employees 5 5 1 0.75 0.15
ERP for Assets Management 5 5 1 0.75 0.2
100 1 89 39 14.95 7.55
TABLE 5:SCORES OF INDIVIDUAL TECHNOLOGY OF DISCOMS
Category Total Delhi Haryana Delhi %
Haryana %
Metering 15 12 8 80 67
IT Distribution
Apps 35 30 8 86 27
IT Retail Apps 30 28 18 93 64
Enterprise
Level Apps 20 19 4 95 21
100 89 38
RELATION OF POWER DISTRIBUTION TECHNOLOGY INDEX AND AT&C LOSSES
After evaluation of technologies being used by power distribution companies using power distribution technology index, researcher tried to find out whether there is any relation between AT&C losses incurred by Discoms and level of technologies being implemented.
TABLE 7:LOSS TRENDS OF DISCOMS WITH TECHNOLOGY INDEX
AT&C Losses
DISCOM
Technology
Index 2003 2005 2007 2009 2011 2013
Delhi
Discom 22 45 36 27 22 19
Haryana
Discom 10 38 34 26 26 23
Source AT&C Loss: Ministry of Power Reports
The figures shows below the Discoms loss trajectory with respect to years which also be compared with the technologies index computed for these Discoms.
FIGURE 4:DISCOMS LOSS TRAJECTORY
DIscoms Loss Trajectory
0 10 20 30 40 50
2003 2005 2007 2009 2011 2013
Year wise
A
T&
C
Los
s
e
s
Delhi Discom Haryana Discom
7.CONCLUSION
The power distributions utilities in India are have already implemented few IT and automation technologies and the rest are in the different stages of implementation of these technologies. Based on the data collected through survey and interviews and further analysis the results were derived, there is difference in level of technology implementation in power distribution companies. The power distribution technology index is a clear indicator of technology implementation in Discoms which clearly shows PPP Discoms score better than Govt Discoms in National Capital region. If we closely look at AT&C losses at these Discoms we can clearly see Discoms with higher index have been able to reduce their AT&C losses as well. But if observe at the loss levels of the both Discoms there is not much difference in loss level but huge gap in terms modern technology implementation in both Discoms.
One of the key outcomes of the research which gives answer to AT&C losses and technology was Metering. Metering for all and replacement of electronic meters from mechanical meters increase income of the Discoms and which substantially led to lowering of the AT&C Losses. Metering for all initiative and conversion of mechanical meters to electronic meters brought down AT&C level drastically in 2003-2005, the loss levels from 45 % to 36 %. Implementation of Information Technology cannot be directly responsible for drastic reduction in AT&C losses. Technology takes its own time for acceptance among users and brings affects on AT&C losses. AT&C depends directly on many factors & especially commercial losses & social economic conditions where sometimes technology has to play little role. Information Technology implementation in billing also led to increase billing efficiency of the Discoms which in turn led to reduction of AT&C losses.
REFERENCES
[1] Hiroshi Kashiwazaki, Takayuki Wakida, Masakazu Sato, Yasuo Sato, New Technologies for Electric Power Distribution Systems (2002).
[2] P.V.Chopade B.E.Kushare Dr. D.G.Bharadwaj, Information Technology Solution for Power Distribution System Automation.
[4] Kam-Hoong Cheong , IT Strategy for Electric Utilities- A Framework towards Effectiveness (1999).
[5] K V Ravithran, Power system of Kerala techno economic analysis(1999).
[6] Oleg Gulich , Technological and business challenges of smart grids(2010).
[7] Aurobinda Basu, Surajit Banerjee, Gautam Banerjee, Reduction in T&D Losses in CESC by IT based Surveillance (2006).
[8] Ministry of Power Report: Technology enabling the transformation of Power Distribution, Nandan Nilekani (2008).
[9] Robinson, Economic and Financial Analysis of Electricity in Delhi (2013).
[10]M P Gupta, Shivraj Kanungo, Rajesh Kumar, and G P Sahu , A Study of Information Technology Effectiveness in Select Government Organizations in India(2007)
[11]Vanita Ahuja(2007), IT Enhanced Communication Protocol for Building Project Management by small & Medium Enterprises in Indian Construction Industry(2007).
[12]S. T. Surulivel, A Study on the impact of technology on the performance of Indian Banking Industry (2010).
[13]Ajeya Jha, A study on the role of information technology in marketing pharmaceutical products (2005).
[14]Piyush Goswami, A statistical analysis & Comparative study of modern technology with impacts on human resource development in public sector banks (2010).
[15]William.F.Hamilton, The dynamics of technology & Strategy(1990).
[16]Betz, Frederick. Strategic technology management. New York: McGraw-Hill, 1993.
[17]Chatterjee, Sheshadri , and Ranjan Chaoudhary. "A System Theoretic Analysis of IT/IS Outsourcing: Case Based Approach." Journal of Modeling and Simulation of Systems Vol.1.2 (2010): 131-143. .
[18]Dasgupta, Meeta. "Enabling excellence in operations through technological innovation." Emerging Markets Case Studies Collection 1.2 (2011): 1-22. .
[19]Herstatt, Cornelius. Management of technology and innovation in Japan. Berlin: Springer, 2006. .
[20]Khalil, Tarek M., and Ravi Shankar. Management of technology: the key to competitiveness and wealth creation.. New York: McGraw-Hill Publishing Company, 2000.
[21]Schilling, , M.. Strategic Management of Technological Innovation. New Delhi: McGraw-Hill, 2005. .
[22]Tesar, George, Steven W Anderson, Sibdas Ghosh, and Tom Bramorski. Strategic Technology Management.. London: Imperial College Press, 2008.
[23]White, Margaret. A. and Garry.D. Bruton. 12. The Management of Technology & Innovation. 2007. Re. New Delhi: Cengage Learning, 2011.
[24]CitiPower and Powercor Australia (2012),Australian power distribution company Annual Report.
[25]United Energy (2013), a Victorian power distribution Company, Distribution annual Planning Report.
[26]European Institute of Technology & Innovation management (2004),Bringing Technology and Innovation into the Boardroom
[27]Husain, Zafar, and R.d Pathak. "A technology management perspective on collaborations in the Indian automobile industry: a case study." Journal of Engineering and Technology Management 19.2 (2002): 167-201.
[28]Zafar Husain a, Sushil b, R.D. Pathak, A technology management perspective on collaborations in the Indian automobile industry, Journal of Engineering & Technology Management. a case study.2002.
[29]Philip Anderson , Toward exemplary research in the management of technology-An introductory essay, Journal of Engineering & Technology Management1993.
[30]Shlomo_Maital,_D. V. R. Seshadri, Innovation Management- Strategies , concept & tools for growth & profit.
[31]David, Bin Xie, A Survey of Manufacturing Strategy and Technology in the Chinese Furniture Industry (2003).