425
ACADEMIC PERFORMANCE IN COMPUTER-AIDED INSTRUCTION: A CASE OF THE PHYSICS EDUCATIONAL TECHNOLOGY SIMULATIONS
(PhET SIMS)
Farida C. Jamolod, M.Chem. MA Gensci
Jose Rizal Memorial State University-Main Campus,Dapitan City [email protected]
Abstract
Computer-Aided Instruction (CAI), diverse and rapidly expanding spectrum of computer technologies that assist the teaching and learning process. This study aimed to investigate the effects of Computer–Aided Instruction (CAI) on the student’s academic performance in Chemistry at Jose Rizal Memorial State University–Main Campus. The Quasi–Experimental design was employed. After a random selection of the two sections to be the subjects of this study, thirty–five (35) students composed the experimental group and thirty-three (33) students comprised the control group. The experimental group was exposed to computer-aided instruction while the control group was exposed to a traditional method of teaching. The data collected were treated using mean, z-test and t-test. The result of the study revealed that the pretest performance of the control and experimental groups was at par before the intervention. However, in the post-test performance of the students exposed to computer-aided instruction with PhET interactive simulations, the result was “very good’ while that of the students exposed to a traditional method of teaching was only “good.” Indeed, computer–aided instruction in Chemistry is better in enhancing the performance of the students. Based on the findings of the study, the researcher recommended that Chemistry Instructors should apply computer–aided instruction.
426
INTRODUCTION
Computer-aided instruction in the form of simulations, offers the teachers a unique opportunity to enable their students to connect realistic visual models to essential scientific concepts. One of the greatest challenges that Chemistry teachers face in the classroom is instilling scientific understanding by communicating and explaining what is taking place at the sub–micro level. For example, even though students may be aware that matter is made up of tiny particles called atoms and molecules, many of them still cannot think of gas as a material because they cannot see or touch it. Understanding sub–micro level in Chemistry is essential in order to understand scientific phenomena at the macroscopic and symbolic level.
Popularly utilized in classrooms today is the term “learning through computers”. This involves the use of computer as an aid for the teacher to do his presentations, and to get the learners to practice and drill. Computers primarily are used to enhance interactive activities, to provide immediate feedback, to facilitate the retention and to enable the learners at diverse levels to work at their own pace (Owusu et. al, 2012).
Unfortunately, the available static visuals, texts and verbal descriptions used in the Chemistry classroom are often not enough to cultivate a genuine appreciation and understanding of some of the abstract concepts in Chemistry. Along this view, the researcher was challenged to undertake the present study in order to investigate the effects of Computer–Aided Instruction (CAI) using the interactive Physics Educational Technology Simulations (PhET Sims) on the student’s academic performance in Chemistry at Jose Rizal Memorial State University–Main Campus. Specifically, it aimed to investigate:
1. the pretest performance of the College Chemistry students in the: 1.1.Control Group;
1.2.Experimental Group.
2. the significant difference on the pretest performance of the College Chemistry students in the control and experimental groups.
3. the posttest performance of the College Chemistry students in the: 3.1. Control Group;
3.2 Experimental Group.
4. the significant difference on the posttest performance of the College Chemistry students in the control and experimental groups.
5. the significant difference on the pretest and posttest performance of the College Chemistry students in the control and experimental groups.
6. the significant difference on the mean gains scores of the control and experimental groups.
In this investigation the researcher utilized four PhET Sims that are freely available over the Internet. The four PhET Sims are developed by the University of Colorado (https://phet.colorado.edu/) to wit: Build an Atom, Build a Molecule, Molecule Polarity and Molecule Shapes. Basically these were utilized, in order to support the teaching and learning process of some of the abstract concepts in Chemistry, in which along this view, is the interest of the researcher. CAI can motivate students to learn as it provides interactive, hands on activities for a rich learning environment.
THEORETICAL AND CONCEPTUAL FRAMEWORK
427
more authentic learning environment. Moreover, it is imperative for schools to adopt technology integration because research has shown that it turns teachers and students complicated tasks simple and easy to accomplish. Using educational technology, the teaching and learning activities become enjoyable. Students learn willingly by playing and enjoying classroom activities.
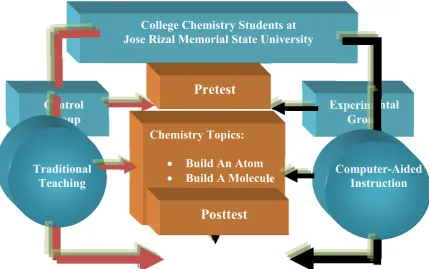
The schema of the study is presented in Figure 1, on the succeeding page, which aimed tofind outthe effectsof computer–aided instruction using the PhET Simsonthe students’performance in Chemistry of Jose Rizal Memorial State University.
The topmost block in the schema reflects the subjects under study, the College Chemistry students of Jose Rizal Memorial State University. Before the teaching intervention, both the experimental and control groups were given a 60-item pretest. The research instrument used in the study was subjected to degree of validity and reliability such as TOS examination, item analysis and reliability tests. The arrow from the pretest block is pointing the next lower block containing the Chemistry topics in the pretest, namely: “Build An Atom”, “Build A Molecule”, “Molecule Polarity” and “Molecule Shapes”.
Using the same subject matter the members of the control group were taught using traditional method, while the members of the experimental group were exposed to computer–aided instruction (CAI). Unlike the traditional method of teaching, this time, the experimental group was exposed to the use of computers, LCD projectors and speakers in presenting the lesson. Specifically, CAI used PhET Sims, video clips, and teacher-made power point presentations. After the experiment, both the control and experimental group were administered with posttest on the same items given during the pretest. This is reflected by the arrow from the block containing the four topics in Chemistry pointing to the posttest block. The pretest and posttest performances of the groups were eventually tabulated and analyzed with the use of statistical tools such as mean, z- test and t-test.
Figure 1 Schema of the Study
College Chemistry Students at Jose Rizal Memorial State University
Control Group
Experimental Group Chemistry Topics:
Build An Atom
Build A Molecule
Molecule Polarity
Molecule Shapes
Computer-Aided Instruction Traditional
Teaching
Pretest
428
METHODOLOGY
Two (2) out of the three sections of College Students handled by the researcher were selected as the subjects in the study. After the tossing of a coin, 33 students were in the control group and 35 students belonged to the experimental group. All in all there were 68 students utilized as subjects of the studyTable 1 Subjects of the Study
Group Frequency Percentage
Control 33 48.53%
Experimental 35 51.47%
Total 68 100.00%
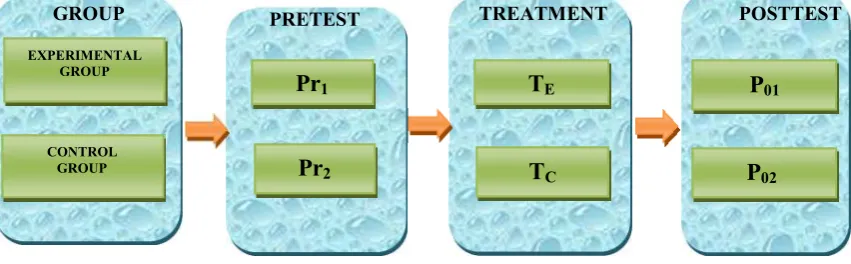
The study then, utilized the Quasi-Experimental Design 10 or the Pretest– Posttest Control and Experimental Group Design which consisted of two groups. The process involved in the experiment is presented in Figure 2. Before the treatment began, both the experimental and control groups were given a 60-item pretest on similar sub-micro concepts in Chemistry (Pr1 and Pr2). After the pretest was conducted, the control
group was taught using the traditional method (TC) of teaching, while the researcher
employed the computer-aided instruction using PhET Sims to the experimental group (TE). After the treatment, the same 60-item pretest was administered to make up the
posttest (Po1 and Po2). The members of the control group were taught with traditional
method of teaching, while the members of the experimental group were taught with computer-aided instruction. Both groups learned the same sub-micro concepts in Chemistry in consonance with the syllabus Finally, the pretest and posttest performances of the groups were eventually tabulated and analyzed with the use of statistical tools such as mean, z- test and t-test.
Figure 2 The Research Process
RESULTS AND DISCUSSIONS
Pretest Performance of the Control Group
Table 2 depicts the pretest performance of the College Chemistry students exposed to traditional method of teaching. The table shows that the group did not attain the 75% level of performance on the four succeeding topics, namely: Build An Atom, Build A Molecule, Molecule Polarity and Molecule Shapes with AMs of 3.73, 4.79, 3.94, and 2.61, respectively. The over-all level of performance of the students exposed to the four topics using the traditional method of teaching was described as “fair” having 15.06 AM and 3.83 SD. This implies that the students that belong to this group have prior or stored knowledge or schema on the areas tested, but it was not fully strengthened because more often than not, students are not aware of what they know.
EXPERIMENTAL GROUP
GROUP TREATMENT
TE
PRETEST
Pr1
POSTTEST
P01
CONTROL
GROUP T
C P02
429
Table 2 Pretest Performance Profile of the Control Group
Topics No. of Items HM (75%) AM SD Z – value De
Build An Atom 16.00 12.00 3.73 1.83 -26.04 Fair
Build A Molecule 16.00 12.00 4.79 2.01 -20.59 Fair
Molecule Polarity 15.00 11.25 3.94 1.35 -31.23 Fair
Molecule Shapes 13.00 9.75 2.61 1.14 -35.87 Fair
Total 60.00 45.00 15.06 3.83 -44.88 Fair
d.f. = 32 c.v.= 1.645 α = 0.05
Legend:
HM Hypothetical Mean d.f. Degrees of Freedom AM Actual Mean c.v. Critical Value
SD Standard Deviation De Description
Pretest Performance of the Experimental Group
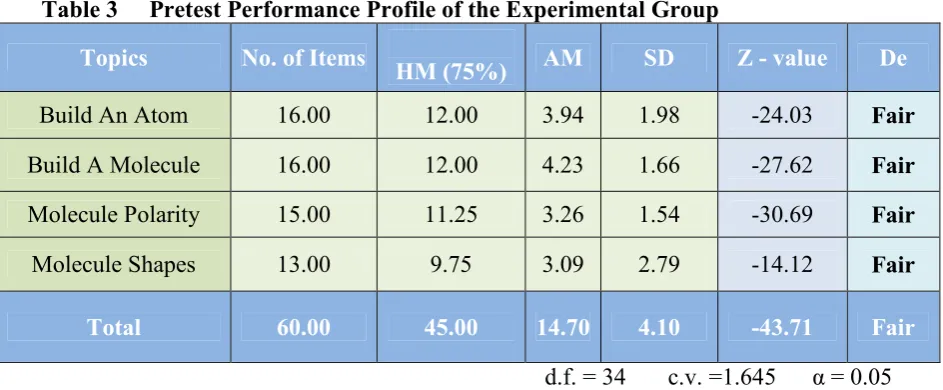
Table 3 presents the pretest performance profile of the students exposed to computer–aided instruction (CAI). Results showed that like the control group or students exposed to traditional method, this group of students did not succeed also in obtaining the 75 percent performance or 45.00 score same with the latter group. It is also evident in the table that the students exposed to CAI obtained AMs of 3.94, 4.23, 3.26 and 3.09, respectively, on the four topics presented in the experimental group which were all described as “fair”.
Table 3 Pretest Performance Profile of the Experimental Group
Topics No. of Items
HM (75%) AM SD Z - value De
Build An Atom 16.00 12.00 3.94 1.98 -24.03 Fair
Build A Molecule 16.00 12.00 4.23 1.66 -27.62 Fair
Molecule Polarity 15.00 11.25 3.26 1.54 -30.69 Fair
Molecule Shapes 13.00 9.75 3.09 2.79 -14.12 Fair
Total 60.00 45.00 14.70 4.10 -43.71 Fair
d.f. = 34 c.v. =1.645 α = 0.05 Indeed, the pretest result revealed that there is a need in making sub-micro concepts in Chemistry understandable as it is the very foundation for every student to logically comprehend the macroscopic and symbolic concepts in Chemistry. Hence, teachers need to employ strategies so that learning will be easy and teaching the subject can be more meaningful. The use of CAI enables student to be active in the learning process, to construct knowledge, to develop problem solving skills and to discover alternative solutions (Ōzmen, 2008).
430
symbolic level in order for student to move seamlessly between Johnstone’s three “thinking-levels” in Chemistry (Johnstone,2000).
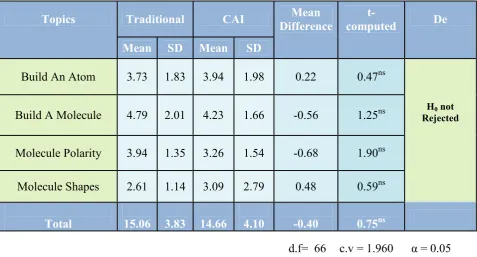
Table 4 depicts the t-test table comparing the difference on the pretest performance between the control group or those students exposed to traditional method of teaching and the experimental group or those students exposed to computer–aided instruction. The results disclose that in the four areas given to the groups, there was no significant difference between the two groups in their pretest performance since the critical value of 1.960 was greater than the computed t–value of 0.75. This data provide sufficient evidence to accept the null hypothesis. This means that the students exposed to traditional method and students exposed to CAI almost exhibit the same level of performance. The pretest conducted to both groups before the proper experimentation was done showed that both performances of the two groups of students under study were “fair”, which means that students have preconceived notions or ideas about concepts that instructor wants them to learn. Eggen and Kauchak as cited in Buhian (2011) claimed that learners are not empty vessels waiting to be filled up. They see learners as active thinkers who interpret new information based on what they already know. The results also revealed that the students in the two groups required reinforcement so that their academic performance level is raised form fair to good, very good or even to excellent level. The instructors should employ interventions to increase student’s performance in Chemistry. As explained by Carpenter, Moore and Perkins (2015) in their study the students who have little or no prior background may benefit from the integration of computer–aided instruction by using concurrent symbolic and molecular-scale pictorial representations.
Table 4 Test of Difference on the Pretest Performance Between the Control and Experimental Groups
d.f= 66 c.v = 1.960 α = 0.05
Legend
d.f. Degrees of Freedom cv Critical Value SD Standard Deviation De Decision
Topics Traditional CAI Mean
Difference
t-
computed De
Mean SD Mean SD
Build An Atom 3.73 1.83 3.94 1.98 0.22 0.47ns
H0 not Rejected
Build A Molecule 4.79 2.01 4.23 1.66 -0.56 1.25ns
Molecule Polarity 3.94 1.35 3.26 1.54 -0.68 1.90ns
Molecule Shapes 2.61 1.14 3.09 2.79 0.48 0.59ns
431
Posttest Performance Profile of the Control Group
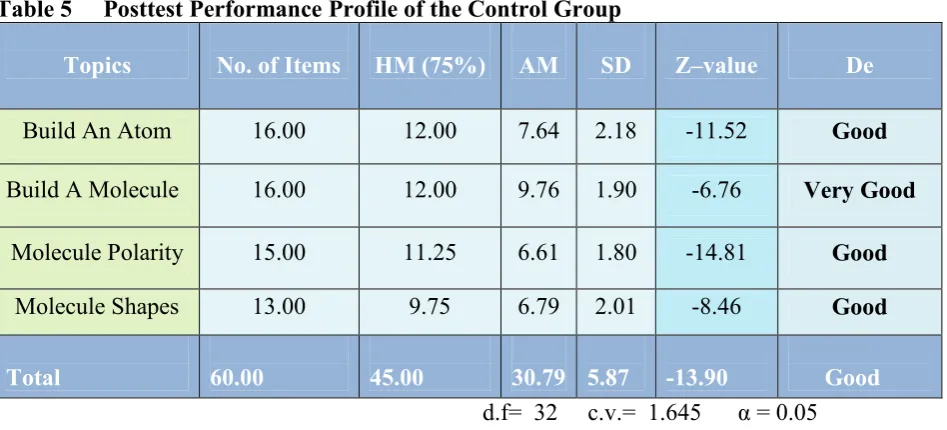
Table 5 presents the posttest performance of the students in the control group or those students exposed to traditional method of teaching.
In totality, the students in the control group failed to attain the 45.0 HM score in the posttest since they only obtained the mean score of 30.79 with SD of 5.87 which was described as ‘good” performance. The z–value of -13.90 did not exceed the critical value of 1.645 at 0.05 level of significance. This means that the group did not attain the 75% expected performance in a significant degree.
The study of Dermirci cited in Salviejo, Aranes and Espinosa (2014) considered the traditional method of instruction. Based on the study, traditional teaching method alone does not promote high academic achievement in Science. The study support the present findings leading to the contention that there is a need to use computer–aided instruction in order to generate better results than using traditional method of teaching alone. Considering that young students nowadays, are engrossed and adept with the use of technology.
Table 5 Posttest Performance Profile of the Control Group
Topics No. of Items HM (75%) AM SD Z–value De
Build An Atom 16.00 12.00 7.64 2.18 -11.52 Good
Build A Molecule 16.00 12.00 9.76 1.90 -6.76 Very Good
Molecule Polarity 15.00 11.25 6.61 1.80 -14.81 Good
Molecule Shapes 13.00 9.75 6.79 2.01 -8.46 Good
Total 60.00 45.00 30.79 5.87 -13.90 Good
d.f= 32 c.v.= 1.645 α = 0.05
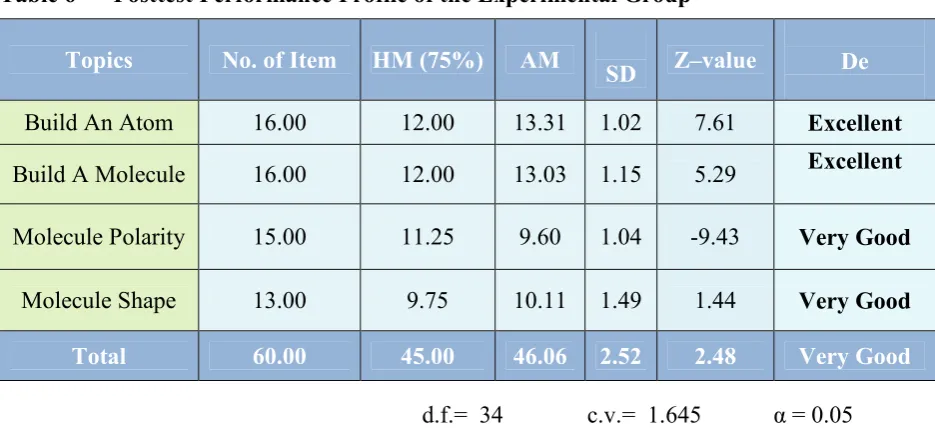
Posttest Performance Profile of the Experimental Group
The posttest performance profile of the group of students exposed to computer– aided instruction is presented in Table 6. A closer look on the table reveals that the group passed the 75% expected level of performance on the two topics covered to wit: Build an Atom and Build a Molecule, obtaining AMs 13.31 with 1.02 SD and 13.03 with 1.15 SD, respectively. It can also be gleaned in the table that the experimental group has “excellent” performance on these above mentioned topics.
432
The results of the experiment vividly show that that the students exposed to computer–aided instruction obtained an over–all performance of 46.06 AM which was described as “very good’ performance having an SD of 2.52. The z–value of 2.48 exceeded also the critical value of 1.645. This means that the group had passed the 75% performance level at a significant degree.
Current research on learning has offered more and more evidences on the use of computer-aided instruction to enhance the students’ academic performance. The study conducted by Straub (2010) that corroborates the present findings in which the use of computer simulation displays the microscopic and macroscopic world accurately. In terms of the effect of computer simulations have had on student learning and meaning, the respondents on the survey feel that the use of simulations increases the dialogue between students, and between students and the teacher, as well as increasing student understanding of a concept. Majority also believe that they portray the microscopic and macroscopic world accurately.
Table 6 Posttest Performance Profile of the Experimental Group
d.f.= 34 c.v.= 1.645 α = 0.05
Test of Difference on the Posttest Performance of the Control and Experimental Groups
Table 7 discloses the data on the test of significant difference between the posttest performance of the group of students exposed to traditional teaching and students exposed to computer-aided instruction. It can be gleaned from the table that the group of students exposed to computer–aided instruction has a higher mean score of 46.06 with SD of 2.52 than the group of students exposed to traditional method of teaching which has only 30.79 AM and SD of 5.87. This means that the group of students exposed to computer–aided instruction performed better than the students exposed in traditional teaching after the intervention.
Topics No. of Item HM (75%) AM
SD Z–value De
Build An Atom 16.00 12.00 13.31 1.02 7.61 Excellent
Build A Molecule 16.00 12.00 13.03 1.15 5.29 Excellent
Molecule Polarity 15.00 11.25 9.60 1.04 -9.43 Very Good
Molecule Shape 13.00 9.75 10.11 1.49 1.44 Very Good
433
Table 7 Test of Difference on the Posttest Performance Between the Control Group and Experimental Group
d.f. = 66 c.v. =1.960 α = 0.05 Generally, the above result summarizes that there was a significant difference on the experimental groups’ pretest and posttest performance since the recorded critical value of 1.960 is lesser than the computed t- value of 13.79 with 66 degrees of freedom. This finding provides sufficient evidence to reject the null hypothesis. Thus, there is a significant difference between the posttest performances of the group of students exposed to traditional method of teaching and those students exposed to computer–aided instruction. This means that there exists a significant performance of the two groups after the intervention. This also means that the performance of students was better with computer-aided instruction.
.
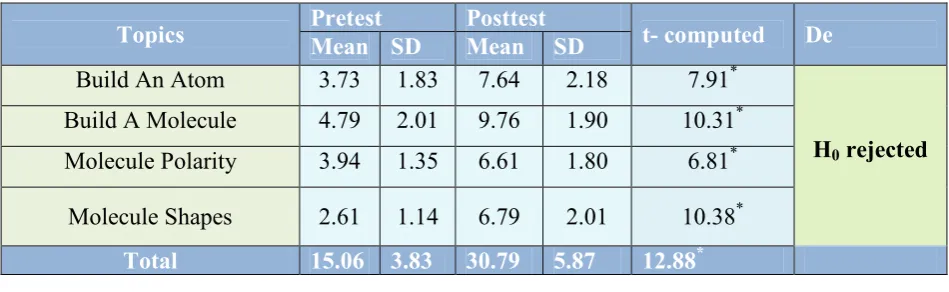
Test of Difference Between the Pretest and the Posttest Performance of the Control Group
Table 8 Test of Difference Between the Pretest and the Performance of the Control Group
d.f = 32 cv = 1.645 α = 0.05 Table 8 presents the test of significant difference between the pretest and posttest performance of the students exposed to traditional method of teaching. It can be gleaned in the table that in Build An Atom topic the control group’s pretest was 3.73 with a SD of 1.83 while its posttest mean was 7.64 with a SD of 2.18.When t-test was conducted, it had a critical value of 1.645 lesser than the t-value of 7.91. In this light there was significant difference between the pretest and posttest performance of the students.
Topics
Traditional (Control)
CAI (Experimental)
Mean Difference
t- computed De
Mean SD Mean SD
Build An Atom 7.64 2.18 13.31 1.02 5.69 13.63* H
0
rejected
Build A Molecule 9.76 1.90 13.03 1.15 3.27 8.51*
Molecule Polarity 6.61 1.80 9.60 1.04 2.99 8.34* Molecule Shapes 6.79 2.01 10.11 1.49 3.33 7.71*
Total 30.79 5.87 46.06 2.52 15.27 13.79*
Topics Pretest Mean SD Posttest Mean SD t- computed De
Build An Atom 3.73 1.83 7.64 2.18 7.91*
H0 rejected
Build A Molecule 4.79 2.01 9.76 1.90 10.31*
Molecule Polarity 3.94 1.35 6.61 1.80 6.81*
Molecule Shapes 2.61 1.14 6.79 2.01 10.38*
434
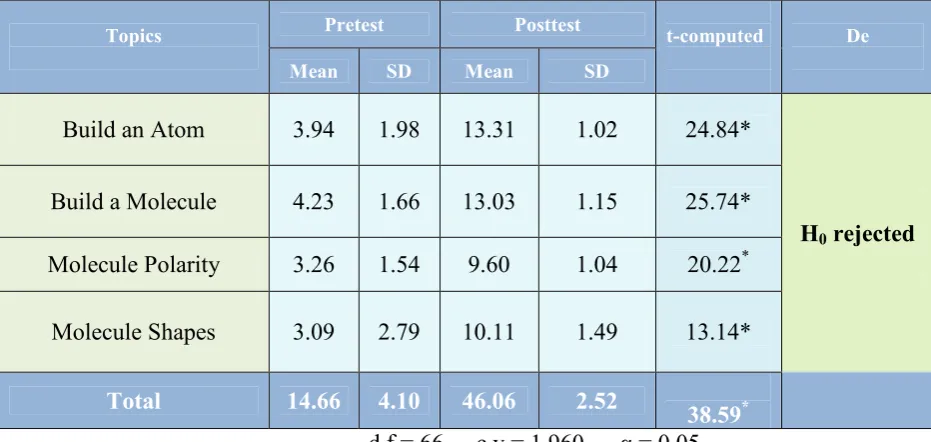
Table 9 presents the data on the test of difference between the pretest and posttest performance of the students exposed to computer-aided instruction. In Build An Atom topic, students registered a pretest mean of 3.94 and a SD of 1.98 with a posttest mean of 13.31 and a SD of 1.02. When the result was subjected to t-test, the t-value was 24.84, significantly higher than the critical value of 1.960 at 95% confidence level with 66 degrees of freedom, leading to the rejection of the null hypothesis. This means that there is a significant difference between the pretest and posttest performance in the first topic being considered in the study.
Generally the results provide sufficient evidence to reject the null hypothesis. This implies a significant variation in the performance of the students after the computer– aided instruction was given as an intervention. The result of the experiment clearly showed that the use of CAI in teaching leads to better performance of students in the subject compared to traditional method of teaching.
The work of Carpenter, Moore and Perkins (2015) corroborates the present findings that interactive simulation offers an opportunity to foster student development of this skill via an inquiry-driven approach.
Table 9 Test of Difference Between the Pretest and the Posttest Performance of the Experimental Group
Topics
Pretest Posttest
t-computed
De
Mean SD Mean SD
Build an Atom 3.94 1.98 13.31 1.02 24.84*
H0 rejected
Build a Molecule 4.23 1.66 13.03 1.15 25.74*
Molecule Polarity 3.26 1.54 9.60 1.04 20.22*
Molecule Shapes 3.09 2.79 10.11 1.49 13.14*
Total 14.66 4.10 46.06 2.52
38.59* d.f = 66 c.v = 1.960 α = 0.05
Test of Significant Difference on the Pre–Post Mean Gain Performance Between the Control and Experimental Groups
435
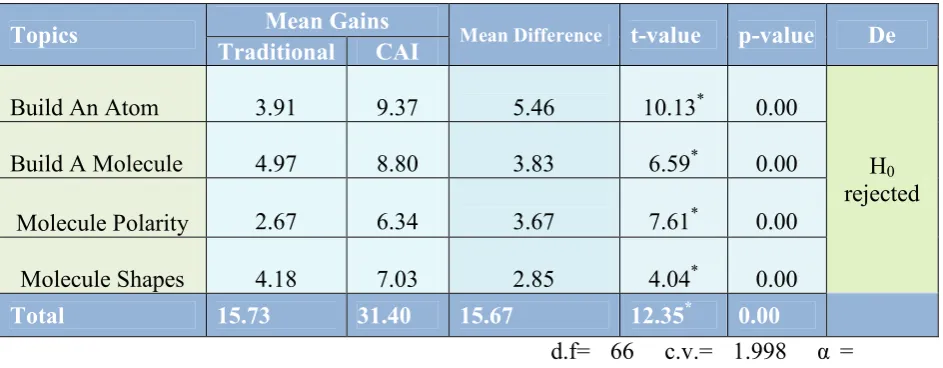
Table 10 Test of Significant Difference on the Pre–Post Mean Gain Performance Between the Control and Experimental Groups
Topics Mean Gains Mean Difference t-value p-value De
Traditional CAI
Build An Atom 3.91 9.37 5.46 10.13* 0.00
H0
rejected Build A Molecule 4.97 8.80 3.83 6.59* 0.00
Molecule Polarity 2.67 6.34 3.67 7.61* 0.00
Molecule Shapes 4.18 7.03 2.85 4.04* 0.00
Total 15.73 31.40 15.67 12.35* 0.00
d.f= 66 c.v.= 1.998 α = 0.05
The work of Moore & Perkins (2014) corroborate the present findings that the used of simulation resulted to a significant increases on student’s performance on Chemistry– pre-post gains ranging from 23% to 78%. Similarly, the findings of Dange et. al. (2006) concluded on their study with the following results: There was significant difference between mean gain scores of posttest of control and experimental group and the level of academic performance was significantly influenced by the integration of CAI in the teaching learning process. In order to improve students’ academic performance, the role of the teacher is to make the teaching–learning situation more effective and more meaningful through vivid and dynamic visualizations of the concepts.
FINDINGS CONCLUSIONS AND RECOMMENDATIONS
The findings of the study revealed that the pretest performances of the group of students exposed to traditional method of teaching (control group) and the group of students exposed to computer-aided instruction (experimental group) were both “fair”. There was no significant difference between the pretest performance of the two groups of students exposed to traditional method of teaching and computer-aided instruction. The posttest performance of the control group was “good”, while the experimental group was “very good”. There was a significant difference between the posttest performance of the two groups of students exposed to traditional method of teaching and computer– aided instruction. There was a significant difference on the pretest and posttest performance of the two groups of students exposed to traditional method of teaching and computer–aided instruction. There was a significant difference on the pre–post mean gain scores of the group of students exposed to traditional method of teaching and computer–aided instruction.
436
difference on the posttest performances between the two groups of students tells that the group exposed to computer-aided instruction performed better. The significant difference on the pretest and posttest performances of the two groups of students shows that one from the teaching approaches used in the study, it was the computer-aided instruction that is better than the other. The significant difference on the mean gain scores between the two groups revealed that the integration of computer–aided instruction in teaching is better in improving the performance of the students in the Chemistry subject.
Based on the conclusions formulated, the researcher suggests the following recommendations, to wit:
References:
Baguinat, P.S. III (2012), College Algebra Instruction with Code- Switching Application:
Singapore and Hongkong Practices. The Threshold Journal, RFM Motong Printing
Press. Jose Rizal Memorial State University.
Buhian,V. (2011) Experential Learning Model in Teaching Communication Arts and Skills: Effects on Students’ Performance. Jose Rizal Memorial State University.
Carpenter,Y., Moore, E.B., & Perkins, K.K(2015). Representations and Equations in an
Interactive Simulation that Support Student Development in Balancing Chemical Equations. University of Colorado Boulder, Spring 2015 ConfChem: Interactive Visualizations for Chemistry Teaching and Learning. Retrieved on May 17, 2016 from https://confchem. ccce. divched. org/sites/confchem.ccce.div
Eggen, P. & Don K. (2001). Educational Psychology: Windows on the Classroom. SA: Prentice Hall.
Johnstone, A. H. (2000). Teaching of Chemistry-Logical or Psychological. Chemistry
Education: The Practice of Chemistry Education Research and Practice in Europe.1 (1), 9-15.Retrieved on April 10,2016 from http://pubs.rsc.org
/en/content/articlelanding/2000/rp/a9rp90001
Kelly, R. (2015).Insights to Molecular Visualization. University of Colorado Boulder. Spring
2015 ConfChem: Interactive Visualizations for Chemistry Teaching and Learning. Retrieved on April 15,2016 from https://confchem.ccce.divched.org/site
/confchem.ccce.divched.org/files/2015Spring.
Loeblein, Trish /http://phet.colorado.edu.Creative Commons Attribution 4.0 InternationalLicense Retrieved February 15,2016 from
http://intro.chem.okstate.edu/1314f00/lecture/chapter10/vsepr.html
437
Potential. University of Colorado Boulder, Spring 2015 ConfChem: Interactive Visualizations for Chemistry Teaching and Learning. Retrieved on May 18, 2016 from
https://confchem.ccce.divched.org/sites/confchem.ccce.divched.org/files/2015Sp ringConfChemP8.pdf
Moore, E. B., & Perkins, K. (2014). Assessing the Implicit Scaffolding Design Framework:
Effectiveness of the Build a Molecule Simulation. In Proceedings of the National Association for Research in Science Teaching (NARST), Annual International Conference. Pittsburgh, PA. Retrieved on May 20,2016 from https:
//phet.colorado.edu/en/research
Özmen, H., (2008). Some Student Misconceptions in Chemistry: A Literature Review of
Chemical Bonding. Journal of Science Education and Technology, 13(2), 147–159. Retrieved on April11, 2016 from https://www.researchgate.net/profile /Haluk_Oezmen/publication/223235481
Owusu, K. A., Monney, K. A., Appiah, J. Y., & Wilmot, E. M. (2012).Effects of Computer-
Assisted Instruction on Performance of Senior High School Biology Students in Ghana. Computer & Education, 55, 904-910. Retrieved on May 15, 2016 from https://www.researchgate.net/publication/220140079
Reigeluth, E. (2011). The Molecular Workbench Software: An Innovative Dynamic Modeling Tool for Nanoscience Education. Models and Modeling: Cognitive
Tools for Scientific Enquiry. Springer, New York, 121–132. Retrieved on April 10, 2016 from
www.springer.com/br/book/9789400704480.
Roque, M. (2013). Computer-Aided Instructions for High School Chemistry of Sta. Lucia High School. Master’s Thesis. Retrieved on May 15, 2016 from www. studymode.com/.../computer-aided-instruction-k-high-school-thesis-page1.html
Salviejo, E. Aranes, F. Espinosa, A. (2014) Strategic Intervention Material-Based
Instruction, Learning Approach and Students‘ Performance in Chemistry. International Journal of Learning Teaching and Educational ResearchVol. 2, No. 1, pp. 91-123.Retrieved on May 18, 2016 from https://www.ijlter.org/index.php/
ijlter/article/view/10
Skinner,BF.(2003) Technology of Teaching. BF Skinner Foundation.ISBN 978-0-9964539-2-
99(epub).Retrieved on May 1,2016 from https.book.google.com.ph
438
Branch 395,Wellington .Ottawa ON K1A 0N4 Canada ISBN: 978-0-494-70220-8.Retrieved on May 10, 2016 from https://mspace.lib.umanitoba.ca/handle/1993/
Tasker,R.(2015) Research into Practice: Visualizing the Molecular World for a Deep