69 Volume and Issues Obtainable at Center for Sustainability Research and Consultancy
Journal of Accounting and Finance in Emerging Economies ISSN: 2519-0318ISSN (E) 2518-8488
Volume 1: Issue 2 December 2015
Journal homepage: www.publishing.globalcsrc.org/jafee
Evaluating the Constructive or Destructive Role of PowerPoint in Accounting
Education
1
Muhammad Imran,2Shumaila Sharif,3Faryal Batool,4Qaisar Maqbool Khan
1
PhD Scholar at Department of Commerce, BahuaddinZakariya University [email protected]
2
M. Phil Scholar at Commerce Department, BahuaddinZakariya University MultanPakistan.
M.PhilScholarat Commerce Department, BahuaddinZakariyaUniversity MultanPakistan.
PhD Scholar at Department of Commerce, BahuaddinZakariya University Multan-Pakistan.
ARTICLEDETAILS ABSTRACT
History
Revised format Nov 2015 AvailableOnlineDec 2015
Objectives:With change in technology teaching methodology also changed and technology penetrates into the class rooms. The most commonly used computer aided teaching methodology in class rooms is PowerPoint presentation. It replaces the traditional method of teaching i.e. whiteboard and marker. This research focus to investigate the effect of PowerPoint presentation on student‟ performance.
Methodology:We choose 282 students studying accounting courses in various universities of Multan, Pakistan. We used SPSS and Microsoft Excel to analyze the data.
Result:We found that PowerPoint has negative impact on the student‟s
performance. But on the other hand, students feel tiresome with traditional method of teaching. Students prefer to take quantitative courses via traditional method, and they prefer to take qualitative courses by PowerPoint presentation.
© 2015 The authors, under a Creative Commons Attribution-NonCommercial 4.0
Keywords Powerpoint
Traditional methodology Material Understandability Teaching/Learning Process Student’sAttitudes
Student’sPreference Student’sPerformance JEL Classification: O14, Y20, P29
Corresponding author‟semailaddress:[email protected]
Recommended citation:Imran, M., Sharif, S., Batool, F.&Khan. Q. M., (2015). Evaluating the Constructive, or Destructive Role of Powerpoint in Accounting Education. Journal of Accounting and Finance in Emerging Economies, 1 (2) 69-86. DOI:https://doi.org/10.26710/jafee.v1i2.65
1. Introduction
70
teaching like transparencies, PowerPoint slides, etc. Technology penetrates into the classrooms and become an important part of classroom (Thomas, 2002, p. 1). The use of computer in education increases and this leads to the utilization of „Microsoft Office‟ package programs. It serves as a supporting tool in classrooms (Kahraman, Cevik, &Kodan, 2011).
The most common and highly used technology in classrooms to project information is from computer into the screen via Microsoft PowerPoint (McCannon& Morse, 1999). According to the Microsoft over thirty million presentations per day take-place worldwide, about 250 million computers in the world have PowerPoint software (Amare, 2006).
There are three basic reasons for the high usage of PowerPoint (PPT) in classrooms. The first reason is that there is high pressure on teachers for publications and administration. Due to this pressure they simplify their teaching methodology and put less effort and time on lecture preparation. The second reason is that professional publishers of these PPT slides facilitates and serve instructors by providing ready made slide presentation. The third reason is the appreciation from students who prefer the availability of lecture notes. They don‟t put effort to make these notes. Furthermore, these students give high marks while evaluating the course and teaching methodology, so, they put pressure on instructors to make, distribute and use PPT slides in the classroom (Apperson, et al., 2006; Frey & Birnbaum, 2002; Gabriel, 2008; Harknett&Cobane, 1997; Nouri&Shahid, 2005; Nouri&Shahid, 2008: Jordan & Papp).
The concept of modern teaching methodology, specifically PPT is based on Dual coding theory formulated by Allan Paivio (1986). The assumption of this theory is that the learning efficiency can be enhanced if the information is presented by two different but supporting methods. One method encodes the verbal information like text and the other encodes the non-verbal information like visual or voice presentation. So, it become easier to remember that information which one can read and hear than those which is coded in only one channel (Akkoyunlu&Yilmaz 2005;Selimoglu, &Arsoy, 2009). Edward Tufte (2003) has argument against use of PPT. He views that PPT spoil the quality and reliability of information. Moreover, New York Times published an article with title “PowerPoint Makes You Dumb” (Thomson, 2003) and Fortune 500 Company restricted the practice of PowerPoint in presentations (Numberg, 1999). Despite of all these arguments against PPT, this method is extensively adopted in educational institutions because of its benefits, ease and time saving.
PowerPoint presents information in an organized, attractive, easily remembered way to the audience (Boyce,1999). Nouri&Shahid (2005) found that student‟s attitude toward PPT presentation were positive. They also conclude that when PPT presentations are appropriately prepared, it affects the short term memory of students.Hashemi, Azizinezhad, &Farokhi, (2012) found that PPT have no impact on long term memory of students. Contrary to this, Rosenthal et al. (2003) compared classes using PowerPoint presentations with those that are teacher centered classes. Their results were based on students‟ academic success. They found no significant difference between the two teaching methodologies.
71 Many studies undertaken by researchers concludes that students believe by using PowerPoint in classrooms make easier for them to learn (Szabo, & Hastings, 2000; Mantei , 2000; Rankin, &Hoaas, , 2001; Apperson, Laws, &Scepansky, 2006; Beets, &Lobingier, 2001; Kahraman, Çevik, &Kodan, 2011). Literature showed that PPT make efficient use of class room time as compared to traditional way of teaching on such as whiteboard and transparencies (Mantei , 2000; Daniels, 1999). Students expresses that classes taught with PPT are more interesting because it include visual elements (O'Dwyer, 2008).
In a educational literature, there is common debate whether PowerPoint is useful to students and in what way it affects their performance. The question “how does powerpoint affect students?” remains unanswered. For this purpose, many research studies have been done in advanced countries and yield mixed results, however very few studies investigated in the developing countries like Pakistan. Hence, this studyempericaly test the impact of the PowerPoint presentation on studentsperformance and attitude in Pakistan for filling the gap in litrature.
The research objectives are to investigate:
1. The effect of the two teaching methods on resources understandability. 2. The effectiveness of the two teaching methods on the learning process. 3. Attitudes of the students towards the two diverse teaching methods used. 4. Preferences of the students for the two different teaching methods.
5. For gauging the impact of the two different teaching methods on studentsperformance(i., grade).
2. Literature Review
Increase in number of admissions every year has brought changes in both administration and academic systems. Availability of technology has facilitated in various aspects, however. Quality in education in institutions is more inevitable now (Akdağ&Tok, 2008). Most of the faculty is now moving toward computer aided lectures instead of traditional teaching technique and have developed paperless classrooms (Navarro, 1998). Widely used PowerPoint presentations in the classrooms have become an emerging topic for researchers of various countries. Many scholarships have addressed the effectiveness of PowerPoint usage and contributed to literature. Some researches focused the effectiveness of PowerPoint presentations on the attitude of students while, other focused the difference of success of the students in relation to the lectures delivering teaching methodology (Selimoglu&Arsoy 2009).
A PowerPoint presentation is a complicated mix up of text and graphics having advanced software features and real-time interaction with the audience (Farkas, 2008). PowerPoint method has both advocates and opponents. Daniels (1999) and Mantei (2000) argued that PowerPoint is considered more beneficial as it is an efficient and time saving strategy as compared to writing on boards. By using PowerPoint slides, time of writing on the board can be saved and the lecture flows in well way. The key
characteristic of PowerPoint is that it offers complete base for presentation. It gives order to the lecture
(Hlynka& Mason, 1998) and makes it more convenient for lecturer to present brief summaries (Lowry, 1999). It might be effective on the extent of learning of students from lectures delivered. It depends upon the understandability of the material conveyed (Miller &McCown, 1986) and students‟ extent of retention of that material (Garner, 1992 and Susskind 2005). Furthermore, PowerPoint presentations have another advantage of visual attraction due to containing strong colors, designing of text, animated diagrams and ease to edit and updating of slides according to requirement. Thus they provide substantialenergy and time savings (Lowry, 1999; El Khoury and Mattar 2012). Cited in Boyce (1999)
that computer assisted technique enable more effective learning by facilitating the understanding of
72
Hawkins & Allen, 1967).
Evan‟s (1998) gave empirical evidence of students‟ better performance by learning through PowerPoimt slides. He tested by conducting pilot study of 161 students taking a General Psychology course found that students performed better (roughly 4 percentage points) with PowerPoint presentations as opposed to lectures with overhead transparencies, and those students liked PowerPoint better than transparencies
(Amar, 2006). On the other hand, researches have also shown weaker support for this particular teaching
style. As Pippert and Moore (1999) argued by using PowerPoint, students displayed some dissatisfactory
behavior about the interaction of classroom. Studies have also refuted that PowerPoint decreases the interaction between teacher and students and often makes the students sleepy due to lack of concentration (Parks, 1999). It depersonalizes the class environment (Sammons, 1995; Bawaneh, 2011).
One study showed a decrease in performance of students when the instructor switched from transparencies to PowerPoint (Bartlett, Cheng and Strough, 2000; Bartsch and Cobern, 2003). For better performance of students, graphics used I presentation must be relevant and explaining the concept (Bartsch&Cobern, 2003; Holzl, 1997; Mayer, 2001; Seaman, 1998). According to Bartsch&Cobern (2003), inclusion of irrelevant graphics in slides caused a decrease in performance of students on quizzes
Apperson, Laws and Scepansky 2008). Steven Strand an academic administrator from University of
California at Los Angeles in the life sciencescore curriculum program shared his experience, according to him,when he started sharing and uploading PPT on the Web, attendance of the students dropped by 20% (Young, 2004; El Khoury and Mattar, 2012). Şengün and Turan (2004) identified that students are
significantly inclind to PowerPoint presentations considering it more suitable for physical geography subjects within geographical discipline (Can, Karaca, Akyel, and Demirci, 2012). Amare (2006) stated that performance of students was higher who taught by using traditional methodology, although some of the students emphasized on the use of PowerPoint. The same results found by Sosin et al., 2004;
Bawaneh, 2011).
Some research studies (e.g. Apperson et al. (2008), Albrecht &Sach (2000) and Perry & Perry 1998), researchers concluded that delivering accounting lecture through multimedia e.g. PowerPoint increased students‟ interest and motivation for the course (Can, Karaca, Akyel, and Demirci, 2012). PowerPoint motivates the students to attend the lessons (James vd 2006: 387, Sugahara and Boland 2006: 396,
Bawaneh, 2011). Savoy et al. (2009) identified that preference for lecturing technique varies by the
nature of the course. In condition where the course contains complex graphs, animations and figures, the students preferred lecturing through PowerPoint presentation and considered it advantageous. On the other hand, it was demonstrated the preference of students for the traditional method and for PowerPoint slides in the situation where the course contains numerical information. One empirical study conducted by managerial accounting course given to two groups by PowerPoint and on the blackboard. Results showed PowerPoint presentations developed positive attitude of students towards the lecturer and the lesson (Selimoglu and Arsoy 2009).
Çankaya&Dinç (2009) found that the students who were taught through PowerPoint were more successful in academic performance than the students who were lectured by classical method. Additionally, when students‟ perception regarding to accounting course was analyzed, it uncovered the students who were taught by PowerPoint felt that course more attractive, enjoyable and relaxing. They found it more beneficial. The students who were lectured in the classical manner, found the course more tedious, boring and more tiresome than the other group (Can, Karaca, Akyel and Demirci 2012).
Summarizing above literature,mostly existent studies showed positive attitude of students‟ towards PowerPoint opposing to traditional teaching method, through no considerable difference in performance
73 academic performance has demonstrated mixed results. Some scholars found it increases performance of students (Mantei, 2000;Kask, 2000, female students; Lowry, 1999; Szabo and Hastings, 2000, Exp. 2) whereas others have found no effect (Daniels, 1999; Kask, 2000, male students; Rankin &Hoaas, 2001; Szabo& Hastings, 2000, Exps. 1 & 3; Boyce, 1999). Key objective of this paper is to explore the differences in the accounting students performance and attitude toward the two different teaching methods i.e. PowerPoint presentations and traditional writing on board technique.
Conceptual Model
3. Methodology
This is quantitative research based on a concept of effectiveness of two different teaching methods i.e. Traditional (on the board) and PowerPoint (through multimedia). The attitude of students toward these two teaching methodologies is measured by questionnaire based on items related to these two styles. Scale was adopted from previous study (El Khoury, and Mattar, 2012). Five-point Likert scale is used from 1 to 5, going from strongly disagree to strongly agree and by taking 3 as a neutral option. Data was analyzed by using SPSS version 20 and Microsoft Excel.
We have taken three courses of accounting to study the effect of two different styles, which are financial accounting, cost accounting and managerial accounting. Data is collected from the students of various universities of Multan. Through questionnaire we tried to ask them their preference to study these courses. And by which method they are more convenient.
We have taken the sample of 282 students. We are intending to do analysis of our data through SPSS. We have adopted cross sectional design, under which at the end of questionnaire we have asked the students their GPAs in three courses and overall GPA. We also have asked them their preference between the two teaching styles by giving the two options, and the methodology adopted by their instructor. Hence we adopted purposive sampling technique.
Our research questions are:
1. Is there any difference between the impacts of the two teaching methods on materials understandability?
2. How much is the effectiveness of the two teaching methods on the teaching/learning process? Material
Understandability
Learning Effect
Entertainment
Teaching Methodology Traditional PowerPoint
74
3. What isattitudes of students towards the two teaching methods applied? 4. What is preference of studentsfor the two teaching methods?
5. What is the effectof the two teaching methods on students‟ performance(i.e.,grade)?
4. Analysis
Table 1 presents the demographic characteristics of sample. Out of 282, 59.9% were male , while 40.1% were female.
Table 1
Frequency Percent
Male 169 59.9%
Female 113 40.1%
Total 282 100%
Table 2 (a) shows that 34% of students in sample study financial accounting with PowerPoint, and remaining 66% study with whiteboard and board marker.
Table 2(a) : Financial Accounting teaching methodology Percent
Traditional 66%
PowerPoint 34%
Total 100%
Table 2 (b) shows that 21.6% of students in sample study cost accounting with PowerPoint, and remaining 78.4% study with traditional method.
Table 2(b) : Cost Accounting teaching methodology Percent
PowerPoint 21.6%
Traditional 78.4%
Total 100%
Reliability Analysis
Chronbach‟s alpha was use to measure the reliability of the test. This study used chronbach‟ alpha to evaluate the internal consistency of questionnaire administered to students. Alpha values range from 0 to 1. George and Mallery (2003) provide the following rules of thumb:“Chronbach‟s alpha > .9 – Excellent, Chronbach‟s alpha > .8 – Good, Chronbach‟s alpha > .7 – Acceptable, Chronbach‟s alpha > .6 – Questionable, Chronbach‟s alpha > .5 – Poor, and Chronbach‟s alpha < .5 – Unacceptable” (p. 231)[16]. Alpha value of traditional method was found to be .889, which reflects high questionnaire internal consistency. Alpha value of traditional method was found to be .891, which high questionnaire internal consistency ( Appendix A)
Factor Analysis
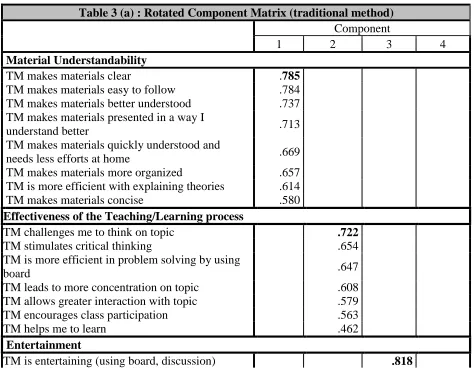
75 correlated with “TM challenges me to think on topic”. The third factor entertainment was highly correlated with” TM is entertaining (using board, discussion)”. Similarly, the fourth factor dullness was highly correlated with “TM is tiresome”. KMO was measure of sampling adequacy its value was 0.861. Bartlett's Test of Sphericity also shows significance.
Table 3(b) shows the variance explained was 57.68%. We can use these four components to reduce the complexity of the data with 42.32% loss of information.
On different statements describing modern teaching methodology i.e. PowerPoint, factor analysis was conducted. Table 4(a) shows that material understandability was highly correlated with question “PPT makes materials better understood”. The second factor effectiveness of teaching and learning process was highly correlated with “PPT is more efficient in problem solving”. The third factor entertainment is highly correlated with” PPT makes materials enjoyable (as I understand more easily). Similarly, the fourth factor dullness is highly correlated with “PPT is tiresome”. The sampling adequacy measure KMO shows value of 0.873. Bartlett's Test of Sphericity shows significance with value “zero”. Table 4(b) shows the variance explained was 59.405%. We can use these four components to reduce the complexity of the data with 40.595% loss of information.
Mean and t-test
Means calculated for two different groups of data i.e. “Traditional” and “PowerPoint”. This method was used to check that, what is the impact of teaching methodology on student‟s material understanding, assess effectiveness of the teaching/learning process, and whether the attitude toward it is positive or negative.
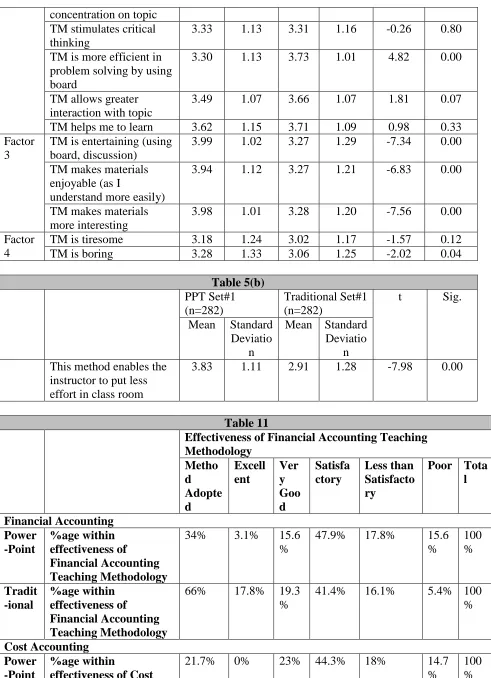
Table 5 in appendix A shows that all the statements under factor one (material understandability), show significant variance for “PPT” and “Traditional” method of teaching. In factor two(Effectiveness of the Teaching/Learning process) five statements –“ TM makes note taking easier”, “TM challenges me to think on topic”, “TM stimulates critical thinking”,” TM allows greater interaction with topic”, and “TM helps me to learn” did not show significance variance forTraditional and PPT method of teaching”. In factor three which is entertainment, all statements shoe significance variance for “PPT” and “Traditional” method of teaching”. In fourth factor (Dullness), one statement “TM is tiresome” don‟t dhow significance for “TM is tiresome”.
Student’s preferences
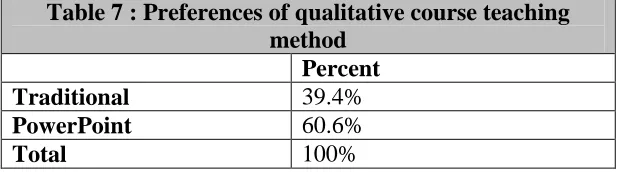
Students were asked about their preferences of teaching methodology in qualitative as well as quantitative courses. They were also asked about their preferences of teaching methodology of financial and cost accounting. Table 7 shows that 60.6% of students choose qualitative courses to be taught by PowerPoint, and 39.4% students prefer traditional method of teaching for qualitative courses.
Table 7 : Preferences of qualitative course teaching method
Percent
Traditional 39.4%
PowerPoint 60.6%
Total 100%
76
Table 6 : Preferences of quantitative course teaching method
Percent
Traditional 72%
PowerPoint 28%
Total 100%
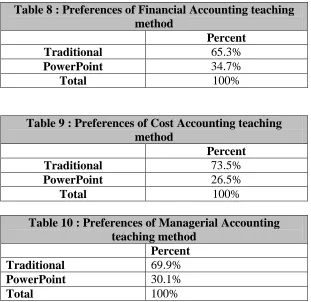
Table 8 and 9 shows the students preferences in financial and cost accounting. Table shows that 65.3% students of financial accounting and 73.5% students of cost accounting prefer traditional method of teaching while only 34.7% students of financial accounting and 26.5% students of cost accounting prefer PowerPoint method of teaching.
Table 8 : Preferences of Financial Accounting teaching method
Percent
Traditional 65.3%
PowerPoint 34.7%
Total 100%
Table 9 : Preferences of Cost Accounting teaching method
Percent
Traditional 73.5%
PowerPoint 26.5%
Total 100%
Table 10 : Preferences of Managerial Accounting teaching method
Percent
Traditional 69.9%
PowerPoint 30.1%
Total 100%
Effectiveness
Table 10 in appendix A shows the effectiveness of two teaching methodologies in each of three courses. The table shows that most students indicate that teaching methodology adopted is satisfactory.
Regression
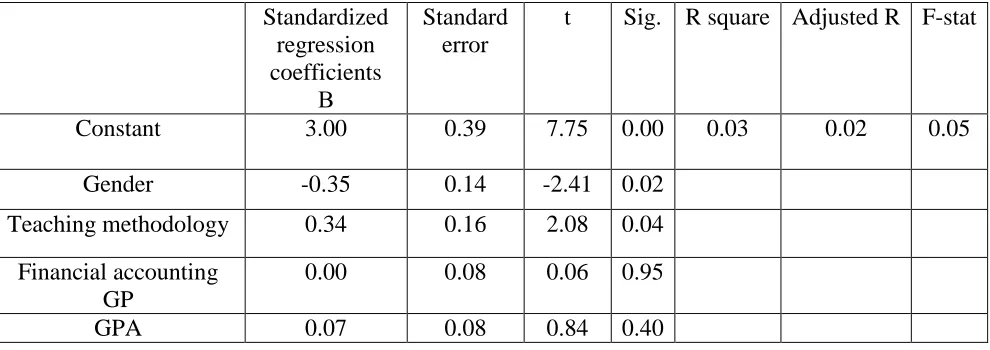
Regression was run to measure the impact of independent variables-students final grade in financial accounting, teaching methodology, gender, overall GPA, and students‟ final grade in cost accounting. Teaching methodology and gender are dummy variables. Table 10 shows the regression when taking GPA cost accounting as independent variable.
77 Standardized
regression coefficients
Β
Standard error
t Sig. R square Adjusted R F-stat
Constant 3.00 0.39 7.75 0.00 0.03 0.02 0.05
Gender -0.35 0.14 -2.41 0.02
Teaching methodology 0.34 0.16 2.08 0.04
Financial accounting GP
0.00 0.08 0.06 0.95
GPA 0.07 0.08 0.84 0.40
The table 12 shows positive value of coefficient of teaching methodology. This positive value shows that PPT has positive impact on student‟s performance. The results also show that, teaching methodology and gender correlate with student‟s performance. The value of adjusted r square shows that dependent variables explained only 2% of variance in student‟s performance.
Table 13: Regression Standardized
regression coefficients
Β
Standard error
t Sig. R square Adjusted R F-stat
Constant 2.05 0.27 7.81 0.00 0.17 0.16 13.99
Gender -0.05 0.11 -0.49 0.63
Teaching methodology -0.00 0.12 -0.02 0.98
Cost accounting GP 0.07 0.02 3.36 0.00
GPA 0.39 0.06 6.46 0.00
Table 13 shows the regression when taking GPA managerial accounting as independent variable. The
table shows negative value of coefficient of teaching methodology. This negative value shows that PPT has negative impact on student‟s performance. The results also show that, GPA and teaching methodology correlate with student‟s performance. The value of adjusted r square shows that dependent variables explained 16% of variance in student‟s performance.
5. Results And Conclusion
The responses of students show that traditional method has greater material understandability as compare to PPT. The finding of this study contradicts to Nouri and Shahid (2005), which shows more understanding with PPT. The results shows that using traditional method makes lectures more organized, easier to understand, more clearer, concise, and need less effort at home. The results
supported by previous research conducted by Hashmezadeh and Wilson (2007). The finding of
78
Moreover, students when taught with PowerPoint spend less time in notes taking as they can get material discussed in class. The instructor can cover more content in less time, this results in lower level of material understandability. On the other hand, when students are taught with white board they have more time to analyze and decide which note to note. They can better understand material in class due to low speed of instructor and pauses during the teacher write on board. The results of this study also prove that less effort is needed at home when taught with traditional method of teaching in class. The results also shows that students have perception that when instructor use PPT in class they put less effort and this reduces the student‟s attention and interest in class (table 5-b).
The second factor of effectiveness of teaching/learning process shows significance difference between two teaching styles except four statements as mentioned in table 5. The results of this study reveal that there is a significant difference in student‟s attitude toward lectures delivered using traditional methodology. Students perceive that in traditional way there is a room for participation while, in PPT, the lecture was preplanned and student hesitate to interrupt the teacher. Hlynka and Mason (1998)
mention that there is less interaction between student and teacher due to sequence of slides. Parks (1999)
concludes that the presentation via PPT make students in U.S Universities to sleep, this may be due to dim light. While traditional method give chance to students as well as to teachers to discuss the material and interact with each other. This results in more student engagement in class. Pippert and Moore (1999) also supported that the use of PPT in class might lower the quality of interaction between teacher and student.
The third and fourth factor is related to the student‟s attitude. These are entertainment and dullness. The results of this study suggest that there is a significant difference between traditional method and PowerPoint presentation. Students found traditional method as more entertaining as it encourage class participation and on the other hand PPT makes students sleep in class. Earlier studies found opposite
results. They found PPT as more entertaining method of teaching (Butler and Mautz 1996; Nouri and
Shahid, 2005).
Students perceive PPT as more boring and tiresome. They perceive that the material in slides is important and they don‟t pay attention to what teacher discuss in class as they can get slides. These factors make PPT more boring and tiresome. The results reveal that traditional method is more tiresome as students have to be attentive in class and participate during lecture. Students have to make notes during class as they cannot get any material. They also filter the data during class as which material, example is important and make it easier at home to understand the concept at home. So, in traditional lecture students perform two functions. First, understanding material and concept delivered by instructor. And second, recording material by filtering the data because no hard or soft copies for the material distributed by the teacher.
The study shows that students prefer traditional method of teaching for quantitative courses in general and specifically accounting courses. While the prefer PPT for qualitative courses such as management, marketing, organization behavior etc.
79
Implications, Future Research Directions And Limitations
This research helps instructors to understand the attitude of students and effectiveness of teaching methodology. They can avoid weaknesses of the medium to convey more effectively. This study is conducted in city of Multan Pakistan, on the students of private and government universities located there. It is generalizable in the context of southern Punjab. While more exploratory research can be done by taking sample of universities of upper Punjab and other provinces. We explored the effectiveness of the two styles in accounting discipline by taking data specifically on three courses of the accounting. Same objective can be applied for analyzing impacts in other disciplines i.e. qualitative and other quantitative courses. Broad level theoretical literature exists and differences can be analyzed between the two approaches whether lecturer can be benefited by the advantage of time saving, effective graphical representation and conciseness through the PowerPoint medium.
References
Amare, N. (2006). To slide wear or not to slide wear: Students experiences with PowerPoint
VsLecture[p‟;/h. Journal of Technical Writing and Communication, 36(3), 297-308.
Apperson, J. M., Laws, E. L., &Scepansky, J. A. (2008). An assessment of student preferences for
PowerPoint presentation structure in undergraduate courses. Computers & Education, 50(1),
148-153.
Apperson, J.M., Laws, E.L., &Scepansky, J.A. (2006).The impact of presentation graphics on students‟
experiences in the classroom.Computers and Education, 46(1), 116-126.
Akkoyunlu B. Yilmaz M. (2005), Generative Theory of Multimedia Learning,
HacettepeUniversitesiEgitimFakultesiDergisi, 28, 9-18.
Akdağ, M., Tok, H. (2008).GelenekselÖğretimile PowerPoint
SunumDestekliÖğretiminÖğrenciErişisineEtkisi.EğitimveBilim, 33 (47), 26-34.
Albrecht, W. S., Sack, R. J. (2000), Accounting Education: Charting the Course through a Perilous Future, Accounting Education Series, No: 16.
Beets, S. D., &Lobingier, P. G. (2001). Cyber Dimensions: Pedagogical Techniques: Student
Performance and Preferences. Journal of education for business, 76(4), 231-235.
Boyce, G. (1999). Computer-assisted teaching and learning in accounting: pedagogy or
product?.Journal of Accounting Education, 17(2), 191-220.
Butler, J. B. and Mautz, D. (1996) Multimedia presentations and learning: A laboratory experiment,
Issues in Accounting Education, 11 (2), pp. 259-280.
Bartsch, R. A., &Cobern, K. M. (2003).Effectiveness of PowerPoint presentations in lectures.Computers
& Education, 41(1), 77-86.
Bawaneh, S. S.(2011). Does using computer technology improve students‟ performance? Evidence from
a management accounting course.International Journal of applied Science and technology,
10(2), 266-274
Bartlett, R. M., Cheng, S., &Strough, J. (2000, August).Multimedia versus traditional course instruction in undergraduate introductory psychology. Poster presented at Annual American Psychological Association, Washington, DC.
Bhaskar, K. N. (1982). Use of computers in accountancy courses. Accounting and Business Research, 12(45), 3-10.
Borthick, A. F., & Clark, R. L. (1987). Research on computing in accounting education: Opportunities and impediments. Issues in Accounting Education, 2(2), 173-192.
Can, A. V., Karaca, N., Akyel, N., &Demirci, S. D. (2012). Evaluating the Fitness of Lecturing with
Powerpoint Presentations for Accounting Education-Research at Sakarya University.
Procedia-Social and Behavioral Sciences, 55, 128-137.
80
(2009).Powerpointveklasikusuldemuhasebeeğitimialanöğrencilerarasındakifarklılıklarıntespiti: KaradenizTeknikÜniversitesindebiraraştırma.
KocaeliÜniversitesiSosyalBilimlerEnstitüsüDergisi, 17(1), 28-52.
Daniels, L. (1999). Introducing technology in the classroom: PowerPoint as a first step.Journal of
Computing in Higher Education, 10(2), 42-56.
Evans, L., (1998). ―Preliminary Study: Lectures Versus PowerPoint. 4.0‖, available at http://www.kcmetro.cc.mo.us/longview/lect_ppt.HTM.
El Khoury, R. M., &Mattar, D. M.(2012). PowerPoint in Accounting Classrooms: Constructive or
Destructive?.International journal of business and social sciences, 10(3), 240-259
Frey, B.A. & Birnbaum, D.J. (2002).Learners‟ perceptions on the value of PowerPoint in lectures.
Springfield, VA: ERIC Document Reproduction No. ED 467192.
Farkas, D.K. (2006). A Heuristic for Reasoning about PowerPoint Deck Design. Proceedings of the 2008 International Professional Communication Conference, Montreal, Canada, July 13-16. Gabriel, Y. (2008). Against the tyranny of PowerPoint: Technology-in-use and technology abuse.
Organization Studies, 29(02), 255-276.
Garner, R. (1992) Learning from school texts, Educational Psychologist, 27, 53–63 (cited in Susskind, J. E. (2005). PowerPoint‟s power in the classroom: Enhancing students‟ self-efficacy and attitudes, Computers and Education, 45 (2), 203-215).
George, D., &Mallery, P. (2003).SPSS for Windows step by step: A simple guide and reference. 11.0 update (4th ed.). Boston: Allyn& Bacon.
Hashemi, M., Azizinezhad, M., &Farokhi, M. (2012).Power point as an innovative tool for teaching and
learning in modern classes.Procedia-Social and Behavioral Sciences, 31, 559-563.
Hashemzadeh, N. and Wilson, L . (2007) Teaching with the lights out: What do we really know about the impact of technology intensive instruction? College Student Journal, 41 (3), 601-612.
Hlynka, D. and Mason. R (1998) PowerPoint in the classroom: what is the point? Educational Technology, 38 (5), 45–48.
Holzl, J. (1997). Twelve tips for effective PowerPoint presentations for the technologically challenged. Medical Teacher, 19(3), 175–179.
Harknett, R.J. &Cobane, C.T. (1997).Introducing instructional technology to international relations.Political Science and Politics, 30(3), 496-500.
Hawkins, D., & Allen, B. (1967). Computer-assisted case analysis. The Accounting Review ,788-800. Helmi, M. A. (1986). Integrating the microcomputer into accounting educationÐapproaches and pit-
falls.Issues in Accounting Education, 1(1), 102-111.
Holley, C. L. (1995). Using general ledger software in an accounting systems course.Journal of Accounting and Computers, 11.
Jordan, L. A., & Papp, R. PowerPoint®: It‟s not “Yes” or “No”–it‟s “When” and “How”.
James, K.E., Burke, L.A., Hutchins, H.M. (2006). Powerful or pointless?faculty versus student perceptions of powerpoint use in business education. Business Communication Quarterly, 69,
374-396.
Kask, S. (2000).The impact of using computer presentations (CAP) on student learning in the microeconomics principles course. Paper presented at the meeting of the American Economic Association, Boston.
Kahraman, S., Çevik, C., &Kodan, H. (2011). Investigation of university students‟ attitude toward the
use of powerpoint according to some variables. Procedia Computer Science, 3, 1341-1347.
Kozub, R. M. (2010). Student Attitude Towards And Use Of Powerpoint® Slides As Study Guides In
Undergraduate Introductory Financial Accounting. Journal of College Teaching & Learning
(TLC), 7(3).
81 McCannon, M. and Morse, G. E. (1999) Using multimedia visual aids in presentations: The demise of
the transparency has been greatly exaggerated, TechTrends, 43 (6), pp. 29-31.
Mantei, E.J., (2000). Using internet class notes and PowerPoint in the physical geology lecture.Journal of College Science Teaching, 29,301-305.
Moreno, R., & Mayer, R. E. (2000). “A Coherence Effect In Multimedia Learning: The Case For Minimizing Irrelevant Sounds In The Design Of Multimedia Instructional Messages.” Journal of Educational Psychology, 92(1), 117-125.
Mayer, R. E. (2001). Multimedia learning. New York: Cambridge University Press.
Miller, R. B. and McCown, R.R. (1986) Effects of text coherence and elaboration on recall of sentences within paragraphs, Contemporary Educational Psychology, 11, pp. 127–138 (cited in Susskind, J. E. (2005) PowerPoint‟s power in the classroom: Enhancing students‟ self-efficacy and attitudes, Computers and Education, 45 (2), 203-215.
Nouri, H. and Shahid, A. (2005).The effect of Powerpoint presentations on student learning and attitudes.Global Perspectives on Accounting Education, 2, 53-73.
Nunberg, G. (1999) The trouble with PowerPoint. Fortune (December 20), pp. 330-331.
Nouri, H., &Shahid, A. (2008). The effects of PowerPoint lecture notes on student performance and
attitudes. The Accounting Educators' Journal, 18.
Navarro, P. (1998) Notes from the electronic classroom, Journal of Policy Analysis and Management,
17 (1), pp. 106-115.
O'Dwyer, A. (2008, January). Responses of engineering students to lectures using PowerPoint. In
Conference papers (p. 7).
Parks, R. P. (1999) Macro principles, PowerPoint, and the internet: four years of the good, the bad, and the ugly, The Journal of Economic Education, 30 (3), pp. 200–209.
Perry, T., Perry, L.A. (1998).University students' attitudes towards multimedia presentations.British Journal of Educational Technology, 29 (4), 375-377.
Pippert, T. D. and Moore, H.A. (1999) Multiple perspectives on multimedia in the large lecture,
Teaching Sociology, 27 (2), pp. 92-109.
Rosenthal, G.T., Soper, B.,Mcknight, R., Barr,J.,Wilkinsin,J.,Bergen,C.W. (2003). Multimedia. It‟s how
you use it.Computers in the School,26,77-86.
Rankin, E. L., &Hoaas, D. J. (2001). “The Use OfPowerpoint ® And Student Performance”. Atlantic Economic Journal, 29(1), 113.
Susskind, J. E. (2005). PowerPoint‟s power in the classroom: Enhancing students‟ self-efficacy and
attitudes. Computers & Education, 45(2), 203-215.
Selimoglu, S. K., &Arsoy, A. P. (2009). The effect of powerpoint preferences of students on their
performance: a research in Anadolu University. Turkish Online Journal of Distance Education,
10(1), 113-129.
Szabo, A., & Hastings, N. (2000). Using IT in the undergraduate classroom: should we replace the
blackboard with PowerPoint?.Computers& education, 35(3), 175-187.
Sammons, M. C. (1995) Students assess computer-aided classroom presentations, T. H. E. Journal,
22(10), pp. 66 - 69.
Savoy, A., Proctor, R.W., Salvendy G. (2009), Information retention from PowerPointTM and traditional lectures, Computers & Education, 52, 858-867.
Seaman, M. A. (1998). Developing visual displays for lecture-based courses.Teaching of Psychology, 25(2), 141–145.
Selimoğlu, S.K., Arsoy, A.P., Ertan, Y. (2009). The effect of powerpoint preferences of students on their performance: a research in Anadolu University. Turkish Online Journal of Distance Education- TOJDE, 10 (1), 114-129.
Şengün, M. T., Turan, M.
82
rinegöredeğerlendirilmesi.The Turkish Online Journal of Educational Technology- TOJET, 3 (1), 93-99.
Sosin, K. Blecha, J. Agarwal, R. Bartlett, R. L. and Daniel, J. I. (2004) Efficiency in the Use of Technology in Economic Education: Some Preliminary Results. American Economic Review, 94 (2), pp. 253-258.
Stewart, J., & Howard, T. P. (1988).On the use of electronic spreadsheet assignments in the cost accounting class.Journal of Research on Computing in Education, 20(4), 384-391.
Sugahara, S. and Boland, G. (2006) The Effectiveness of PowerPoint Presentations in the Accounting Classroom. Accounting Education, 15 (4), pp. 391–403.
Tufte, E. (2003).The cognitive style of PowerPoint (Cheshire, CT: Graphics Press).
Throckmorton, J. J., & Talbot, J. (1978).Computer-supported instruction in financial statement analy-sis. The Accounting Review, LIII(1), 186-191.
Thomas, D. E. J. (2002) Technology Integrated Classes versus Traditional Classes and their Impact on User Performance and Perceptions. Proceedings of the International Conference on Computers in Education (ICCE„02).
Uz, Ç.,Orhan, F., &Bilgiç, G. (2010). Prospective teachers‟ opinions on the value of PowerPoint
presentations in lecturing.Procedia-Social and Behavioral Sciences, 2(2), 2051-2059.
Young, J.R. (2004) When good technology means bad teaching. The Chronicle of Higher Education
(November 12)
Appandix A
Table 3 (a) : Rotated Component Matrix (traditional method) Component
1 2 3 4
Material Understandability
TM makes materials clear .785
TM makes materials easy to follow .784
TM makes materials better understood .737
TM makes materials presented in a way I
understand better .713
TM makes materials quickly understood and
needs less efforts at home .669
TM makes materials more organized .657
TM is more efficient with explaining theories .614
TM makes materials concise .580
Effectiveness of the Teaching/Learning process
TM challenges me to think on topic .722
TM stimulates critical thinking .654
TM is more efficient in problem solving by using
board .647
TM leads to more concentration on topic .608
TM allows greater interaction with topic .579
TM encourages class participation .563
TM helps me to learn .462
Entertainment
83 TM makes materials enjoyable (as I understand
more easily) .799
TM makes materials more interesting .787
Dullness
TM is tiresome .857
TM is boring .833
KMO=0.861, Bartlett's Test of Sphericity Sig=0.000
Table 3(b): Total Variance explained for the factors extracted(traditional method)
Compon ent
Extraction Sums of Squared Loadings
Rotation Sums of Squared Loadings
Total % of
Variance
Cumulative %
Total % of
Variance
Cumulative %
1 6.785 33.925 33.925 4.450 22.252 22.252
2 1.846 9.230 43.156 3.046 15.230 37.481
3 1.679 8.393 51.548 2.367 11.836 49.317
4 1.228 6.139 57.687 1.674 8.369 57.687
Table 4 : Rotated Component Matrix(PowerPoint) Component
1 2 3 4
Effectiveness of the Teaching/Learning process
PPT is more efficient in problem solving. .747
PPT allows greater interaction with topic .732
PPT leads to more concentration on topic .675
PPT stimulates critical thinking .610
PPT challenges me to think on topic .606
PPT helps me to learn .542
PPT encourages class participation .507
Material Understandability
PPT makes materials better understood .755
PPT makes materials quickly understood
and needs less efforts at home .682
PPT makes materials clear .613
PPT makes materials concise .605
PPT makes materials presented in a way I
understand better .602
PPT makes materials more organized .591
PPT is more efficient with explaining
theories .530
Entertainment
PPT makes materials enjoyable (as I understand more easily with help of slides, diagrams etc)
.842
PPT is entertaining (using slides,
84
PPT makes materials more interesting .762
Dullness
PPT is tiresome .923
PPT is boring .891
KMO=0.873, Bartlett's Test of Sphericity Sig=0.000
Table 4 (b): Total Variance explained for the factors extracted (PowerPoint) Compon
ent
Extraction Sums of Squared Loadings
Rotation Sums of Squared Loadings
Total % of
Variance
Cumulative %
Total % of
Variance
Cumulative %
1 7.392 36.960 36.960 3.777 18.886 18.886
2 2.069 10.347 47.307 3.624 18.121 37.006
3 1.269 6.346 53.653 2.690 13.451 50.458
4 1.150 5.752 59.405 1.789 8.947 59.405
Table 5: Means, standard deviation and sig. for the different statements describing the students’ evaluation for the two different teaching methodologies: PPT and Traditional
PPT Set#1 (n=282)
Traditional Set#1 (n=282)
t Sig.
Mean
Standard Deviatio
n Mean
Standard Deviatio n Factor
1
TM is more efficient with explaining theories
3.53 1.19 3.31 1.22 -2.17 0.03
TM makes materials presented in a way I understand better
3.60 1.07 3.33 1.09 -3.04 0.00
TM makes materials concise
3.79 1.02 3.12 1.07 -7.60 0.00
TM makes materials easy to follow
3.91 1.08 3.50 1.11 -4.43 0.00
TM makes materials clear
3.88 1.12 3.52 1.13 -3.82 0.00
TM makes materials more organized
3.81 1.12 3.20 1.22 -6.11 0.00
TM makes materials better understood
3.67 1.09 3.32 1.20 -3.68 0.00
TM makes materials quickly understood and needs less efforts at home
3.59 1.19 3.23 1.27 -3.49 0.00
Factor 2
TM makes note taking easier
3.43 1.19 3.34 1.20 -0.85 0.40
TM encourages class participation
3.59 1.08 3.35 1.19 -2.44 0.01
TM challenges me to think on topic
3.60 1.16 3.52 1.07 -0.79 0.43
85 concentration on topic
TM stimulates critical thinking
3.33 1.13 3.31 1.16 -0.26 0.80
TM is more efficient in problem solving by using board
3.30 1.13 3.73 1.01 4.82 0.00
TM allows greater interaction with topic
3.49 1.07 3.66 1.07 1.81 0.07
TM helps me to learn 3.62 1.15 3.71 1.09 0.98 0.33
Factor 3
TM is entertaining (using board, discussion)
3.99 1.02 3.27 1.29 -7.34 0.00
TM makes materials enjoyable (as I
understand more easily)
3.94 1.12 3.27 1.21 -6.83 0.00
TM makes materials more interesting
3.98 1.01 3.28 1.20 -7.56 0.00
Factor 4
TM is tiresome 3.18 1.24 3.02 1.17 -1.57 0.12
TM is boring 3.28 1.33 3.06 1.25 -2.02 0.04
Table 5(b) PPT Set#1 (n=282) Traditional Set#1 (n=282) t Sig.
Mean Standard
Deviatio n
Mean Standard Deviatio
n This method enables the
instructor to put less effort in class room
3.83 1.11 2.91 1.28 -7.98 0.00
Table 11
Effectiveness of Financial Accounting Teaching Methodology Metho d Adopte d Excell ent Ver y Goo d Satisfa ctory Less than Satisfacto ry
Poor Tota l Financial Accounting Power -Point %age within effectiveness of Financial Accounting Teaching Methodology
34% 3.1% 15.6
%
47.9% 17.8% 15.6
% 100 % Tradit -ional %age within effectiveness of Financial Accounting Teaching Methodology
66% 17.8% 19.3
%
41.4% 16.1% 5.4% 100
%
Cost Accounting Power
-Point
%age within
effectiveness of Cost
21.7% 0% 23% 44.3% 18% 14.7
%
86
Accounting Teaching Tradit
-ional
%age within
effectiveness of Cost Accounting Teaching
78.3% 11.3% 28.5
%
41.2% 13.1% 5.9% 100
%
Managerial Accounting Power
-Point
%age within effectiveness of
Managerial Accounting Teaching Methodology
26.6% 13.7% 16.5
%
41.1% 16.4% 12.3
%
100 %
Tradit -ional
%age within effectiveness of
Managerial Accounting Teaching Methodology
73.4% 15.9% 18.8
%
49.9% 12% 3.4% 100