Nikita Pael et al., Jour. of Sci. Res. in Phar. 2012, 1(2), 25-29
J
ournal of
S
cientific
R
esearch in
P
harmacy
Research Article
Available online thr oug h
ISSN: 2277-9469
www.jsrponline.com
In Vitro
Screening of
Withania Somnifera
Plant for the Cytotoxicity study on Different Cancerous Cell Lines
Nikita Patel*, Maulik Suthar
S. K. Patel college of pharmaceutical education and research, Ganpat University, kherva, Mehsana, Gujrat, India - 384012
Received on: 07-05-2012; Revised on: 08-05-2012; Accepted on: 12-05-2012
ABS TRACT
In the present study, we performed the cytotoxicity study of Withania Somnifera plant against five different cancerous cell lines named MDA-MB-231, HEP-3B, MCF-7, A-375, K-562 by MTT assay. Mainly four extracts were prepared by soxlet extraction, methanolic extra cts of leaves and root, solvent ether extract of leaves and root. Both solvent ether as well as methanolic extracts of the plant (root as well as lea ves) possess the anti-cancer activity. Among all the four extracts, methanolic extract of leaves gives potent effect with IC50 value 88.58 µg/ml on the cell line named K-562.
KEY-WORDS: Withania somnifera, MTT assay, cancerous cell lines
INTRODUCTION
Withania somnifera is mentioned as an important drug in the ancient Ayurvedic literature. Centuries of Ayurvedic medical experience using Withania somnifera have revealed it to have pharmacological value as an adaptogen, antibiotic, a boritifacient, aphrosidiac, astringent, antiinflammatory, deobstruent, diuretic, narcotic, sedative, and tonic. Provide potent antioxidant protection [1]. S timulate the activation of
immune system cells, such as lymphocytes and phagocytes. Recently, chlorinated steroidal lactone (27-acetoxy-4b,6a-dihydroxy-5b-chloro-1 oxowitha-2,24-dienolide), a diepoxy withanolide (5b,6b,14a,15a-diepoxy-4b,27-dihydroxy-1-oxowitha-2,24-dienolide), and withaferin A isolated from withania somnifera has showed a growth inhibition and cytotoxic activity against human lung cancer cell line (NCI-H460), with withaferin A being the most potent (GI50 = 0.18 µg/mL and LC50 = 0.45
µg/mL) [2]. The aim of present investigation is to screen the Withania Somnifera plant extracts against various cancerous cell lines for its cytotoxic activity.
MATERIAL AND METHODS
Materials: Sterile:
Growth medium
Trypsin (0.25% + EDTA, 1 mM, in PBSA)
MTT: 3-(4,5-dimethylthiazol-2-yl)-2,5-diphenyltetrazolium bromide (Sigma), 5 µg/ml , filter sterilized
Sorensen’s glycine buffer (0.1 M glycine, 0.1 M NaCl adjusted to pH 10.5 with 1 M NaOH)
Microtitra tion plates (Iwaki)
Pipettor tips, preferably in an autoclavable tip box
Petri dishes (non-TC-treated), 5 cm and 9 cm or reservoir (Corning)
Universal containers or tubes, 30 ml and 100 ml
Nonsterile:
Plastic box (clear polystyrene, to hold plates)
Multichannel pipettor
Dimethyl sulfoxide (DMSO)
DMSOdispenser (optional): LabsystemsMicroplate Dispenser (Cat No 5840 127, Thermo Electron)
ELISA plate reader (Molecular Devices, with SOFTmax PRO; see also Appendix II)
Plate carrier for centrifuge (for cells growing in suspension)
*Corresponding author:
Nikita Patel
S. K. Patel college of pharmaceutical education and research, Ganpat University, kherva, Mehsana, Gujrat, India – 384012.
*E-Mail: [email protected]
Preparation of extracts:
Fresh plant parts of withania somnifera were collected fr om the botanical garden of S. K. Patel college of pharmaceutical education and research and identified by Dr. Ritesh vaidya. Soxhlet extraction was performed using classical soxhlet apparatus with accurately weighed 10g of leaf powder as well as root powder (screened through mesh 22) for 14hr. Extraction was performed with 500ml of methanol as well as solvent ether as the extracting solvents. Finally extracts were evaporated to dryness and DMSO was added into the dry extracts to achieve concentration of 1000 µg/ml.
MTT b ased cytotoxicity assay [3]: Protocol:
Plating out cells:
1. First a subconfluent monolayer culture was tripsinized, and the cells were collected in growth medium containing serum. 2. The suspension (5 min at 200 g) was centrifuged to pellet the
cells. Then the cells were resuspended in growth medium, and counted.
3. After that, the cells were diluted to 2.5–50 × 103 cells/ml,
depending on the growth rate of the cell line and allowing 20 ml of cell suspension per microtitra tion plate.
4. The cell suspension was transfered to a 9-cm Petri dish, and, with a multichannel pipette, 100 μl of the suspension was added into each well of the central 10 columns of a flat-bottomed 96-well plate (80 wells per plate), starting with column 2 and ending with column 11, thereby placing 0.5–10 × 103 cells into each well.
5. Then 100 μl of growth medium was added to the ten wells in columns 1 and 12. Column 1 would be used to blank the plate reader; column 12 helps to maintain the humidity for column 11 and minimizes the ‘‘edge effect.’’
6. The plates were put in a plastic lunch box, and incubated in a humidified atmosphere at 37◦C for 1–3 days, such that the cells were in the exponential phase of growth at the time that drug were added.
7. For nonadherent cells, a suspension was prepared in fresh growth medium. The cells were diluted to 5–100 × 103 cells/ml, and plated out only 100 μl of the suspension into round-bottomed 96-well plates. Then drug is added immediately to these plates.
Drug addition:
8. A serial threefold dilution of the cytotoxic drug in growth medium was prepared to give ten concentrations. This set of concentrations should be chosen such that the highest concentration kills most of the cells and the lowest kills none of the cells. Once the toxicity of a drug is known, a smaller range of concentrations can be used. Normally, three plates are used for each drug to give triplicate determinations within one experiment.
10. The cells were seeded in the eight wells in columns 2 and 11 with 100 μl of fresh growth medium; these cells were the controls. 11. The cytotoxic drug was added to the cells in columns 2 to 11. 12. The plates were returned to the plastic box, and incubated for a
defined exposure period. For nonadherent cells, the drug dilution was prepared at twice the desired final concentration, and 100 μl is added to the 100 μl of cells already in the wells.
Growth period:
13. At the end of the drug exposure period, the medium is removed from all of the wells containing cells, and the cells were feeded with 200 μl of fresh medium. The plates containing nonadherent cells (5 min at 200 g) were centrifuged to pellet the cells. Then the medium is removed, using a fine-gauge needle to prevent disturbance of the cell pellet.
14. The plates were feeded daily for 2–3 PDTs.
Estimation of surviving cell numbers:
15. The plate was feeded with 200 μl of fresh medium at the end of the growth period, and 50 μl of MTT was added to all of the wells in columns 1 to 11.
16. The plates were wrapped in aluminum foil, and incubated for 4 h in a humidified atmosphere at 37◦C. Note that 4 h is a minimum incubation time, and plates can be left for up to 8 h.
17. Then the medium and MTT were removed from the wells (centrifuge for nonadherent cells), and the remaining MTT-formazan crystals were dissolved by adding 100 μl of DMSO to all of the wells in columns 1 to 11.
18. The glycine buffer (25 μl per well) was added to all of the well s containing DMSO.
19. The absorbance was recorded at 570 nm immediately, because the product is unstable. the wells in column 1, which contain medium and MTT but no cells, is used as blank the plate reader.
Analysis of MTT Assay:
20. A graph of the absorbance (y-axis) against the concentration of drug (x-axis) was plotted.
21. The IC50 value was calculated as the drug concentration that is
required to reduce the absorbance to half that of the control. The mean absorbance reading from the wells in columns 2 and 11 is used as a control. The absorbance values in columns 2 and 11 should be the same. Occasionally, they are not, however, and this is taken to indicate uneven plating of cells across the plate. 22. The absolute value of the absorbance should be plotted so that
control values may be compared, but the data can then be converted to a percentage-inhibition curve, to normalize a series of curves.
RESULT AND DISCUSSION
In the present investigation, all the extracts were evaluated against various cell lines named K-562, MCF-7, HEP-3B, A-375 and MDA-MB-231. For each tested compound, Dose Response Curve (DRC) against all cell lines was plotted with 10 analysis point i.e. with 10 different drug concentrations. The concentration causing 50% cell growth inhibition (IC50) was determined from DRC using GraphPad Prism software (Ver.
5.04) (GraphPad Software, Inc., USA) and Micorsoft Excel 2007 (Microsoft Corporation, USA) application.
Amongst all the extracts of withania somnifera, metanolic extract of leaves gives highest potential effect on different cell lines. All of the extracts have lowest activity on three cell lines particularly named HEP-3B and A-375. Same way they all have potent effect on K-562 cell lines.all the extracts showed moderate effect on breast cancer cell lines named MDA-MB-231 and MCF-7. Methanolic extract of leaves showed the highest efficiency towards K-562 cell line with 88.58µg/ml.
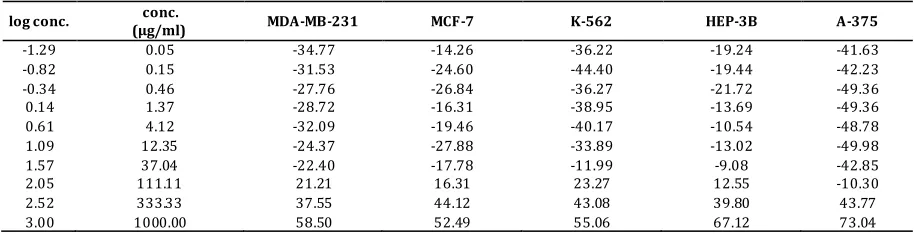
a. Activity of Methanolic extract of leaves of Withania somnifera by MTT assay:
Table No. 1: Percentage growth inhibition by Methanolic extract of leaves on various cell lines
log conc. conc.
(µg/ml) MDA-MB-231 MCF-7 K-562 HEP-3B A-375
-1.29 0.05 -34.77 -14.26 -36.22 -19.24 -41.63
-0.82 0.15 -31.53 -24.60 -44.40 -19.44 -42.23
-0.34 0.46 -27.76 -26.84 -36.27 -21.72 -49.36
0.14 1.37 -28.72 -16.31 -38.95 -13.69 -49.36
0.61 4.12 -32.09 -19.46 -40.17 -10.54 -48.78
1.09 12.35 -24.37 -27.88 -33.89 -13.02 -49.98
1.57 37.04 -22.40 -17.78 -11.99 -9.08 -42.85
2.05 111.11 21.21 16.31 23.27 12.55 -10.30
2.52 333.33 37.55 44.12 43.08 39.80 43.77
3.00 1000.00 58.50 52.49 55.06 67.12 73.04
Table No. 2: IC50 and R2 values of Methanolic extract of leaves
-100
-50
0
50
100
K-562
MCF-7
HEP-3B
Methanolic extract of leaves
A-375
MDA-MB-231
%
Ce
ll
I
n
h
ib
it
io
n
MDA-MB-231 MCF-7 K-562 HEP-3B A-375
IC50 Value(µg/ml) 150.4 184.4 88.58 314.8 335.3
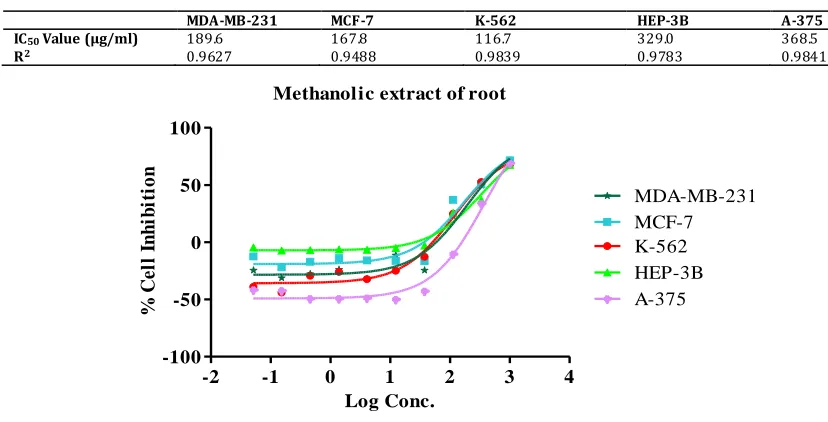
b. Activity of Methanolic extract of root of Withania somnifera by MTT assay:
Table No. 3: Percentage growth inhibition by Methanolic extract of root on various cell lines
log conc conc. (µg/ml) MDA-MB-231 K-562 MCF-7 HEP-3B A-375
-1.29 0.05 -24.45 -38.90 -12.33 -4.46 -41.63
-0.82 0.15 -31.13 -43.94 -21.93 -7.20 -42.23
-0.34 0.46 -27.63 -29.23 -17.04 -6.89 -49.36
0.14 1.37 -23.70 -25.87 -13.89 -6.14 -49.36
0.61 4.12 -31.99 -32.30 -15.81 -6.58 -48.78
1.09 12.35 -11.13 -24.96 -16.16 -4.99 -49.98
1.57 37.04 -24.39 -12.71 -16.31 -2.85 -42.85
2.05 111.11 23.14 24.88 37.02 25.70 -10.30
2.52 333.33 49.72 52.58 50.77 37.03 33.77
3.00 1000.00 71.38 67.88 71.43 67.60 69.04
Table No. 4: IC50 and R2 values of Methanolic extract of root
-2
-1
0
1
2
3
4
-100
-50
0
50
100
K-562
MCF-7
HEP-3B
Methanolic extract of root
A-375
MDA-MB-231
Log Conc.
%
Ce
ll
I
n
h
ib
it
io
n
Fig. 2: Dose response curve of Methanolic extract of root. Serially diluted Methanolic extract of root in DMSO was incubated with the above mentioned cell lines for 24 hrs. then MTT dye was add ed. Absorbance was taken after add ing solubilizing agent at 540 nm wavelength in the
ELISA plate reader. Th e data w ere analysed with graphpad prism, sigmoidal dose response and IC50 valu e was determined .
c. Activity of solvent ether extract of leaves of Withania somnifera by MTT assay:
Table No. 5: Percentage growth inhibition by Solvent ether extract of leaves on various cell lines
log conc conc. (µg/ml) MDA-MB-231 MCF-7 K-562 HEP-3B A-375
-1.29 0.05 -37.91 -10.97 -27.64 -9.59 -31.45
-0.82 0.15 -25.73 -18.76 -39.14 -18.95 -41.20
-0.34 0.46 -25.10 -21.16 -36.01 -17.95 -36.87
0.14 1.37 -19.49 -19.05 -30.82 -19.73 -40.04
0.61 4.12 -33.66 -19.30 -32.72 -17.34 -39.30
1.09 12.35 -16.14 -18.76 -26.96 -15.54 -46.56
1.57 37.04 -20.31 -16.70 -19.05 -9.68 -40.35
2.05 111.11 22.32 22.33 19.52 12.10 -3.03
2.52 333.33 46.33 49.14 40.07 44.22 29.51
3.00 1000.00 71.67 64.53 66.96 67.22 59.99
Table No. 6: IC50 and R2 values of Solvent ether extract of leaves
MDA-MB-231 MCF-7 K-562 HEP-3B A-375
IC50 Value (µg/ml) 189.6 167.8 116.7 329.0 368.5
R2 0.9627 0.9488 0.9839 0.9783 0.9841
MDA-MB-231 MCF-7 K-562 HEP-3B A-375
IC50 Value (µg/ml) 188.2 206.5 165.1 301.4 351.9
-2
-1
0
1
2
3
4
-50
0
50
100
K-562
MCF-7
HEP-3B
Solvent ether extract of leaves
A-375
MDA-MB-231
Log Conc.
%
Ce
ll
I
n
h
ib
it
io
n
Fig. 3: Dose response curve of Solvent ether extract of leaves. Serially diluted solvent ether extract of leaves in DMSO w as incubated with the above mentioned cell lines for 24 hrs. then MTT dye was add ed. Absorbance was taken after adding solubilizing agent at 540 nm wavelength
in the ELISA plate reader. The d ata were analysed with graphpad prism, sigmoidal dose response and IC50 value w as determined
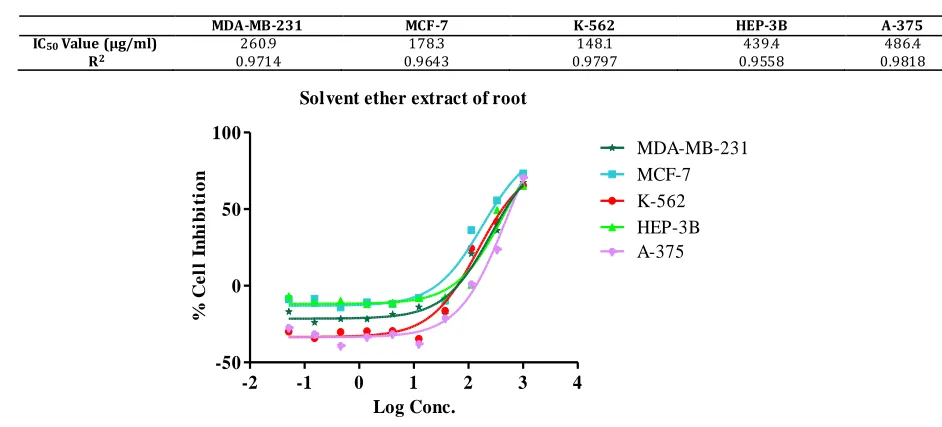
d. Activity of Solvent ether extract of root of Withania somnifera by MTT assay:
Table No. 7: Percentage growth inhibition by Solvent ether extract of root on various cell lines
log conc conc. (µg/ml) MDA-MB-231 MCF-7 K-562 HEP-3B A-375
-1.29 0.05 -16.91 -8.71 -29.93 -6.89 -27.20
-0.82 0.15 -23.86 -8.58 -34.13 -11.08 -31.45
-0.34 0.46 -21.56 -14.10 -30.17 -9.77 -39.03
0.14 1.37 -21.79 -10.81 -29.58 -11.96 -33.30
0.61 4.12 -18.67 -11.90 -29.53 -11.05 -31.41
1.09 12.35 -13.79 -7.97 -34.63 -8.00 -37.82
1.57 37.04 -18.44 -9.66 -16.35 -7.34 -21.08
2.05 111.11 21.02 36.25 24.34 0.74 1.24
2.52 333.33 36.18 55.73 41.64 49.44 23.84
3.00 1000.00 67.48 73.24 65.45 65.28 70.67
Table No. 8: IC50 and R2 values of Solvent ether extract of root
-2
-1
0
1
2
3
4
-50
0
50
100
K-562
MCF-7
HEP-3B
Solvent ether extract of root
A-375
MDA-MB-231
Log Conc.
%
Ce
ll
I
n
h
ib
it
io
n
Fig. 4: Dose response curve of Solvent ether extract of root. Serially diluted solvent ether extract of root in DMSO was incubated wi th the above mentioned cell lines for 24 hrs. then MTT dye was add ed. Absorbance was taken after adding solubilizing agent at 540 nm wavel ength
in the ELISA plate reader. The d ata were analysed with graphpad prism, sigmoidal dose response and IC50 value w as determined
MDA-MB-231 MCF-7 K-562 HEP-3B A-375
IC50 Value (µg/ml) 260.9 178.3 148.1 439.4 486.4
Ganpat University, for the authentification of the plant, Withania Somnifera.
REFERENCES:
1. Panda S, Kar A. Evidence for free radical scavenging activity of ashwagandha root powder in mice. Indian J Physiol Pharmacol1997;41:424-426.
2. M. Iqbal Choudhary, Shabbir Hussain, Sammar Yousuf, Ahsana Dar, Mudassar, Atta-ur Rahman, Chlorinated and diepoxy withanolides from Withania somnifera and their
cytotoxic effects against human lung cancer cell line. 2010; 2205:2205-9.
3. Freshney, R. I., Culture of Animal Cells A Manual of Basic Technique, Fifth Edition, New York, Wiley-Liss. Chapter 22.,2005; 366, 359-373.
4. Mosmann, T., Rapid colorimetric assay for cellular growth and survival: application to proliferation and cytotoxicity assays. J. Immunol. Methods ;1983: 65, 55.