GSJ: Volume 7, Issue 11, November 2019, Online: ISSN 2320-9186
www.globalscientificjournal.com
R
ELIABILITY
A
NALYSIS
O
F
L
OCAL
D
ISTRIBUTION
S
YSTEM
U
SING
D
ISPERSED
D
ISTRIBUTED
G
ENERATION
Perniya Binte Akram, Muhammad Naeem Arbab, Sanaullah Ahmad
Engr.Perniya Binte Akram is currently pursuing masters degree program in electric power engineering in University of Engineering & Techonology Peshawar,Pakistan,. E-mail: [email protected]
Prof.Dr.Muhammad Naeem is currently working as a Professor in University of Engineering & Techonology Peshawar, Pakistan,. E-mail:[email protected]
Engr.Sanaullah Ahmad is working as a lecturer in Iqra National University and is also a Phd Scholar specializing in Electrical Engi-neering Power.
KeyWords
DG, Dispersed, EENS, ECOST, Reliability, SAIDI, SAIFI,
ABSTRACT
I I
NTRODUCTIONlectrical power system are real time systems as the power is produced, conducted and spread the moment the switch is turned on. The power generated by electrical power plants should fulfill the required electricity demand. The generation, transmis-sion and distribution section of a traditional power plant are shown in Fig1. The capacity of power system mainly relies on the size and kind of power plant used. The range of capacity of a power plant ranges from MW to GW. The thermal and stability limit should be set such that the distribution system operates close to them [1].
Fig1. Structure of a Power System
In modern ages, the main problems faced by distribu-tion companies is the use of distribudistribu-tion generadistribu-tion in a network. The planning and evaluation of distributed generators (DGs) for residential, commercial and in-dustrial loads must be done beforehand [2].Redesigning of network in distributed generation (DG) with an objective to solve power and voltage problem is presented in [3].In conventional power sys-tem, power is transferred to consumer through trans-mission lines resulting in technical difficulties. If dis-tributed generators are installed close to the load cen-ters the voltage profile can be improved hence elimi-nating transmission losses.
Distributed Generation & Reliability
The places where central generation is not practical and there are flaws in the transmission system the dis-tributed generators can provide benefit for consumers. DG are also known as Distributed Energy Resources (DER). The benefits of DG when connected in an electric system are: [4]
The cost of transmission is reduced when DG is allocated closer to load.
The time required for construction of smaller plants is reduced
Adequacy to the sector competition policy.
Energy can be obtained from two types of sources namely Renewable and non-renewable source. The advantages that can be attained by injecting DG into power system have been discussed by policy makes and power generation companies [5]. The characteris-tic of DG effects the benefits that can be obtained from it.
This relies on using type of DG such as wind, photo-voltaic system, loads used, renewable sources and generating system [6]. This research will review the technical, commercial and environmental benefits of using DGs which are reducing line-losses and im-proved reliability. The rising energy demand and oil prices has compelled researchers to focus on use of renewable energy sources[7]. Commonly used renew-able energy sources used for DGs are discussed in this chapter.
By connecting DG, the profile of voltage has a promi-nent effect. Certain areas have low voltage profiles, this can be improved by using DGs. The effect on voltage and power have been discussed in different papers.
[8] Analyses a local distribution system and the result of power quality on it by using renewable energy sources. The research paper discusses the use of power electronics with distributed generation. It discusses the effect of changes in environment due to the distor-tions. The performance and efficiency of the results are tested by changing levels of renewable sources in reference to the control action being set.
The effect of DG in power network is examined in [9]. Different issues encountered in installation of DG such as losses in power, voltage profile and harmonics are also analyzed. In order to alter voltage from its al-lowed range a DG can be installed by changing the settings of voltage regulator. Voltage regulation tech-nique is also proposed. Voltage control mode is
ferred when inserting DG based on simulation result [10].
The impact of voltage control in distribution system using renewable generation are discussed in [11]. The voltage alleviation can be achieved if the control equipment is based on smart grids concept specifically at the demand side.
A current correction approach is presented in [12]. A detail of asymmetrical power flow is present in this paper. The approach is quite flexible as a number of phase and conductors can be considered. A number of technical and operational challenges are related to DG when more than one DG is inserted although DG is able to achieve the increased demand of energy [13]. Power quality and voltage fluctuations can be ana-lyzed through fast Fourier and discrete Fourier trans-form. A number of techniques are analyzed and their merits and de merits are also mentioned [14].
[15] A multi objective model that suggests optimal po-sition and dimension of distributed generation that can decrease loss by means of genetic algorithm is pre-sented. Multiple generation that can support reliability indices is presented using analytical schemes. Load is considered and uncertainty is not involved in the load values. Impact of dispersed distributed generation through optimization approach is analyzed [16].
II Research Methodology
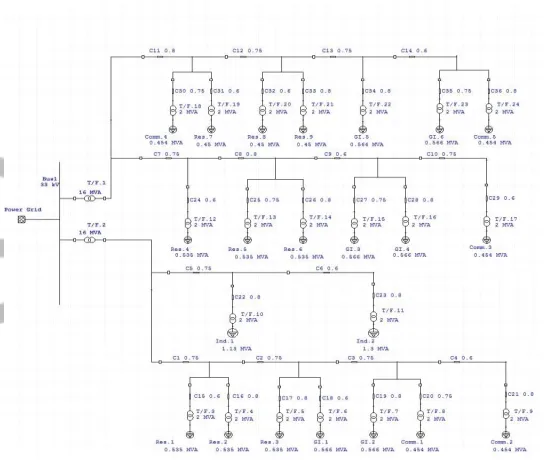
In this research work, a modified Roy Billinton Test System(RBTS) developed for a local distribution sys-tem is modeled[17]. This modified RBTS consists of five load buses, two buses used as generator buses , circuit breakers, nine transmission lines, feeders/ con-ductors, and eleven generation components. The total capacity installed is 240MW and maximum load is 185MW. Fig 2 shows an RBTS developed for distri-bution system. It is developed by Saskatchewan Uni-versity for educational purpose.
Fig 2. RBTS for a distribution system
The assumptions and limitations considered are as mentioned below:
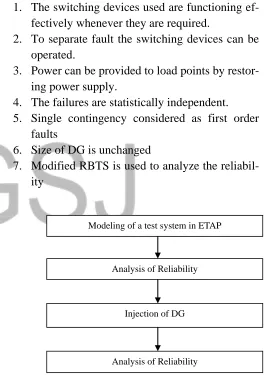
1. The switching devices used are functioning ef-fectively whenever they are required.
2. To separate fault the switching devices can be operated.
3. Power can be provided to load points by restor-ing power supply.
4. The failures are statistically independent. 5. Single contingency considered as first order
faults
6. Size of DG is unchanged
7. Modified RBTS is used to analyze the reliabil-ity
Fig 3. Block diagram methodology used
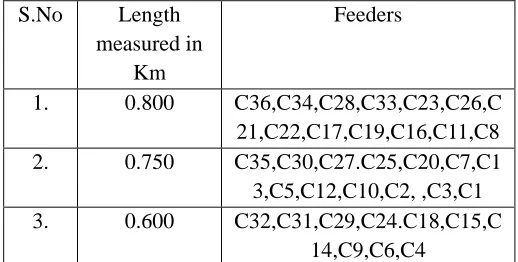
The Distribution system is modeled by using ETAP and tests for different indices are performed by assigning values as mentioned in Table 1, 2, 3, 4 and 5.Table 1 shows the distance of line from feeder in km. Table 2 show the data that is used for different loads such as industrial, residential and commercial. Table 3, and 4 show the data for
dif-Modeling of a test system in ETAP
Analysis of Reliability
Injection of DG
ferent reliability parameters such as rate of failure, switching time, repair time, the distance of load points from feeder for different components and wind turbine.
Table 1: Feeder Section in Kms
Table 2: Details of each components
Component used Failure Rate(f/Yr) Time of repair (hr) Time of switching(hr) Reliability data for T/F
33.0/11.0 kv 0.0150 15.0 01 11.0kv/220.0 v 0.0150 10.0 01
Reliability data for Breakers
33.0 kv 0.0020 04 01 11.0 kv 0.0060 04 01
Reliability data for Busbars
33.0 kv 0.0010 02 01 11.0 kv 0.0010 02 01
Reliability data for Feeders
11.0 kv 0.6500 5.0 01 Table 3: Data For Load Points
Customer’s nature Load in MVA Total Customers Residential
Res.1 0.5350 210.0 Res.2 0.5350 200.0 Res.3 0.5350 200.0 Res.4 0.5350 210.0 Res.5 0.5350 210.0 Res.6 0.5350 200.0 Res.7 0.4500 200.0 Res.8 0.4500 200.0 Res.9 0.4500 200.0
Government & Institutions(GI)
GI 1 0.566 01 GI 2 0.566 01 GI 3 0.566 01 GI 4 0.566 01 GI 5 0.566 01 GI 6 0.566 01
Commercial load
Comm1 0.4540 10.0 Comm2 0.4540 10.0 Comm3 0.4540 10.0 Comm4 0.4540 10.0 Comm5 0.4540 10.0
Industrial load
Ind.1 1.130 01 Ind.2 1.130 01 Total 12.486 1888
Table 4: Reliability Data for Wind tur-bine
III Mathematical Modeling
IEEE has defined the reliability indices in its standard number P1366, Guide for Electric Distribution Relia-bility Indices. These reliaRelia-bility indices are commonly accepted. IEEE-P1366 has defined and listed different terms that can be used to define reliability. The docu-ment contains indices which can beneficial today and in future as well [18].
The indices are divided into the following two catego-ries:
i) Reliability indices(load based) ii) Reliability indices(system based)
i)Reliability indices(load based)
The load points are selected and the indices are then calculated shows some basic concepts that can be used to find the reliability of a power system. When relia-bility is to be discussed for load points it is important to discuss indices such as rate of failure ( ), duration of outage(r) and the time that the outage occurred (U) which have also been discussed above.
Expected Energy Not Supplied Index (MWhr/year):
EENSi= Pi1:Ui1…………(1) Where:
Pi1= Average load at point i1.
Ui1= Average outage interval at point i1.
Expected Interruption Cost Index at Load Point, ECOSTn (K$/yr)
ECOSTn= Pi1∑ j Nf f ( e.g. I,g )…………(2)
Represents: S. No Unit Capaci-ty(MW)
Rate of Fail-ure (f/Yr)
Time of Repair (hr)
Time of switch-ing (hr) 1. 5 0.020 50 1
S.No Length
measured in Km
Feeders
1. 0.800 C36,C34,C28,C33,C23,C26,C
21,C22,C17,C19,C16,C11,C8
2. 0.750 C35,C30,C27.C25,C20,C7,C1
3,C5,C12,C10,C2, ,C3,C1
3. 0.600 C32,C31,C29,C24.C18,C15,C
Pi1=Average load at point i.
∑=Total or sum.
e.g = Failure rate average.
Nf= Collective faults that interrupts load at n. f( I,g)=damage factor for customer.
ii)Reliability indices(system based)
System Average Interruption Frequency Index (SAIFI)
The frequency interruption index is calculated by find-ing the average times customer faces an outage per annum. Since it is a ratio so it has no dimensions. The formula is given below
SAIFI = Ni/NT………(3)
Represents: ∑=Total or sum.
=Aggregate of customer interrupted. = Aggregate of customers benefitted.
System Average Interruption Duration Index (SAIDI)
It is used to Measure continuous interruptions faced by a system.It is measured as the total time period of in-terruption that a customer experiences. This index can be calculated on daily basis but generally it is calcu-lated on monthly, annual or for a specific time.
The value of SAIDI can be calculated by using the formula given below:
SAIDI= ………..(4)
Represents:
SAIDI = System average interruption duration index. =Sum or Total.
Ni =Customers interrupted altogether. NT = Customers served altogether.
=Time required for restoring in minutes.
IV Simulation Results and Analysis
Analysis of a local distribution system with and with-out DG is done using ETAP software.
Case 01: Reliability Analysis considering without DG
Case 02: Reliability Analysis considering DG at point A
The different cases of DG injection are discussed with their figure and analysis in the following subsection.
Case 01: Reliability Analysis considering without DG
The value of outage duration is increased as the span of load points increases from feeder so it is observed that the feeders that are close to the load experience lesser duration of outages. System becomes vulnerable to outages because of this reason. Figure 2 shows a distribution system without DG and its results are pre-sented in Table 5.
Fig 4: Reliability Analysis considering without DG Table 5: Result of analysis considering without DG
Considering without DG
S.No System Indices Results
1. SAIFI 1.9782 f/customer.yr
2. SAIDI 8.1258 hr/ customer .yr
3. EENS 119.945 MW hr/ yr
4. ECOST 477,095.70 $/yr
Case 02: Reliability Analysis considering DG at point A
duration of interruption is decreased which can be seen in Table 6.
Fig 5: Reliability Analysis considering DG at point A Table 6: Result of analysis considering DG at point A
Considering DG at Point A
S.No System Indices Results
1. SAIFI 1.4112 f/customer.yr
2. SAIDI 8.1258 hr/ customer .yr
3. EENS 96.624 MW hr/ yr
4. ECOST 399,571.50 $/yr
Table 7 shows a comparison of reliability indices of local distribution system without DG and when DG is injected at different points.
Table 7: Comparison of Analysis considering DG and without DG
It can be seen that when dispersed generation is inject-ed at point A, the system experiences minimum inter-ruption. It is also seen that the energy not supplied is also minimum when DG is at point A. However the cost also decreases when the DG is injected at point A.
V. Conclusion
The assessment of reliability has proved to be a key feature to be considered when designing distribution system such that it functions in an economical ap-proach and with decreased interruption to consumer or load. Reliability analysis of a local distribution system has been implemented with and without injecting DG. If the span of the load point were increased from the feeder, the reliability indices indicate that the interrup-tion frequency and interval were increased. When DG was injected closer to load station, positive impacts on reliability were observed.
S. N o
System Indices Without DG DG at Point A
1. SAIFI
(f/customer.yr)
1.9782 1.4112
2. SAIDI
(hr/ customer .yr)
8.1258 6.4852
3. EENS
(MW hr/ yr)
119.945 96.624
4. ECOST
($/yr)
References
[1] A. Apparao and K Bhashna. Optimal allocation of dg considering loss minimization and voltage pro-file using pso.
[2] Abdelrahman OI Adam, Mohamed Shaaban, Kha-lid M Nor, and Ahmed M Gaouda.Distributed gen-eration for distribution network voltage enhance-ment and energy loss reduction. In 2014 IEEE In-novative Smart Grid Technologies-Asia(ISGT ASIA), pages 589-593,IEEE 2014.
[3] Adefarati, T., & Bansal, R. C. (2017). Reliability assessment of distribution system with the integra-tion of renewable distributed generaintegra-tion. Applied Energy,185,158
doi:10.1016/j.apenergy.2016.10.087
[4] A Bagchi, L Goel, P Wang , An Optimal Virtual Power Plant Planning Strategy from a Composite System Cost/Worth Perspective - 2019 IEEE Milan PowerTech, 2019
[5] Anis Ur Rehman, Atiq Ur Rehman, and Sheharyar
Mehmood. Reliability assessment and cost analysis of over loaded distribution system with distributed generation. In 2016 International Conference on Computing, Electronic and Electrical Engineering (ICE Cube), pages 244{250. IEEE, 2016.
[6] An DT Le, MA Kashem, Michael Negnevitsky, and Gerard Ledwich. Control strategy of distribut-ed generation for voltage support in distribution systems. In Power Electronics, Drives and Energy Systems, 2006. PEDES'06. International Confer-ence on, pages 1{6.IEEE, 2006}
[7] Borges, C. L. T. (2012). An overview of reliability models and methods for distribution systems with renewable energy distributed generation. Renewa-ble and SustainaRenewa-ble Energy Reviews, 16(6), 4008– 4015. doi:10.1016/j.rser.2012.03.055
[8] Basudev Das, Bimal C Deka, and C Bimal. Impact of distributed generation on reliability of distribu-tion system. IOSR Journal Electrical and Electron-ics Engineering, 8(1):42{50,2013.
[9] Etap. http://www.etap.com/. Accessed: 2016-07-15.
[10] Francesc Xavier Bellart Llavall. Reliability worth assessment of radial systems with distributed gen-eration. 2011.
[11] Fudholi, A., Zohri, M., Rukman, N. S. B., Nazri, N. S., Mustapha, M., Yen, C. H., … Sopian, K. (2019). Exergy and sustainability index of photo-voltaic thermal (PVT) air collector: A theoretical
and experimental study. Renewable and Sustaina-ble Energy Reviews, 100, 44–51.
[12] Gupta, Nikita, and K. Seethalekshmi. "Review of analyzing techniques in technical challenges relat-ed to distributrelat-ed generation." International Journal of Applied Engineering 14.2 (2019).
[13] H. Lee Willis ,Distributed Power Generation Plan-ning and Evaluation
[14] Jinsong Liu, Junyang Zhang, and Da Zhang. Effect of distributed generation on power supply reliabil-ity of distribution network, 2015 8th Insternational Conference on Grid and Distribution(GDC),pages 32-35,IEEE 2015
[15] Kalesar, B. M., Rouhollahi, B., Noshahr, J. B., Tadayon, M., & Kermani, M. (2018). Multi-Objective Fuzzy Model for Optimal Siting and Siz-ing of DG Units to Reduce Losses UsSiz-ing Genetic Algorithm. 2018 IEEE International Conference on Environment and Electrical Engineering and 2018 IEEE Industrial and Commercial Power Systems Europe (EEEIC / I&CPS Europe).
[16] Ndawula, M., Djokic, S., & Hernando-Gil, I. (2019). Reliability Enhancement in Power Net-works under Uncertainty from Distributed Energy
Resources. Energies, 12(3),
531. doi:10.3390/en12030531
[17] Probability Methods Subcommittee. Ieee reliability test system. IEEE Transactions on power apparatus and systems, (6):2047{2054, 1979.