Length and Body Mass Index at Birth and Target Height Influences on
Patterns of Postnatal Growth in Children Born Small for Gestational Age
Zhong-Cheng Luo, MPH*; Kerstin Albertsson-Wikland, MD, PhD‡; and Johan Karlberg, MD, PhD*
ABSTRACT. Objective. Previous growth studies on children born small for gestational age (SGA) indicate that birth length, weight, and target height are important predictors for postnatal catch-up growth in SGA. Their influences on different phases of catch-up growth are still not described. The aim of this study was to clarify the influences of target height, length, and nutritional status at birth on different phases of postnatal catch-up growth (infancy, childhood, puberty) in SGA and the long-term consequences.
Methods. Data were obtained from a longitudinal population-based growth study on Swedish children (N 5 2815). Primary outcome measurements include heights, the changes in height standard deviation scores (SDS) during various phases of growth and relative risk for adult shortness.
Results. The difference in final height in children born SGA was attributable to their difference in target height and the magnitude of catch-up growth during the first 6 months of life, rather than the difference in length or body mass index (BMI) at birth. Length at birth showed negative influence on catch-up growth during infancy (0 to 2 years of age), but no significant influence thereafter. The BMI or weight for length SDS at birth showed no significant influence on catch-up growth dur-ing any growth phase. Target height showed positive influence on catch-up growth from the onset of child-hood. Neither target height nor length and BMI at birth showed any significant influence on catch-up growth during puberty. The magnitude of catch-up growth dur-ing infancy, especially the first 6 months of life, is most critical in decreasing risk at adult shortness. We con-firmed that the SGA group had a sevenfold greater risk for adult shortness than the non-SGA group (relative risk 5 7.31; 95% confidence interval: 3.96 –13.52). How-ever, ;40% of children who were below 22 in height SDS at 2 years of age remained short at final height in both SGA and non-SGA groups. The mean height SDS of children born SGA increased by 1.65 from birth to final height, but the length deficit in centimeters at birth (25.4 cm) persisted into adulthood (25.9 cm).
Conclusions. BMI at birth is not related to postnatal catch-up growth in infants born SGA, but birth length and target height are important. The genetic influence on catch-up growth appears to start from the onset of child-hood. Being born short or becoming short during the first 2 years of life is similar in terms of risk for adult short stature. Pediatrics 1998;102(6). URL: http://www.
pediatrics.org/cgi/content/full/102/6/e72; fetal growth re-tardation, body mass index, birth length, genetics, catch-up growth, short stature.
ABBREVIATIONS. SGA, small for gestational age; SDS, standard deviation score; WLSDS, weight for length standard deviation score; BMI, body mass index; CMS, centimeter score; RR, relative risk.
C
hildren born small for gestational age (SGA) have a sevenfold greater risk of being short in adult stature than do non-SGA children;;8% of children born SGA are still below 22 standard deviation score (SDS) in final height, which corre-sponds to 20% of the short adult population.1 The most critical period for catch-up growth is during the first 3 to 9 months of life.2–9Birth length and target height are important predictors for catch-up growth in children born SGA.2,8 It is not known, however, whether they are equally good predictors during all three growth phases from birth to maturity—in-fancy, childhood, and puberty.10It is still a matter of debate whether postnatal catch-up growth is influ-enced by nutritional status at birth, ie, weight for length SDS (WLSDS), ponderal index, or body mass index (BMI).6 Some studies report that nutritional status at birth is related to postnatal catch-up growth in infants born SGA, but others have not been able to observe such a relationship.1,3,6The results of SGA growth studies are quite dif-ferent. This may be related to a number of method-ologic issues, including that 1) the definition of SGA can be based on weight, height, or both; 2) the cut-off points for defining SGA can be 22 SDS, or the 3rd, 5th, or 10th percentile; 3) the study can be hospital-or population-based; 4) premature and postmature infants as well as unhealthy infants could have been excluded/included; and 5) for the expression of out-come measurement, the results can be expressed in SDS being age- and sex- independent or in the mea-sured centimeter unit. Furthermore, most previous studies have included a shorter period of follow-up, for a few years only and not often up to final height. The aim of this study was to describe the influ-ences of target height, length, and nutritional status at birth on different phases (infancy, childhood, pu-berty) of the longitudinal postnatal catch-up growth in children born SGA and their long-term conse-quences. The catch-up growth in height is expressed in both SDS and centimeter difference from the cor-responding reference mean values.
From the *Department of Pediatrics, University of Hong Kong, Hong Kong, People’s Republic of China, and ‡International Pediatric Growth Research Center, Department of Pediatrics, University of Goteborg, Sweden. Received for publication Mar 20, 1998; accepted Jul 9, 1998.
METHODS
The data came from a large, population-based, longitudinal growth study on 3650 healthy full-term Swedish children that spanned from birth to maturity.1 To assess the parental height
influence on growth patterns, only those children with data avail-able on parental heights were included in the analyses (N52815). All height measurements were transformed into height SDS using the reference values for the same study population.1WLSDS at
birth was computed using the current reference values for Swed-ish children.11,12The individual height SDS values also were
ex-pressed in centimeters by multiplying the SDS with the appropri-ate height SD for the particular age and sex. This height centimeter score (CMS) simply represents the difference of an individual height value from the reference mean of a particular age and sex. For instance, if the individual height SDS value was21.5 and the SD of the growth reference height value was 4.0 cm, then the height CMS would be21.534.05 26.0 cm, ie, 6 cm below the reference mean. The formula for computing height SDS and height CMS also can be expressed as: height SDS5(heightobserved2mean reference)/SDreference; height CMS5heightobserved2meanreference. The
height CMS value thus is the same as height SDS value, but without being divided by the SD of the reference values. The advantage of this height CMS expression—the distance of the individual height from the reference mean height—is that adjust-ment for height differences between ages and sexes have made.
Midparental height was calculated as the average of the moth-er’s height and fathmoth-er’s height. Target height (Y), ie, the genetic potential of final height, was computed as a linear function of midparental height (3) in centimeters (boys: Y545.9910.783; girls: Y537.8510.753). The formula was developed from the simple linear regression analysis of final height and parental heights; it has been reported elsewhere and is different from the commonly applied corrected midparental height method (midpa-rental height,66.5 cm), because the corrected midparental height method may underestimate target height for children with short parents, which is not the case with the new model.13,14The target
height values were converted into SDS and CMS based on the reference mean and SD.14Delta height SDS was computed as the
change in height SDS over a certain age interval, delta height CMS as the change in height CMS over a certain age period, and residual height SDS as height SDS minus target height SDS. The BMI was computed in the usual way, ie, weight (kg)/height2(m).
Born SGA was defined as below22 SDS at birth length adjusted for gender and length of gestation.
There was on average 14.4 height measurements available for each child. An individual growth chart was produced for each child. Children who had gained,0.5 cm during the past year and had reached age at peak height velocity at least 2 years before the last examination were considered to have reached final height.1
The final height value was treated as height at 18 years of age during analyses. Children with a height gain of 0.5 cm or more during the last year were remeasured 1 year later. Height and weight values at 0, 0.5, 2, 8, and 18 years of age were selected for analyses because they can be claimed to describe the individual phases of postnatal growth as depicted by the Infancy–Childhood-–Puberty growth model.10The fetal growth was gauged by the
length at birth, the infancy phase by growth from 0 to 2 years of age, the childhood phase by growth from 2 to 8 years of age, and the puberty phase by growth from 8 to 18 years of age. The growth during the first six months of life was analyzed separately, be-cause it was regarded as the most critical period for postnatal catch-up growth in infants born SGA.8,9Adult shortness was
de-fined as below22 SDS in final height.
The Student’sttest and Welch’s approximatettest (for unequal SD) were used to test the difference in means between two groups, or for one group with an expected mean value of zero. Analyses of variance and nonparametric Kruskal–Wallis test were used to compare the difference in the central tendency among several groups.F test andx2test were used for examining significant
trends over ordered groups. Multiple variable regression analyses were used to evaluate the influence of explanatory variables on postnatal catch-up growth during various phases. Only the two-tailed test was used, and aPvalue,0.05 was regarded as statis-tically significant. All statistics were computed using SAS soft-ware.15
RESULTS
Postnatal Catch-up Growth in Children Born SGA We report all the results for the two sexes com-bined because all of the results were similar and not statistically different (P . .05) between boys and girls. Table 1 gives the mean height and mean delta height expressed in both SDS and CMS for the total sample group (N52815); the SGA group (n5108); and the non-SGA group from birth to 0.5, 2.0, 8.0, and 18.0 years of age. The sample size varied slightly at different ages because of a few missing values. The mean target height for the SGA groups was 20.26 SDS, or 21.9 cm below the reference mean value of zero (P, .01), and was also significantly below the mean target height of non-SGA children (P , .01). The catch-up growth in children born SGA was most impressive in the first 6 months of life; the mean delta height was 1.3 SDS, corresponding to an extra gain of 2.6 cm over the reference mean value (P ,
.001). The mean final height of children born SGA was20.90 SDS, or25.9 cm below the reference mean value. The actual mean final heights for boys and girls were 174.5 cm and 161.7 cm in the SGA group and 180.7 cm and 167.9 cm in the non-SGA groups, respectively.
The mean height SDS in the SGA group increased from 22.55 at birth to 20.95 at 2 years of age and remained at this level to final height. However, based on CMS, the picture was different (Table 1, Fig 1). The mean height CMS in the SGA group was25.4 cm below the reference mean value at birth, which increased to22.9 cm at 2 years of age and fell back to
25.9 cm in final height—similar to the mean deficit in length at birth (P . .20). The mean delta height from 2 to 8 years of age is close to zero when the calculation is based on SDS (0.12; P 5.06), but sig-nificantly below zero when expressed in CMS (21.7;
P,.001). The mean delta height SDS is close to zero from 8 to 18 years of ages (20.04; P . .20), but significantly below zero when expressed in CMS (21.3;P, .001).
SGA, Catch-up Versus Non-Catch-up Groups
The mean final height for children born SGA with height above 22 SDS at 2 years of age was 20.72 SDS, or24.8 CMS, which is about 1.12 SDS, or 7.3 cm higher (P, .01) than the mean final height of chil-dren born SGA with height SDS below22 at 2 years of age (21.84 SDS, or212.1 CMS). However, there is no significant difference in the mean target height between the two groups.
Patterns of postnatal growth were different for children born SGA with length SDS above versus below22 at 2 years of age. For the SGA group with length SDS above 22 at 2 years of age, they show considerable catch-up growth during the first six months of life (mean delta height, 1.44 SDS or 2.8 CMS;P,.001). The delta height from 6 months to 2 years of age was significant based on SDS (0.29;P5
.003), but not significant based on CMS (0.20; P 5
zero from 2 to 8 (21.3;P5.002) and 8 to 18 years of age (21.4; P 5 .003). The children born SGA who were below 22 SDS at 2 years of age showed no significant catch-up growth during the first 6 months of life. From 0.5 to 2 years of ages, there was no significant change in delta height SDS (20.31; P 5
.23), but the delta height CMS was significantly be-low zero (22.5;P,.001). From 2 to 8 years of ages, there was no significant change in delta height SDS
(0.28;P5.10), but the delta height CMS was signif-icantly below zero (24.4; P , .001). From 8 to 18 years of ages, the delta height was above zero based on SDS (0.36; P 5 .04), but close to zero based on CMS (20.3;P5 .80).
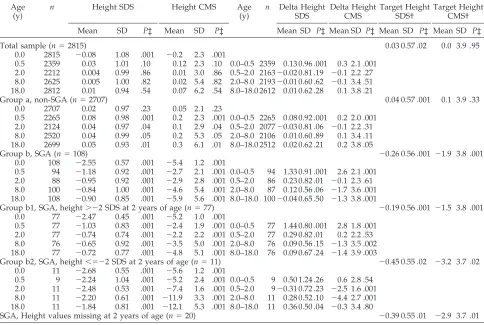
Figure 2 gives the scatterplot of final height SDS versus midparental height SDS with target height reference lines for the children born SGA. For the children born SGA with height SDS below 22 at 2 TABLE 1. Height*, Delta Height†, and Target Height* for the SGA and non-SGA Children From 0 to 18 Years of Age
Age (y)
n Height SDS Height CMS Age
(y)
n Delta Height SDS
Delta Height CMS
Target Height SDS†
Target Height CMS†
Mean SD P‡ Mean SD P‡ Mean SD P‡ Mean SD P‡ Mean SD P‡ Mean SD P‡
Total sample (n52815) 0.03 0.57 .02 0.0 3.9 .95
0.0 2815 20.08 1.08 .001 20.2 2.3 .001
0.5 2359 0.03 1.01 .10 0.12 2.3 .10 0.0–0.5 2359 0.13 0.96 .001 0.3 2.1 .001 2.0 2212 0.004 0.99 .86 0.01 3.0 .86 0.5–2.0 216320.02 0.81 .19 20.1 2.2 .27 8.0 2625 0.005 1.00 .82 0.02 5.4 .82 2.0–8.0 219320.01 0.60 .62 20.1 3.4 .51 18.0 2812 0.01 0.94 .54 0.07 6.2 .54 8.0–18.0 2612 0.01 0.62 .28 0.1 3.8 .21
Group a, non-SGA (n52707) 0.04 0.57 .001 0.1 3.9 .33
0.0 2707 0.02 0.97 .23 0.05 2.1 .23
0.5 2265 0.08 0.98 .001 0.2 2.3 .001 0.0–0.5 2265 0.08 0.92 .001 0.2 2.0 .001 2.0 2124 0.04 0.97 .04 0.1 2.9 .04 0.5–2.0 207720.03 0.81 .06 20.1 2.2 .31 8.0 2520 0.04 0.99 .05 0.2 5.3 .05 2.0–8.0 2106 0.01 0.60 .89 0.1 3.4 .11 18.0 2699 0.05 0.93 .01 0.3 6.1 .01 8.0–18.0 2512 0.02 0.62 .21 0.2 3.8 .05
Group b, SGA (n5108) 20.26 0.56 .001 21.9 3.8 .001
0.0 108 22.55 0.57 .001 25.4 1.2 .001
0.5 94 21.18 0.92 .001 22.7 2.1 .001 0.0–0.5 94 1.33 0.91 .001 2.6 2.1 .001 2.0 88 20.95 0.92 .001 22.9 2.8 .001 0.5–2.0 86 0.23 0.82 .01 20.1 2.3 .61 8.0 100 20.84 1.00 .001 24.6 5.4 .001 2.0–8.0 87 0.12 0.56 .06 21.7 3.6 .001 18.0 108 20.90 0.85 .001 25.9 5.6 .001 8.0–18.0 10020.04 0.65 .50 21.3 3.8 .001
Group b1, SGA, height.22 SDS at 2 years of age (n577) 20.19 0.56 .001 21.5 3.8 .001 0.0 77 22.47 0.45 .001 25.2 1.0 .001
0.5 77 21.03 0.83 .001 22.4 1.9 .001 0.0–0.5 77 1.44 0.80 .001 2.8 1.8 .001 2.0 77 20.74 0.74 .001 22.2 2.2 .001 0.5–2.0 77 0.29 0.82 .01 0.2 2.2 .53 8.0 76 20.65 0.92 .001 23.5 5.0 .001 2.0–8.0 76 0.09 0.56 .15 21.3 3.5 .002 18.0 77 20.72 0.77 .001 24.8 5.1 .001 8.0–18.0 76 0.09 0.67 .24 21.4 3.9 .003
Group b2, SGA, height,522 SDS at 2 years of age (n511) 20.45 0.55 .02 23.2 3.7 .02 0.0 11 22.68 0.55 .001 25.6 1.2 .001
0.5 9 22.24 1.04 .001 25.2 2.4 .001 0.0–0.5 9 0.50 1.24 .26 0.6 2.8 .54 2.0 11 22.48 0.53 .001 27.4 1.6 .001 0.5–2.0 920.31 0.72 .23 22.5 1.6 .001 8.0 11 22.20 0.61 .001 211.9 3.3 .001 2.0–8.0 11 0.28 0.52 .10 24.4 2.7 .001 18.0 11 21.84 0.81 .001 212.1 5.3 .001 8.0–18.0 11 0.36 0.50 .04 20.3 3.4 .80
SGA, Height values missing at 2 years of age (n520) 20.39 0.55 .01 22.9 3.7 .01
* The calculations were based on SDS unit and centimeter unit from the reference means (CMS).
† Test for difference in target height between groups a and b,P,.01; test for difference in target height between groups b1 and b2,P5 .15.
‡ P Values forttest with the expected mean value of zero.
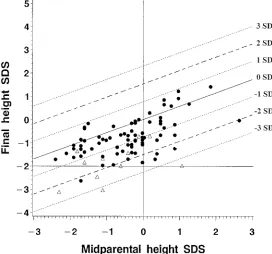
years of age (n511), 5 of 11 were below22 SDS at final height and also happened to be below22 SD of their target height. For the children born SGA with height SDS above22 at 2 years of age (n577), 3 of 77 were below 22 SDS at final height, and 8 of 77 were below 22 SDS of their target height. None of the children born SGA managed to reach a final height that was 1 SD above their target height.
Relative Risk (RR), SGA Versus Non-SGA Groups Figure 3 shows the percentage of adult shortness in relation to height SDS at 2 years of age (Fig 3, a) and target height SDS (Fig 3, b). The children born SGA who were still below22 SDS at 2 years of age had an RR of 11.7 (95% CI: 3.2– 42.21; P , .01) of adult shortness compared with the children born SGA who had reached a height above 22 SDS at 2 years of age. The percentage of adult shortness in-creased over groups with shorter target heights in both the SGA and the non-SGA groups (x2 test for trend;P , .05). Table 2 shows that the RR of adult shortness for the SGA versus non-SGA group is 7.31 (95% CI: 3.96 –13.52; P , .001). However, no in-creased risk could be observed if height SDS were below22 at 2 years of age, ie,; 40% remain short into adult stature for children who were below 22 SDS at 2 years of age in both SGA and non-SGA groups. The increased risk for adult shortness in the SGA versus the non-SGA group was more evident in groups with higher target heights.
Final Height, Catch-up Growth, Target Height, Length, and BMI at Birth
Table 3 shows the growth patterns in subgroups of children born SGA (n5108) with various ranges of final height SDS. The target height SDS, residual height SDS, BMI, and WLSDS at birth also are given for each subgroup. For the six groups with different
ranges of final height SDS, there was no difference in birth length SDS, BMI, and WLSDS at birth (Kruskal– Wallis test,P..05). For the groups with larger final height SDS, the target height SDS, the residual height SDS at birth, and the delta height SDS during the first 6 months of life were larger (Ftest for trend,P,.01). There was no significant difference in delta height SDS from 0.5 to 2.0, 2.0 to 8.0, and 8.0 to 18.0 years of age among the six groups. The SGA group with final height SDS below22 showed virtually no catch-up growth during the entire growth process. Significant catch-up growth in height SDS from 0.5 to 2 years of age was seen only in the SGA group that had a final height SDS above zero. The magnitude of catch-up growth in height SDS during puberty (8 to 18 years of age) was small in any subgroup.
Multiple variable regression was used to evaluate the influences of various factors on the magnitude of catch-up growth (delta height SDS) in different phases of growth in children born SGA. When vari-able entry level was set at 0.05, no interaction items could be detected between any two factors. BMI at birth showed no significant influence on postnatal catch-up growth during any phase of growth in any model (P. .05). If BMI was replaced by WLSDS in regression model, the results were virtually the same. We still retain BMI into the model to obtain the adjusted estimates for birth length and target height influences on catch-up growth (Table 4). Length SDS at birth showed negative influence on catch-up growth during the infancy phase (0 to 2 years of age), but no significant influence thereafter. Target height showed positive influence on catch-up growth from the onset of childhood (0.5 to 2 years of age) and was the only significant factor during childhood phase (2 to 8 years of age). The magnitude of catch-up growth during puberty phase (8 to 18 years of age) is small
(Table 3) and not affected by target height, length, and BMI at birth (P. .05).
DISCUSSION
In this study, we have described the postnatal longitudinal growth patterns and the influences of birth length, BMI at birth, and target height in chil-dren born SGA. The new understanding we gained from the study is that the target height, or genetic influence on postnatal catch-up growth, appears to start from the onset of childhood, and it seems to be the only significant factor during childhood phase of growth. The size at birth negatively influenced the postnatal catch-up growth during infancy phase but
had no significant influence thereafter, whereas BMI at birth showed no significant influence during any phase of growth. Another important message is that being born short or becoming short during the first 2 years of life is similar in terms of increased risk for adult shortness. Approximately 40% of children who were below22 SDS at 2 years of age remained short in adult stature in both the SGA and the non-SGA group. We also have described the different pictures of the postnatal catch-up growth between the height change expressed in SDS and in CMS.
It is difficult to compare our results with those from other studies because the definition of SGA might be different by birth weight and/or birth
Fig 3. The percentage of short adults (final height SDS below22) with 95% CIs for SGA and non-SGA children subgrouped by 1) height SDS at 2 years of age (#22 or. 22); 2) target height SDS (, 21,21 to 0,.0).
TABLE 2. RR of Adult Shortness for the SGA Versus non-SGA Children Subgrouped by Height SDS at 2 Years of Age and Target Height SDS
Groups SGA Non-SGA SGA vs non-SGA
Sample Size
N
Below22 SDS in Final Height
Sample Size
N
Below22 SDS in Final Height
RR 95% CI P
n % n %
Height SDS at 2 years of age (n52118)*
.22 77 3 3.90 2091 20 0.96 4.07 1.24–13.42 .05
#22 11 5 45.45 27 11 40.74 1.12 0.51–2.46 1.00
Target height SDS (n52807)*
.0 36 1 2.78 1423 2 0.14 19.76 1.83–213.15 .07
21 to 0 62 9 14.52 1175 29 2.47 5.98 2.91–11.88 .01
#21 10 2 20.00 101 10 9.90 2.02 0.51–7.97 .29
Total 108 12 11.11 2699 41 1.52 7.31 3.96–13.52 .001
length. Birth weight is commonly used because it is much more frequently taken as the standard mea-sure of fetal size at birth. We defined SGA as below
22 SDS at birth length (adjusted for gender and length of gestation), because this definition may be more accurate for examining postnatal growth in height.8Other study design differences were that our series was population-based, not hospital-based; it had a long follow-up period, from birth to maturity; and only healthy full-term infants were included. For
these reasons, we cannot make direct comparisons with the results of other studies.
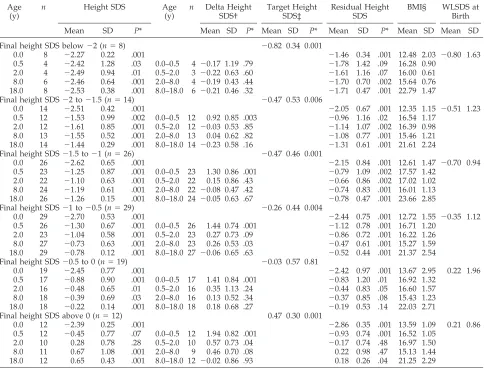
What determines the magnitude of catch-up growth in children born SGA is still not clear. It has been reported that both birth length and mid-parental height are correlated with the magnitude of catch-up growth in children born SGA.1 We used target height, a linear function of midparental height, as a measurement of genetics potential in stature.14 During the first 6 months of life, the dimension of catch-up growth was dominated by birth size: shorter children born SGA showed larger catch-up growth. From 0.5 to 2.0 years of age, the catch-up growth was influenced by both birth length and target height; it should be remem-bered that the onset of childhood also usually oc-curred during this time.10During childhood (2.0 to 8.0 years of age), the influence of birth size disap-peared, and the positive influence of target height dominated. Catch-up growth during puberty is small and seems not to be related to any fetal life experience or to the genetic influence. Approxi-mately half of the variation in dimensions of TABLE 3. Height SDS, Delta Height SDS, Target Height SDS, Residual Height SDS, BMI, and WLSDS at Birth for Children Born SGA Subgrouped by Final Height SDS
Age (y)
n Height SDS Age
(y)
n Delta Height SDS†
Target Height SDS‡
Residual Height SDS
BMI§ WLSDS at Birth
Mean SD P* Mean SD P* Mean SD P* Mean SD P* Mean SD Mean SD
Final height SDS below22 (n58) 20.82 0.34 0.001
0.0 8 22.27 0.22 .001 21.46 0.34 .001 12.48 2.03 20.80 1.63 0.5 4 22.42 1.28 .03 0.0–0.5 4 20.17 1.19 .79 21.78 1.42 .09 16.28 0.90
2.0 4 22.49 0.94 .01 0.5–2.0 3 20.22 0.63 .60 21.61 1.16 .07 16.00 0.61 8.0 6 22.46 0.64 .001 2.0–8.0 4 20.19 0.43 .44 21.70 0.70 .002 15.64 0.76 18.0 8 22.53 0.38 .001 8.0–18.0 6 20.21 0.46 .32 21.71 0.47 .001 22.79 1.47 Final height SDS22 to21.5 (n514) 20.47 0.53 0.006
0.0 14 22.51 0.42 .001 22.05 0.67 .001 12.35 1.15 20.51 1.23 0.5 12 21.53 0.99 .002 0.0–0.5 12 0.92 0.85 .003 20.96 1.16 .02 16.54 1.17
2.0 12 21.61 0.85 .001 0.5–2.0 12 20.03 0.53 .85 21.14 1.07 .002 16.39 0.98 8.0 13 21.55 0.52 .001 2.0–8.0 13 0.04 0.62 .82 21.08 0.77 .001 15.46 1.21 18.0 14 21.44 0.29 .001 8.0–18.0 14 20.23 0.58 .16 21.31 0.61 .001 21.61 2.24 Final height SDS21.5 to21 (n526) 20.47 0.46 0.001
0.0 26 22.62 0.65 .001 22.15 0.84 .001 12.61 1.47 20.70 0.94 0.5 23 21.25 0.87 .001 0.0–0.5 23 1.30 0.86 .001 20.79 1.09 .002 17.57 1.42
2.0 22 21.10 0.63 .001 0.5–2.0 22 0.15 0.86 .43 20.66 0.86 .002 17.02 1.02 8.0 24 21.19 0.61 .001 2.0–8.0 22 20.08 0.47 .42 20.74 0.83 .001 16.01 1.13 18.0 26 21.26 0.15 .001 8.0–18.0 24 20.05 0.63 .67 20.78 0.47 .001 23.66 2.85 Final height SDS21 to20.5 (n529) 20.26 0.44 0.004
0.0 29 22.70 0.53 .001 22.44 0.75 .001 12.72 1.55 20.35 1.12 0.5 26 21.30 0.67 .001 0.0–0.5 26 1.44 0.74 .001 21.12 0.78 .001 16.71 1.20
2.0 23 21.04 0.58 .001 0.5–2.0 23 0.27 0.73 .09 20.86 0.72 .001 16.22 1.26 8.0 27 20.73 0.63 .001 2.0–8.0 23 0.26 0.53 .03 20.47 0.61 .001 15.27 1.59 18.0 29 20.78 0.12 .001 8.0–18.0 27 20.06 0.65 .63 20.52 0.44 .001 21.37 2.54 Final height SDS20.5 to 0 (n519) 20.03 0.57 0.81
0.0 19 22.45 0.77 .001 22.42 0.97 .001 13.67 2.95 0.22 1.96 0.5 17 20.88 0.90 .001 0.0–0.5 17 1.41 0.84 .001 20.83 1.20 .01 16.92 1.32
2.0 16 20.48 0.65 .01 0.5–2.0 16 0.35 1.13 .24 20.44 0.83 .05 16.60 1.57 8.0 18 20.39 0.69 .03 2.0–8.0 16 0.13 0.52 .34 20.37 0.85 .08 15.43 1.23 18.0 18 20.22 0.14 .001 8.0–18.0 18 0.18 0.68 .27 20.19 0.53 .14 22.03 2.71
Final height SDS above 0 (n512) 0.47 0.30 0.001
0.0 12 22.39 0.25 .001 22.86 0.35 .001 13.59 1.09 0.21 0.86 0.5 12 20.45 0.77 .07 0.0–0.5 12 1.94 0.82 .001 20.93 0.74 .001 16.52 1.05
2.0 10 0.28 0.78 .28 0.5–2.0 10 0.57 0.73 .04 20.17 0.74 .48 16.97 1.50 8.0 11 0.67 1.08 .001 2.0–8.0 9 0.46 0.70 .08 0.22 0.98 .47 15.13 1.44 18.0 12 0.65 0.43 .001 8.0–18.0 12 20.02 0.86 .93 0.18 0.26 .04 21.25 2.29
*Pvalue:ttest with an expected mean value of zero.
†Ftest for trend over the six groups in delta height SDS from 0 to 0.5 years of age,P,.01. ‡Ftest for trend over the six groups in target height SDS,P,.01.
§ Kruskal–Wallis test for difference in BMI at each age and WLSDS at birth over the six groups,P..05.
TABLE 4. Multiple Variable Regression Analyses of Delta Height SDS Over Various Age Periods in Children Born SGA by Length SDS at Birth, BMI at Birth, and Target Height SDS
Age Intervals
Length at Birth
BMI at Birth
Target Height
Total Model
(y) b0 b1 P b2 P b3 P R2 F P
catch-up growth from birth to 18 years of age can be explained by length at birth and target height. Whether WLSDS, ponderal index, or BMI influ-ences postnatal catch-up growth in children born SGA is still a matter of debate. We could not find any significant influence of BMI or WLSDS at birth on postnatal catch-up growth, as has been reported by other investigators.6 Proportionate and dispropor-tionate (lower weight for length) infants born SGA seem to have an equal magnitude of catch-up growth. The important factor in early life is length at birth, ie, the magnitude of fetal growth retardation. Later, however, the target height (genetic) influence takes over.
In accordance with a previous report, we observed that children born SGA had an approximate seven times greater risk for adult shortness than did non-SGA children.1The risk was higher for children with shorter target heights (shorter parents). In children born SGA who showed impressive catch-up growth during the first 2 years of life, the risk for adult shortness decreased dramatically, from;40% to 4%. To our surprise,;40% of children with height SDS below 22 at 2 years of age remain short in adult stature, whether or not born SGA. Being born short or becoming short during the first 2 years of life is similar in terms of increased risk for adult shortness. The understanding here is that we do not really need to know whether a child was born short or not for adult shortness prognosis. This conveys a significant clinical message to pediatricians. However, the re-sponse to growth-promoting treatments may be dif-ferent in the two groups. It is not clear whether SGA and non-SGA short children have similar responses to the same dose of growth hormone treatment. Some studies indicates that children born SGA might need a higher dose of growth hormone to achieve a desirable growth response.16 –19
Should we use SDS or CMS to describe catch-up growth? Most growth studies used SDS.16 –19 This study shows a striking difference in results when CMS rather than SDS is used. For instance, based on SDS, the mean height in children born SGA increased by 1.65 units from birth to final height, which is an impressive catch-up. If we convert SDS into centime-ter difference from the reference mean (CMS), the length deficit at birth (25.4 cm) persists into adult-hood (25.9 cm). This difference can be explained by the increasing SD value for height by age, ie, from 2.1 cm at birth to 6.5 cm at 18 years of age. The change in height can be significant when expressed in cen-timeters using the reference mean values, but not significant in SDS and vice versa.
The study confirms that the most critical time for catch-up growth is during the first 2 years of life, especially during the first 6 months.2–9The difference in final height SDS for children born SGA is primar-ily attributable to the difference in the magnitude of catch-up growth during the first 6 months of life, rather than to the difference in birth length SDS, BMI, or WLSDS at birth. The impact of failure to catch-up during infancy in children born SGA is long-term
and difficult to be redressed by catch-up growth in later life.
In conclusion, BMI at birth is not related to postnatal catch-up growth in infants born SGA, but birth length and target height are important. The genetic influence on stature appears to begin dominating the growth from the onset of child-hood. Being born short or becoming short during the first 2 years of life is similar in terms of in-creased risk for adult shortness.
ACKNOWLEDGMENTS
This study was supported by the Faculty of Medicine of the University of Hong Kong, Hong Kong SAR, Swedish Medical Research Council (7905), and Pharmacia Upjohn Ltd (Uppsala, Sweden).
REFERENCES
1. Karlberg J, Albertsson-Wikland K. Growth in full-term small-for-gestational-age infants: from birth to final height.Pediatr Res.1995;38: 733–739
2. Fitzhardinge PM, Inwood S. Long-term growth in small-for-date chil-dren.Acta Paediatr Scand Suppl.1989;349:27–33
3. Fitzhardinge PM, Stenven EM. The small-for-date infant. I. Late growth patterns.Pediatrics.1972;49:671– 681
4. Walther FJ. Growth and development of term disproportionate small-for-gestational-age infants at the age of 7 year.Early Hum Dev.1988;18: 1–11
5. Hadders-Algra M, Touwen BCL. Body measurements, neurological and behavioral development in six-year-old children born preterm and/or small-for-gestational-age.Early Hum Dev.1990;22:1–13
6. Davies DP Growth of “small-for-dates” babies.Early Hum Dev.1981;5: 95–105
7. Villar J, Smeriglio V, Martorell R, Brown CH, Klein RE. Heterogeneous growth and mental development of intrauterine growth retarded in-fants.Pediatrics.1984;74:783–791
8. Karlberg J, Albertsson-Wikland K, Baber FM, Low LCK, Yeung CY. Born small-for-gestational-age infants: consequences for growth.Acta Paediatr Suppl.1996;417:8 –13
9. Albertsson-Wikland K, Wennergren G, Wennergren M, Vilbergsson G, Rosberg S. Longitudinal follow-up of growth in children born small for gestational age.Acta Paediatr.1993;82:438 – 443
10. Karlberg J. A biological-oriented mathematical model (ICP) for human growth.Acta Paediatr Scand Suppl.1989;350:70 –94
11. Niklasson A, Karlberg P. Weight-for-length model in newborn Swedish infants.Acta Paediatr.1993;82:333–339
12. Niklasson A, Ericson A, Fryer JG, Karlberg J, Lawrence C, Karlberg P. An update of the Swedish reference standards for weight, length, head.
Acta Paediatr Scand.1991;80:756 –762
13. Tanner JM, Goldstein H, Whitehouse RH. Standards for children’s height at ages 2–9 years allowing for height of parents.Arch Dis Child.
1970;45:755–762
14. Luo ZC, Albertsson-Wikland K, Karlberg J. Target height as predicted by parental heights in a population based study.Pediatr Res.1998;44: 563–571
15. SAS Institute Inc.SAS/STAT User’s Guide.Version 6.10. Cary, NC: SAS Institute; 1996
16. Ranke MB, Lindberg A. Growth hormone treatment of short children born small for gestational age or with Silver-Russell syndrome: results from KIGS (Kabi International Growth Study), including the first report on final height.Acta Paediatr Suppl.1996;417:18 –26
17. Zegher F, Albertsson-Wikland K, Wilton P, et al. Growth hormone treatment of short children born small for gestational age: metaanalysis of four independent, randomized, controlled, multicentre studies.Acta Paediatr Suppl.1996;471:27–31
18. Chatelain P, Job JC, Blanchard J, et al. Dose-dependent catch-up growth after 2 years of growth hormone treatment in intrauterine growth-retarded children. Belgian and French Pediatric Clinics and Sanofi-Choay (France).J Clin Endocrinol Metab. 1994;78:1454 –1460
DOI: 10.1542/peds.102.6.e72
1998;102;e72
Pediatrics
Zhong-Cheng Luo, Kerstin Albertsson-Wikland and Johan Karlberg
of Postnatal Growth in Children Born Small for Gestational Age
Length and Body Mass Index at Birth and Target Height Influences on Patterns
Services
Updated Information &
http://pediatrics.aappublications.org/content/102/6/e72 including high resolution figures, can be found at:
References
http://pediatrics.aappublications.org/content/102/6/e72#BIBL This article cites 18 articles, 3 of which you can access for free at:
Subspecialty Collections
http://www.aappublications.org/cgi/collection/epidemiology_sub
Epidemiology
sub
http://www.aappublications.org/cgi/collection/fetus:newborn_infant_
Fetus/Newborn Infant
http://www.aappublications.org/cgi/collection/endocrinology_sub
Endocrinology
milestones_sub
http://www.aappublications.org/cgi/collection/growth:development_
Growth/Development Milestones
following collection(s):
This article, along with others on similar topics, appears in the
Permissions & Licensing
http://www.aappublications.org/site/misc/Permissions.xhtml in its entirety can be found online at:
Information about reproducing this article in parts (figures, tables) or
Reprints
DOI: 10.1542/peds.102.6.e72
1998;102;e72
Pediatrics
Zhong-Cheng Luo, Kerstin Albertsson-Wikland and Johan Karlberg
of Postnatal Growth in Children Born Small for Gestational Age
Length and Body Mass Index at Birth and Target Height Influences on Patterns
http://pediatrics.aappublications.org/content/102/6/e72
located on the World Wide Web at:
The online version of this article, along with updated information and services, is
by the American Academy of Pediatrics. All rights reserved. Print ISSN: 1073-0397.