Parametric optimization of CNC Drilling
machine for mild steel using Taguchi design
and Single to Noise ratio Analysis
YOGENDRA TYAGI1, VEDANSH CHATURVEDI2 ,JYOTI VIMAL3
1, Student of Mechanical Engineering Department,MITS , Gwalior
2,3Asst.Professor,Department of Mechanical Engineering Department, MITS College, Gwalior E-mail: [email protected] om;[email protected];[email protected]
Abstract
In this paper the drilling of mild steel with the help of CNC drilling machining operation with tool use high speed steel by applying taguchi methodology has been reported. The signal-to-noise ratio applied to find optimum process parameter for CNC drilling machining .A L9 orthogonal array and analysis of variance(ANOVA) are applied to study the performance characteristics of machining parameter (spindle speed, feed, depth) with consideration of good surface finish as well as high material removal rate(MRR) .Surface finishing is one of the prime requirements of customers of machining parts .Results obtained by taguchi method and signal-to-noise ratio match closely with (ANOVA) and the feed is most effective factor for MRR. And spindle speed is the most effective factor for surface roughness. Multiple regression equation are formulated for estimating predicted value surface roughness and material removal rate
Keywords:CNC drilling machine, surface roughness, material removal rate (MRR), Taguchi method, ANOVA S/N Ratio MRR&SR
Introduction
Taguchi’s parameter design offers a systematic approach for optimization of various parameters with regard to performance quality and cost. The quality and cost is one of the prime requirements of customers for machined parts productivity is also necessary to fulfil the customers demand. For this purpose quality of a product and productivity should be high and cost should be low. Design optimization for quality was carried out and single to noise ratio and analysis of variance (ANOVA) were employed using experiment result to confirm effectiveness of this approach. The signal to noise ratio in Taguchi methodology was used to find optimal parameter for material removal rate and surface roughness in drilling operation based experimental results done on mild steel work piece and high speed steel tool. The personnel industry as well as in research and development is required maintain surface roughness and MRR. Mild steel is extensive used us a main engineering material in various industry such as air craft and aerospace industry impact of drilling parameter such as speed(1000,1500,2000) in rpm. Feed rate (0.5, 1, 1.5) mm/min depth of cut (3, 5, 7) in mm. the drilling tool diameter is constant in 10 mm. The tool angle is fixed 118º .the Taguchi optimization methodologies to optimize the drilling parameter in CNC drilling machining age hardened mild steel and tool is high speed steel .authors analysed the data using ANOVA with the help of commercial software package minitab-15.A series of experiment based on the Taguchi L9 orthogonal array is utilized for experimental planning for CNC drilling machining.
2. Experimental Processes 2.1 Work piece Material
Drilling operation will be performed on Mild steel work piece .mild steel are soft, ductile and easily machined The composition of mild conation carbon(0.05%to0.3%) and small quantities of manganese(Mn), silicon(Si), phosphorus (P) sulphur(S). A rectangular mild steel plate of size 100 mm ×76mm ×12mm in shaping machine for performing CNC drilling machine. Holy oil was used as the coolant fluid in this experiment .Young’s Modulus (210GPa), Poisson’s Ratio (0.29) Density (7.8g/cm³), Melting Point (140ºC) Modulus of elasticity (200GPa) Bulk Modulus (140GPa).
2.2 High speed steel:-
composition of high speed steel are carbon (0.6%to0.75%) tungsten (14%to20%),Chromium (3%to5%) vanadium (1%to1.5%), Cobalt (5%to10%) and remaining is iron.
2.3 Plan of experiment:-
The plan of experiment is Show in figure1.A rectangular mild steel plate of size 100 mm ×76mm ×12mm.the 100mm&76mm is divided in similarly four parts. In this plate nine holes are drilled of 10mm diameter. The experiments were conducted according to taguchi orthogonal array. Which helps in reducing the number of experiment. In this paper 3 parameter and 3 levels considered for experimental runs. Optimization for quality was carried out with signal to noise ratio and analysis of variance (ANOVA).
Figure:1 Plan of Experimental. 2.4 Machining process
Calculating mass of each plate by the high precision digital balance meter before machining operation and before machine process CNC machine part programs for particular tool path of particular commands using various levels of spindle speed, feed rate and, depth of cut. in Experiments were performed using a CNC vertical drilling machine in Figure 3 depicts schematically the experimental set-up. After that calculating mass of each work pies plate again by the digital balance meter. The MRR values were measured three times of each specimen and then, the material removal rate Values were average. The Ra values also measured three times on each specimen and the surface roughness (Ra) is measured with a mitutoyo surftest SJ-201 series 178 portable surface roughness tester instrument. Machining experiments for determining the optimal machining parameter were carried out by setting of spindle speed in the range of 1000-2000 rpm, feed in the range of 0.5-1.5mm/min, depth of cut in the range of 3-7 mm and Essential parameter of the experiment are given in table 1.
Table:-1 Drilling machining condition
Work Condition Description
Work piece Spindle Speed Feed
Depth of cut Coolant Lubricant Tool Diameter
Mild Steel, Rectangular shape(100 mm ×76mm ×12mm) 1000to 2000 rpm
Fig.2: Experimental Set up of vertical CNC Fig.3: Line diagram of experimental set up Drilling machine
Fig 4: Final Image of work piece
3. Design of Experiment and Data Analysis 3.1. Design of Experiment
Table 2: Design scheme of experiment of Parameters and levels
3.2 Methodology SIGNAL TO NOISE RATIO CALCULATION
Quality Characteristics:
S/N characteristics formulated for three different categories are as follows: Larger is Best Characteristic:
Data sequence for MRR (Material Removal Rate), which are higher-the-better performance characteristic are pre-processed as per Eq.1
S/N= -10 log ((1/n) ((1/y2))... ... ..1 Nominal and Smaller are Best Characteristics
Data sequences for SR , which are lower-the-better performance characteristic, are pre- processed as per Eq.2 &3
S/N= -10 log (y/s2y)... ... ...2 S/N= -10 log ((1/n) (∑(y2))... ... ...3
Where y^ is average of observed data y, sy2 is variance of y, and n is number of observation
3.3 Data Analysis
In this paper, analysis based on the taguchi method is done by Signal to noise ratio(MINITAB-15Software ) to determine the main effects of the process parameters, to perform the analysis of variance(ANOVA) and to establish the Signal to noise ratio optimum conditions. The main effects analysis is used to study the trend of the effects of each of the factors, as shown in figures 5&6 for MRR and figure 7&8forSR. The machining performance (ANOVA-rank factor) for each experiment of the L9 can be calculated by taking the observed values of the MRR as an example from table 6. And 7 lists the Taguchi analysis parameter for spindle speed (A) feed (B) and depth of cut(c) the response table6 for MRR use in the signal to noise ratio larger is the better and response table7 for mean effects plot for S/N ratio the spindle speed is less in level (3) compare to the other level .the feed is the high at level (1) and depth is minimum at level (2) all this case the MRR is maximum .the surface roughness is calculated by the same procedure.table8&9 for Signal to Noise Ratios Smaller is better and Means Main Effects Plot for S/N ratios.
Control parameters Level Observed Value
1 2 3
Minimum Intermediate Maximum
Spindle Speed’s(rpm) Feed Rate (mm/min.) Depth of cut (mm)
1000 0.5 03
1500 01 05
2000 1.5 07
1Materialremoval rate (g/min)
Table 3: L9 table and observed values
Table 4: S/N Ratio for MRR (Larger is Better)
TABLE 5: S/N Ratio for SR (Smaller is Better)
4Taguchi Design: MINITAB Analysis
4.1 Taguchi Analysis: response versus A, B, C
Table 6: Response for Signal to Noise Ratios (Larger is better)
No. of Trial
Control parameter(level) Result/Observed value Spindle Speed (rpm) Feed rate (mm/min) Depth of Cut(mm) MRR (g/min) SR (Ra)
1 2 3 1 2 3 1 2 3 4 5 6 7 8 9 1000(1) 1000(1) 1000(1) 1500(2) 1500(2) 1500(2) 2000(3) 2000(3) 2000(3) 0.5(1) 01(2) 1.5(3) 0.5(1) 01(2) 1.5(3) 0.5(1) 01(2) 1.5(3) 0.5(1) 01(2) 1.5(3) 01(2) 1.5(3) 0.5(1) 1.5(3) 0.5(1) 01(2) 1.37 1.36 1.40 1.43 1.39 1.40 1.49 1.44 1.33 1.50 1.33 1.44 1.49 1.39 1.41 1.44 1.43 1.33 1.44 1.41 1.39 1.44 1.42 1.40 1.45 1.44 1.36 3.26 3.22 3.31 3.61 2.97 3.12 3.96 3.93 3.33 3.22 3.28 3.27 3.41 2.93 3.21 3.99 3.91 3.20 3.27 3.21 3.22 3.42 2.99 3.22 3.92 3.85 2.20 No. of Trial
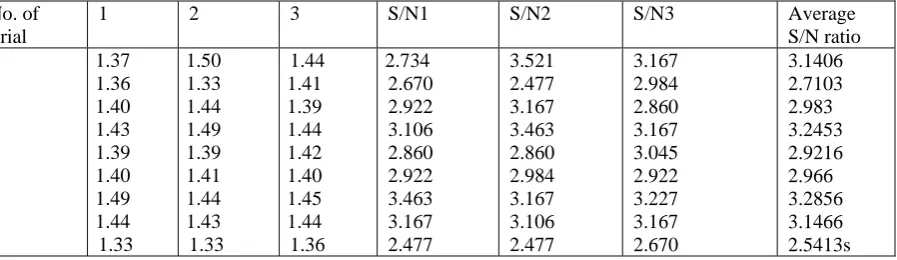
1 2 3 S/N1 S/N2 S/N3 Average
S/N ratio 1 2 3 4 5 6 7 8 9 1.37 1.36 1.40 1.43 1.39 1.40 1.49 1.44 1.33 1.50 1.33 1.44 1.49 1.39 1.41 1.44 1.43 1.33 1.44 1.41 1.39 1.44 1.42 1.40 1.45 1.44 1.36 2.734 2.670 2.922 3.106 2.860 2.922 3.463 3.167 2.477 3.521 2.477 3.167 3.463 2.860 2.984 3.167 3.106 2.477 3.167 2.984 2.860 3.167 3.045 2.922 3.227 3.167 2.670 3.1406 2.7103 2.983 3.2453 2.9216 2.966 3.2856 3.1466 2.5413s No. of Trial
1 2 3 S/N1 S/N2 S/N3 Average S/N
ratio 1 2 3 4 5 6 7 8 9 3.26 3.22 3.31 3.61 2.97 3.12 3.96 3.93 3.33 3.22 3.28 3.27 3.41 2.93 3.21 3.99 3.91 3.20 3.27 3.21 3.22 3.42 2.99 3.22 3.92 3.85 2.20 -10.264 -10.157 -10.396 -11.150 -9.455 -9.883 -11.953 -11.887 -10.448 -10.157 -10.317 -10.290 -10.655 -9.337 -10.130 -12.019 -11.843 -10.102 -10.290 -10.130 -10.157 -10.680 -9.513 -10.157 -11.865 -11.709 -6.848 -10.237 -10.2013 -10.281 -10.2883 -9.435 -10.0566 -11.9456 -11.813 -9.1326
LEVEL A B C
1 2.945 3.129 3.076
2 3.030 2.925 2.761
3 2.925 2.757 3.065
Delta 0.105 0.462 0.315
Table 7: Response for Means Main Effects Plot for SN ratios
Main Effects Plot for S/N ratios
Figure 5 the main effects plot for s/n ratio Main Effects Plot for Means
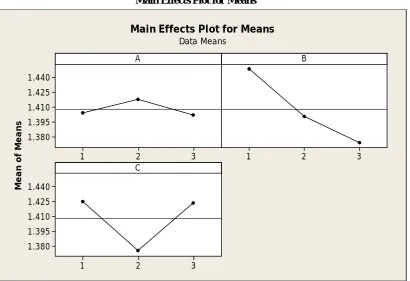
Figure: 6 main effect plots for mean
LEVEL A B C
1 1.404 1.449 1.425
2 1.418 1.401 1.375
3 1.402 1.374 1.423
Delta 0.016 0.074 0.050
Rank 3 1 2
3 2
1 3.2
3.1 3.0 2.9 2.8
3 2
1
3 2
1 3.2
3.1 3.0 2.9 2.8
A
Me
a
n
o
f S
N
ra
ti
o
s
B
C
Main Effects Plot for SN ratios
Data Means
Signal-to-noise: Larger is better
3 2
1 1.440
1.425 1.410 1.395 1.380
3 2
1
3 2
1 1.440
1.425 1.410 1.395 1.380
A
M
e
an
o
f M
e
an
s
B
C
4.2 Taguchi Analysis: response versus A, B, C
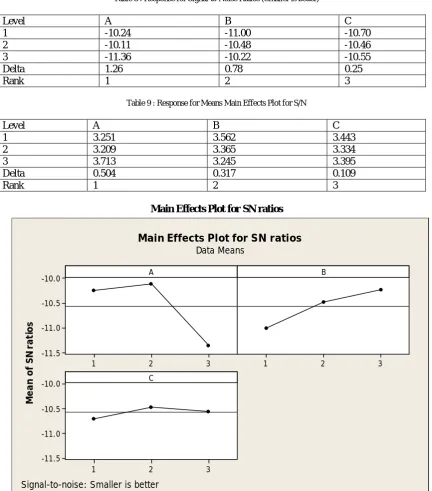
Table 8 : Response for Signal to Noise Ratios (Smaller is better)
Level A B C
1 -10.24 -11.00 -10.70 2 -10.11 -10.48 -10.46 3 -11.36 -10.22 -10.55
Delta 1.26 0.78 0.25
Rank 1 2 3
Table 9 : Response for Means Main Effects Plot for S/N
Level A B C
1 3.251 3.562 3.443
2 3.209 3.365 3.334
3 3.713 3.245 3.395
Delta 0.504 0.317 0.109
Rank 1 2 3
Main Effects Plot for SN ratios
Figure 7:-Main effects plot for SN ratios 3
2 1
-10.0
-10.5
-11.0
-11.5
3 2
1
3 2
1 -10.0
-10.5
-11.0
-11.5
A
M
e
a
n
of
S
N
r
a
ti
os
B
C
Main Effects Plot for SN ratios
Data Means
Main Effects Plot for Means
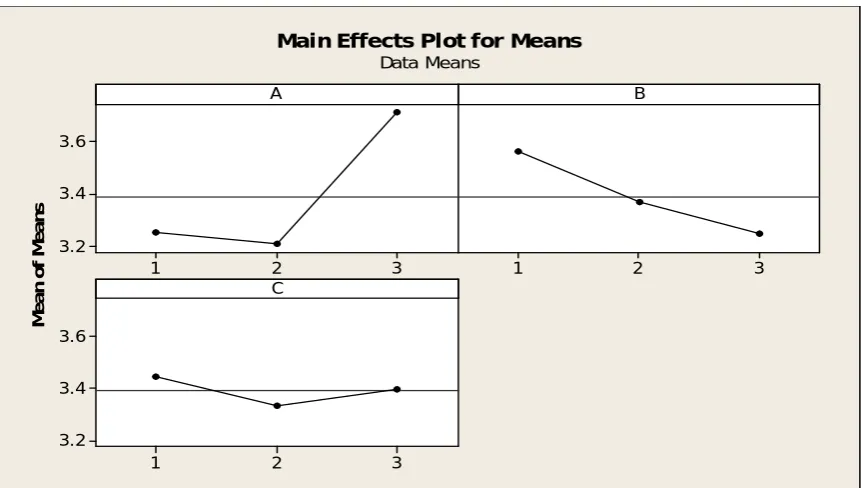
Figure 8:-Main effects plot for Means
5. Results and Discussion
5.1 Material Removable Rate
In case of MRR the most significant parameter is feed which is having rank 1 in table 6&7 and with the analysis of S/N Ratio graphs 5&6 the predicted optimal parameter setting for maximum MRR at spindle speed (A2, 1500), feed (B1,0.5) and depth of cut (C1, 3). According to this procedure’ optimal parameter sets confirmation test is done and found MRR is (1.52g/min). Which shows the successful implementation of taguchi methodology in CNC drilling machine.
5.2. Surface Roughness
In case of SR the most significant parameter is spindle speed which is having rank 1 in table 8&9 and with the analysis of S/N Ratio graphs 7&8 the predicted optimal parameter setting for minimum SR at spindle speed (A2, 1500), feed (B3,1.5) and depth of cut (C2,5). According to this procedure’ optimal parameter sets confirmation test is done and found SR is (2.05Ra). Which shows the successful implementation of taguchi methodology in CNC drilling machine.
Conclusion
This paper has discussed the feasibility of machining Mild Steel by CNC drilling machine with a HSS Tool. The signal to noise ratio has been used to determine the main effects significant factors and optimum machining condition to the performance of drilling hole in mild steel based on the results presented here in, We can conclude that, the Spindle Speed of drilling machine Tool mainly affects the SR. The Feed Rate largely affects the MRR.
Acknowledgement
We thanks to Director (MITS,Gwalior) for give the permission for Research work at IGTR indore.We also thanks to Er. Sourab dubey (Indo-German tool room,indore) for supporting during the experimental work.
References
[1] V Krishna Raj, S Vijyanarayan, G Suresh (2005) High Speed drilling of GFRP.IJMES 12,189-195
[2] Chua MS, Rahman M, Wong YS, HT.” Determination of optimal cutting conditions using design of experiments and optimization techniques”, In T J Mach Tools Manuf 1993; 33(2): 297–305.
[3] Yang, J.L., Chen, J.C. (2001). A systematic approach for identifying optimum surface roughness performance in end-milling operations. Journal of Industrial Technology, vol. 17, no. 2, p. 1-8.
3 2
1 3.6
3.4
3.2
3 2
1
3 2
1 3.6
3.4
3.2
A
Me
a
n
o
f
Me
a
n
s
B
C
[4] Mustafa Kurt, Eyup Baggie, Yusuf Kaynak (2009), Application of taguchi methods in the optimization of cutting parameters for surface finish and hole diameter accuracy in dry drilling process., Int J Adv Manuf Technol, 40, 458-469.
[5] Zhang, J.Z., Chen, J.C., Kirby, E.D. (2007). Surface roughness optimization in an end milling operation using the Taguchi design method. Journal of Materials Processing Technology, vol. 184, no. 1-3, p. 233-239, DOI:10.1016/j.jmatprotec.2006.11.029
[6] Mohammed T. H. (2001).Hole quality in deep Hole Drilling. Materials and Manufacturing ProcessesVol.16, no. 2 P.147-164, DOI: 10.1081/AMP- 100104297
[7] Mustafa Kurt, Eyup Bagei, Yusuf Kaynak (2009),Application of taguchi methods in the optimizationof cutting parameters for surface finish and holediameter accuracy in dry drilling process., Int JAdv Manuf Technol, 40, 458-469
[8] [8] Taguchi, G, Elsayed, E.A. Hsiang, T.(1989). Quality engineering in production systems. McGraw-Hill, New York
[9] Unal,R; Dean, E.B. (1991).Taguchi approach to Design optimization for Quality and cost. An Overview proceedings of the international Society of parametric analyst 13th Annual,P.21-24
[10] Julie Z. Zhang, Joseph C. CHENB, E. Daniel Kirby, ” Surface roughness optimization in an end-milling operation using the Taguchi design method.” Department of Industrial Technology, University of Northern Iowa, Iowa, USA (2008). Journal of Materials Processing Technology 184 (2007) 233–239 [1]. M. NALBANT, H. GOKKAYA, G. Sur, ”
[11] Ross PJ, Taguchi techniques for quality engineering, (McGraw-Hill International Editions, Singapore, 1996)