Cylinder Imbalance Detection of Six
Cylinder DI Diesel Engine Using Pressure
Variation
S.H.GAWANDE1, L.G. NAVALE1, M.R. NANDGAONKAR2, D.S. BUTALA3
,
S. KUNAMALLA31
Dept. of Mech. Engg. Modern Education Society’s College of Engineering Pune-411001, Email – shgawande@gmail.com, lgnavale2006@yahoo.co.in
2
Dept. of Mech. Engg. College of engineering, Pune-411005, Email – mrn@mech.coep.org.in
3
R & D Dept. Greaves Cotton Limited Pune-411019, Email – dsb@greavesmail.com, shk@greavesmail.com
Abstract
In this research paper a simplified methodology is presented to detect cylinder imbalance in operating six-cylinder DI diesel engine. The detailed torsional vibration analysis helps to find vibratory frequencies, mode shapes, and vibratory stresses to provide constraints on critical speed in operating engine. The crank shaft is considered to be a rigid body so that the variation of the angular speed could be directly correlated to the cylinder pressure. Actually the variation of crank shaft speed has a complex function being influence by torsional stiffness of crank shaft, the mass moment of inertia of reciprocating and rotating masses and the average speed and load on the engine. The information carried by the harmonic order permits to established correlation between measurement and average gas pressure of the engine and to detect torque imbalance and identify faulty cylinder. In this work the detail pressure variation study is carried out on operating six cylinder engine of type SL90 Engine-SL8800TA model manufactured by Kirloskar Oil Engine Pune.
Keyword :Diesel engine, Harmonic orders, Natural frequency, Imbalance
I. Introduction
It has been long known that one of the best ways to monitor the health of an Internal Combustion Engine is to analyze the combustion pressure cycle curves of the individual cylinders [10]. The combustion pressure curve gives information on all phases of the combustion cycle. The cycle by cycle and cylinder-by-cylinder pressure wave-form knowledge is a very important information that could have several applications both for engine control and diagnosis. Many researchers have been developed methodologies for the estimation of torques acting on the shaft in order to enhance a new class engine control systems aimed at the optimal management of the engine torque. There are a number of probes designed to allow access to cylinder combustion pressure cycle data. They are however subject to fouling by the byproducts of the combustion process. This fouling leads to calibration errors and the attendant additional maintenance requirements, which may be unacceptable for systems that cannot tolerate significant downtime or operational costs. The effects of poor combustion in one cylinder will cause a change in the angular velocity curve at the point where the affected cylinder has compression rise (near cylinder firing) and in the crankshaft oscillations related to that firing strength. Since many faults can be shown to have a unique effect on the combustion pressure curve and each unique combustion pressure curve will have an effect on the speed of the crankshaft [11].
Different methods are devised to detect misfire in cylinder of operating engine as in [8, 9] are by analyzing the variation of the measured crankshaft’s speed [8], misfire detection using analysis of instantaneous engine exhaust gas pressure, by measurement and analysis of the ionization signal in the combustion chamber, by measurement and analysis of torque, by analysis of combustion chamber pressure, optical method and by combination of these methods. A good overview of the current state of the art was presented in [9]. It is commonly in application in currently manufactured motor vehicles equipped with OBD II system.
calculations are in close agreement with the measurement. All these methods involve a large amount of calculation to detect and identify faulty cylinders. In [6, 7] a simplified approach for detecting power imbalance is suggested by using harmonic torque analysis with effect of engine harmonic orders.
A pertinent correlation between the angular motion of the crankshaft and the gas-pressure torque of each cylinder may be developed using the lumped-mass torsional dynamic model of the crankshaft [1]. This model has been extensively used with very good results to predict and control torsional vibrations [6].
Techniques proposed in [10] for detecting misfire require a pressure sensor mounted directly in the combustion chamber. This necessitates maintenance and design considerations that may be unacceptable especially on legacy systems. The art describes a non-invasive technique developed for monitoring combustion pressure cycle related faults.
In this work a simple but advanced method of detecting misfire for working medium-speed diesel engine [SL90-SL8800TA] is proposed. A method proposed in [6,7] is used for identification of the cylinder that contributes less to the current torsional vibration level of the crankshaft by using combustion pressure variation in operating medium-speed diesel engine of Kirloskar oil Engine Ltd Pune-03.
2 . Problem Formulation
The problem studying in this work is to detect cylinder imbalance in operating medium-speed six cylinder diesel engine by using combustion pressure variation and correlating this combustion pressure variation with engine harmonic torque and speed by harmonic order.
3. Crankshaft Dynamics & Harmonic Order
An internal combustion reciprocating engine produces its instantaneous torques, and the resultant mean output torque, as a result of the instantaneous gas pressures acting on each piston throughout the cycle. The actual gas pressures will depend on a number of factors such as whether the engine inhales its charge at atmospheric pressure or at a higher value due to its being pressure-charged, the actual compression ratio used, and the injection advance used at a particular speed and load for a diesel engine. For a given set of engine conditions a diagram can be obtained giving the variation of the gas pressure within the cylinder against crank angle throughout the whole cycle. This is repeated every 360 crank degrees for a two cycle engine, or 720º (two revolutions) in the case of a four-cycle engine. Since the direction in which the load due to the gas pressure within the cylinder acts on the crank arm varies as the crankshaft rotates, the gas load at any angle must be multiplied by the effective crank radius at that angle. The instantaneous gas torque at any crank angle can be calculated by Eq.1 by considering the in-cylinder pressure (p), piston area (A), piston velocity (V) at angle (θ),
Figure 1. Typical diesel engines single-cylinder instantaneous tangential pressure (torque) curve & its harmonics components
Figure 1 shows tangential pressure curve for four strokes DI diesel engine. Such a periodically repeating curve may be harmonically analyzed by Fourier’s analysis and represented by a constant and a series of harmonically (sinusoidal) varying curves of different amplitudes and phase occurring once, twice, three times, etc. in one complete engine cycle. This is shown for the first three components of the cycle. Since it is convenient to relate these harmonics to the engine speed it is usual to refer to the number of complete harmonic cycles occurring one crank revolution and to refer to them as the order numbers of the harmonics. For the four cycle diagram shown the 1 ,2, 3, 4, etc. harmonic cycles occur during two crankshaft revolutions, so that when referred to a crankshaft revolution these become respectively the ½, 1, 1½, 2, etc. harmonic orders. In the case of two-cycle engines the order numbers and the harmonics of the cycle are always integers of the same value, as one, engine cycle occurs every crank revolution. It will be noticed that the values of harmonic gas torque components increase with load. There are indications that variations occur with changes in compression ratio and injection advance, as well as with the load.
4. The Harmonic Structure of the Engine Torque & Speed
The torque produced by a cylinder has two components, the gas pressure torque (GPT) and the reciprocating inertia torque (RIT). The GPT depends, almost exclusively, on the engine load and could vary from cylinder to cylinder even under steady-state operating conditions. The RIT depends only on engine speed and is fairly uniform for all cylinders of a multicylinder engine. Under steady-state operating conditions, the total torque (Ti)
corresponding to a given cylinder i, may be considered a periodic function of time (crank angle) and expressed as a
Fourier series. The Eq.2 expresses the total GPT of a four stroke DI Diesel engine:
In this expression, represents the mean value of the GPT, and are the cosine and sine terms of the order
k = j/2 ofthe harmonic components of the total cylinder torque, θ is the crank angle, and K the highest number of
(3)
and the corresponding angular speed variation will be
(4)
Where, is the mass moment of inertia of the rotating shafts plus the corresponding mass moment of inertia of the reciprocating masses. Eq. (4) shows that the kth order harmonic component of the crankshaft’s speed lags the
corresponding harmonic term of the engine torque by π/2. This equation may be used to correlate the amplitudes and phases of the lower harmonic components of the resultant torque and of the of measured crankshaft speed.
5. Engine Model
Figure 2 illustrates a complete mass-elastic model of a four stroke six cylinder inline diesel engine system. There is a
flywheel on the engine shaft to even the rotational speed of the engine shaft. The rectangles in Fig.2 represent masses with link rotating in relation to the shafts. For example, the mass of the piston/crank mechanism of each cylinder is illustrated
by rectangles. Damping’s are represented by the box/plate symbol and stiffness of shafts is represented by spring symbol.
In Fig. 2 J1,… J7 are the inertia of the each cylinder & pulley, k1,… k8 are the stiffness and c1,…c6 are the viscous
damping’s respectively.
Figure 2. mass-elastic model of a four stroke six cylinder inline diesel engine.
6. Result And Discussion
In this section torsional vibration analysis as per [6,12] for given operating Kirloskar six cylinder diesel engine is carried out in details. Data required for analysis is collected from the company from available experimental set up. The following Information pertains to the four strokes, six cylinder diesel engine.
TABLE 1
Engine Basic Data
Engine Type Inline,Four stroke, DI
No. of Cylinder 6
Direction of rotation Anticlockwise Firing Order 1-5-3-6-2-4 Power output @ 1500rpm 309 H.P Cylinder Pressure 165 bar Cylinder Diameter 118 mm
Piston Stroke 135 mm
Compression Ratio 15.5
The frequency and amplitude analysis is carried out by computerized Holzer method for natural frequencies (120.2183Hz 249.2183Hz, and 1183.33Hz). Normal modes shapes are shown in Figure 3.
Figure 3. Normal mode shape curves
A phase vector diagram as shown in Figure 4 is drawn for the given engine to analyze the minor and major critical harmonic orders in torsional vibration analysis. It is seen that the sixth orders are the major critical orders of excitation. The corresponding critical speeds of engine operation are;
= 1148/6 = 191.330 rpm
= 2379/6 = 396.500 rpm
=11300/6=1883.33 rpm
Since the sixth order excitation of 3-node vibration mode falls within the operating range of 750 to 2200 rpm, hence the forced vibration analysis is required for this excitation frequency only.
Figure 4. Phase vector diagram
7. Experimental Investigation
Extensive experiments were conducted on a four-stroke six cylinder direct injection diesel engine (Kirloskar SL90-SL8800TA). The engine was operated at constant speed and different loads.. To simulate a misfire cylinder, the nut connecting the high-pressure fuel line to the corresponding element of the injection pump was completely unscrewed and cut off was introduced in the fuel supply of the cylinder. By varying the tightness of the high-pressure fuel line, it was possible to reduce gradually the amount of fuel injected into the cylinder from the rated value to zero, to simulate a wide range of malfunctions up to a complete misfire. The pressures were measured in all cylinders by flush mounted piezoelectric pressure transducers. The mean indicated pressure (MIP) and the gas pressure torque (GPT) of each cylinder were calculated from the pressure traces. The GPT and the measured speed were subjected to a Discrete Fourier Transform (DFT) to determine the amplitudes and phases of their harmonic components stated as above.
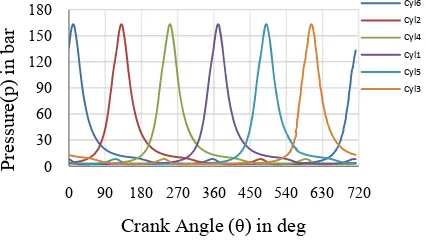
The results of the application of this technique to given DI diesel engine are graphically shown in Figure 5 & 6. Figure 5 shows an actual pressure curve generated by the sensor on all six cylinders when engine was working under normal condition.
‐2
‐1 0 1
0 1 2 3 4 5 6 7 8
Am
plitude
Mass no.
Figure 5. Actual Cylinder Pressure Curve (Engine in Normal Operating Condition)
7.1. Method for Detecting Misfire in Working Engine
It is observed that when the cylinders are uniformly contributing to the total engine torque, the first three harmonic orders (K=½, 1, 1½) play an insignificant role in the frequency spectrum of the total gas-pressure torque and, consequently, appear with a very low contribution in the frequency spectrum of the crankshaft’s speed. If the frequency spectrum of the crankshaft’s speed corresponding to uniform cylinders operation is compared to the spectrum corresponding to a misfired cylinder, one may see that the major difference is produced by the amplitudes of the first three harmonic orders [6]. As far as the cylinders operate uniformly, these amplitudes are maintained under a certain limit. Once a cylinder starts to reduce its contribution, the amplitudes of the first three harmonic orders start increasing. These amplitudes may be used to determine the degree by which a cylinder reduces its contribution to the total gas pressure torque. The identification of the faulty cylinder may be achieved by analyzing the phases of the lowest three harmonic orders.
Figure 6(a) is drawn by reconstructing the pressure traces of the six cylinders in a sequence corresponding to the firing order (1-5-3-6-2-4) with cylinder 5 is disconnected. Figure 6( b, c, d) shows the lowest three harmonic orders of the measured speed, respecting the measured amplitudes and phases. It is seen that, only for the expansion stroke of cylinder 5 all three harmonic curves have, simultaneously, a negative slope. In the phase angle diagrams as in Figure 7 of these orders, the vector corresponding to the harmonic component of the measured speed is also represented. One may see that, for each of the three considered orders, the vectors are pointing toward the group of cylinders that produce less work. The cylinder that is identified three times among the less productive cylinders is the misfired one.
0 30 60 90 120 150 180
0 90 180 270 360 450 540 630 720
Pressure(p)
in
bar
Crank Angle (θ) in deg
Figure 6. ( a) Actual Cylinder Pressure Curve (Cylinder 5 cut-off (b) ½ order (c) 1 order (c)1½ order
Based on this observation, the following method may be developed.
1. The phase-angle diagrams as shown in Fig.7, considering the firing order of the engine, are drawn for the lowest three
harmonic orders placing in the top dead center (TDC) the cylinder that fires at 0ºin the considered cycle.
2. On these phase angle diagrams, the corresponding vectors of the measured speed are represented in a system of co-ordinate axes.
3. The cylinders toward which the vectors are pointing are the less contributors and receive a ‘‘-’’ mark. If there are cylinders that receive a ‘‘-’’ mark for all three harmonic orders, they are clearly identified as less contributors to the engine total output. This procedure is presented in Table 2 for the case shown in Figure 7.
Table 2
Identification of the misfired cylinder from the position, in the phase-angle diagrams
K 1 5 3 6 2 4 Cylinders
½ - -
1 - -
1½ - - -
I 0 -1 0 0 0 0
8. Conclusions
The torsional natural frequencies of a four stroke six cylinder diesel engines are determined by computerized holzer method and they are found in good agreement. However, it is a known factor that knowing the natural frequencies and having the mode shapes of the engine the limitations in use of the engine operating speeds can be fixed as found to be 1885 rpm, so as to avoid occurrence of resonance and so the unwanted damage of the crankshaft and engine parts. Proposed methodology state the way of detecting misfire in the operating diesel engine using pressure variation . Here detailed model of six cylinders DI Diesel engine is developed appropriately. The DFT of the measured crankshaft’s speed, under steady state operation conditions at constant load shows significant variation of the amplitude of the lowest major harmonic order. This is valid both for uniform operating and misfired condition and the lowest major harmonic order may be used to correlate its amplitude to the gas pressure torque for a given engine speed. The amplitudes of the lowest harmonic orders (½, 1, and 1½) of the measured speed may be used to map the misfire. A method capable to detect misfired cylinder of Kirloskar diesel engine is developed, based on the phases of the lowest three harmonic orders of the measured speed.
9. Acknowledgements
Authors would like to thank Mr. G. S. Supekar, Sr. General Manager (R&E), and Mr. Shrikrishna Pathak, Asst Manager, of Kirloskar Oil Engines (Corporate R&E ) Pune-03 for providing necessary experimental inputs. Again the authors would like to thank college authority for providing necessary facilities. Authors thanks BCUD Department of University of Pune for providing necessary financial assistance.
References
[1] G. Genta, Vibration Dynamics and Control, Italy,Springer, 1st ed., pp 745-787,2009.
[2] B. Challen, R. Baranescu, Diesel Engine Reference Book, 2nd edition, SAE International, ch.10, 1999.
[3] U. Kiencke, L. Nielson, Automotive Control Systems, forengine, driveline and vehicle, 2nd edition, Springer
ch.5,6, 2005.
[4] P. Kundur, Power systems stability and control, New York McGraw-Hill, pp727-799, 1994. [5] R. Isermann, Mechatronic systems, Springer London, ch.4 , 2005.
[6] S.H.Gawande, L.G. Navale, M.R. Nandgaonkar, D.S.Butala, Harmonic Frequency Analysis of Multi-Cylinder Inline Diesel Engine Genset for Detecting Imbalance, International Review of Mechanical Engineering (I.RE.M.E.), Vol. 3, N. 6, pp. 782-787, November 2009.
[7] S.H.Gawande, L.G. Navale, M.R. Nandgaonkar, Dinesh Butala, Detecting Power Imbalance in Multi-Cylinder Inline Diesel Engine Generator set, IEEE Xplore 2010 /Selected for Journal of Electronic Science and Technology, China. Vol. 8, No. 2, 2010.
[8] U. Kiencke, Engine misfire detection, Control Engineering Practice 7, pp.203-208, 1999.
[9] Jerzy Merkisz, Piotr Bogus, Rafal Grzeszczyk, Overview of Engine Misfire Detection Methods Used in on Board Diagnostics, Journal of Kones. Combustion Engines, Vol.8, No 1-2, , pp. 326-341, 2001.
[10]Brian J. Murphy, Thomas Galie, Carl Byington, Diagnostic Fault Detection for Internal Combustion Engines via Pressure Curve Reconstruction, Proc. of Aerospace Conference, Pennsylvania State University, pp. 3239-3246, Oct.2003
[12]E. J. Nestrides, A Handbook on Torsional Vibration, B.I.C.E.R.A, Research Library, Cambridge University
Press, ch. 1,2, 1958. Authors Information :
S. H. Gawande was born on 04 July 1979 in small village Deori Tq. Akot, Dist. Akola in Maharashtra state. He completed
bachelor degree in Mechanical Engg. from Amravati University, Amravati, & masters degree in Mechanical Engg. with design engineering as specialization in 2002 from University of Pune. Now he is working as Senior lecturer in mechanical engineering at M.E.S. College of Engineering Pune-411001, India from 2004. Now he is working towards his PhD degree in Mechanical Engg. in University of Pune. His area of research is Internal combustion Engines, Design Engineering, Tribology. He is Permanent member of Indian societies like ISTE from 2005, SAE from 2008 and IACSIT Singapore from 2009
Dr. L.G. Navale wasborn on 26th May 1948 in Ahmednagar District in Maharashtra state, India. Now he is working as
Principal at M.E.S. College of Engineering Pune-411101 from 2006. Earlier he was associated with Government College of Engg. Pune as Professor & Head of Production Engg. Dept. & W/S. He completed bachelor degree in Mechanical Engg. from University of Pune in 1970 & masters degree in Mechanical Engg. with design engineering as specialization in 1974 from University of Pune and PhD in 2004 from University of Pune. He has total 40 years of teaching and industrial experience. He published more than 40 research papers in International & National peer reviewed journals & conferences. He is Permanent member of various Indian societies like ISTE, IE, IIPE, IIM, MORSI, AMM. His area of research is production Engg., Internal combustion Engines, Operation Research.
Dr. M. R. Nandgaonkar was born in Amravati District, in Maharashtra state, India. He completed bachelor degree in Mechanical Engg. in 1990 & masters degree in Mechanical Engg. with Heat power engineering as specialization in 1995 from Amravati University & PhD In Mechanical Engg. from Amravati University in 2002 . Now he is working as Assistant professor in mechanical engineering at Government College of Engineering Pune-411005. He has total 19 year teaching and industrial experience. He is Permanent member of various Indian societies like ISTE, IE. His area of research is Heat Power Engg., CFD, Internal combustion Engines.
D. S. Butala was born on 20 October1964 in Ratnagiri District in Maharashtra state, India. He completed bachelor degree in
Matallurgical Engg. from University of Pune in 1989. Now he is working as Senior Manager (R & D) at M/s Greaves Cotton Ltd (DEU) Pune-411019. he is actively working on different Research and Development, Testing & Design project at Greaves Cotton Ltd Pune-411019. He has vast experience in diesel engine development and testing. He has very good expertise in fatigue & vibration testing and very good knowledge about CAE analysis. His area of research is Engg. Materials, Vehicle Dynamics, Power Train Engg. Diesel Engine.
S. Kunamalla was born on 12th August 1975 in Karimnagar District, Andra Pradesh state, India. He completed bachelor degree