Atmos. Meas. Tech., 12, 3435–3452, 2019 https://doi.org/10.5194/amt-12-3435-2019 © Author(s) 2019. This work is distributed under the Creative Commons Attribution 4.0 License.
Automatic pollen recognition with the Rapid-E particle counter:
the first-level procedure, experience and next steps
Ingrida Šaulien˙e1, Laura Šukien˙e1, Gintautas Daunys1, Gediminas Valiulis1, Lukas Vaitkeviˇcius1, Predrag Matavulj2, Sanja Brdar2, Marko Panic2, Branko Sikoparija2, Bernard Clot3, Benoît Crouzy3, and Mikhail Sofiev1,4
1Institute of Regional Development, Šiauliai University, Šiauliai, 76352 Lithuania
2BioSense Institute – Research Institute for Information Technologies in Biosystems, University of Novi Sad, Novi Sad, 21000, Serbia
3Federal Office of Meteorology and Climatology MeteoSwiss, Payerne, 1530, Switzerland 4Finnish Meteorological Institute, Helsinki, 00560, Finland
Correspondence:Ingrida Šaulien˙e ([email protected]) Received: 10 December 2018 – Discussion started: 21 January 2019
Revised: 15 April 2019 – Accepted: 30 May 2019 – Published: 28 June 2019
Abstract. Pollen-induced allergies are among the most prevalent non-contagious diseases, with about a quarter of the European population being sensitive to various atmo-spheric bioaerosols. In most European countries, pollen in-formation is based on a weekly-cycle Hirst-type pollen trap method. This method is labour-intensive and requires nar-row specialized abilities and substantial time, so that the pollen data are always delayed and subject to sampling- and counting-related uncertainties. Emerging new approaches to automatic pollen monitoring can, in principle, allow for real-time availability of the data with no human involvement.
The goal of the current paper is to evaluate the capabil-ities of the new Plair Rapid-E pollen monitor and to con-struct a first-level pollen recognition algorithm. The eval-uation was performed for three devices located in Lithua-nia, Serbia and Switzerland, with independent calibration data and classification algorithms. The Rapid-E output data include multi-angle scattering images and the fluorescence spectra recorded at several times for each particle reach-ing the device. Both modalities of the Rapid-E output were treated with artificial neural networks (ANNs) and the re-sults were combined to obtain the pollen type. For the first classification experiment, the monitor was challenged with a large variety of pollen types and the quality of many-to-many classification was evaluated. It was shown that in this case, both scattering- and fluorescence-based recogni-tion algorithms fall short of acceptable quality. The com-binations of these algorithms performed better, exceeding
80 % accuracy for 5 out of 11 species. Fluorescence spec-tra showed similarities among different species, ending up with three well-resolved groups: (Alnus,Corylus,Betulaand Quercus), (SalixandPopulus) and (Festuca,Artemisia and Juniperus). Within these groups, pollen is practically indis-tinguishable for the first-level recognition procedure. Con-struction of multistep algorithms with sequential discrimi-nation of pollen inside each group seems to be one of the possible ways forward. In order to connect the classification experiment to existing technology, a short comparison with the Hirst measurements is presented and the issue of false positive pollen detections by Rapid-E is discussed.
1 Introduction
prog-noses and issue warnings. The bulk of such efforts is based on retrospective pollen observations and climatological pollen calendars. Most observers use Hirst-type volumetric pollen traps where airborne particles (> 5 µm) are collected on a ro-tating drum covered by Melinex tape. Samples are identified by a microscopic analysis (Galán et al., 2014; Buters et al., 2018). This method is labour-intensive and tedious, requires narrow specialization abilities, and incorporates significant uncertainties (e.g. Oteros et al., 2017). In addition, due to the manual treatment of the collected samples and weekly cycle of the trap, the data are always delayed from a few days up to a few weeks. However, timely data about pollen concentration in the air are also needed for improving the accuracy of tools for personalized medicine (for example, PASYFO app, http://www.pasyfo.lt, last access: 14 Novem-ber 2018; POLLEN app, http://www.polleninfo.org, last ac-cess: 14 November 2018; NORKKO forecast and app http:// www.norkko.fi, last access: 14 November 2018; etc.) (Bous-quet et al., 2017; Horgan and Pazzagli, 2017; Pereira et al., 2018; Tabatabaian and Casale, 2018). It can also be used for informing people about the current pollen concentration in the air. Finally, real-time data are needed for short-term pollen forecasts with statistical and atmospheric dispersion models (Sofiev et al., 2013, 2015, 2017; Prank et al., 2016; Ritenberga et al., 2016; Zink et al., 2017).
As the approach to information and personal responsi-bility for health is changing, it has become a necessity to develop new methods enabling the information on air-borne pollen to become available in real time. The first at-tempts to obtain automated information were related to im-age recognition technologies (Bennett, 1990). Their develop-ment was accompanied by the formation of more potential possibilities (Ronneberger et al., 2002; Landsmeer, 2009). Currently, two types of technologies seem to be the most suitable for taxon-level classification of pollen: based on im-age recognition and laser fluorescence (or their combina-tions). Image-based technologies are used in detectors, such as BAA500 (Helmut Hund GmbH, https://www.hund.de); the laser-fluorescence-based approach is implemented in a wideband integrated bioaerosol sensor (WIBS) device (http: //www.dropletmeasurement.com, last access: 19 Novem-ber 2018), PA-300 and Rapid-E (Plair, http://www.Plair.ch, last access: 19 November 2018), whereas the new Poleno device (Swisens, https://swisens.ch/, last access: 19 Novem-ber 2018) aims at integration of both features. The Hund- and Plair-manufactured devices were used in limited-scale scien-tific studies, Oteros et al. (2015) for BAA500 and Crouzy et al. (2016) for PA-300, and showed promising results. However, the large-scale evaluation and calibration suitable for European-scale applications have yet to be concluded (Oteros et al., 2015; Crouzy et al., 2016).
The goal of the current paper is to evaluate the capabilities of the new Plair Rapid-E pollen monitor and to construct and evaluate the first-level pollen recognition algorithms using
particle scattering and fluorescent data from Rapid-E. The key questions to answer were as follows:
– can we identify different pollen genera using the Rapid-E data?
– can we identify different species within the same pollen genus?
– what is the recognition accuracy for the most common pollen types in Europe?
The experiment was performed in Šiauliai (Šiauliai Uni-versity and Finnish Meteorological Institute), Novi Sad (BioSense Institute of the University of Novi Sad) and Pay-erne (Federal Office of Meteorology and Climatology Me-teoSwiss) with three newly acquired experimental Rapid-E devices. The devices were provided with local pollen sam-ples and several pollen recognition algorithms have been constructed independently in each centre. This organization of the study allowed us to account for variability of the ac-tual technical characteristics of the individual devices and an absence of “good practice” for such types of measurements. The best classification results compared across the centres formed the basis of of this paper. Finally, outputs of the Me-teoSwiss classifier are compared with airborne pollen data collected with the Hirst-type pollen trap. The provided time series were used to discuss the “false positive” identifications important for the operational context.
2 Methods
2.1 Description of the measurement instrument The new Rapid-E instrument designed and produced by Plair SA is the successor of the first-generation particle analyser PA-300 used by Crouzy et al. (2016). It is a particle counter; i.e. it analyses all particles coming to its inlet one by one. Op-eration of the instrument is based on two physical principles: scattering of near-UV laser beam and deep-UV laser-induced fluorescence (Kiselev et al., 2011, 2013). Multi-angle scat-tering is used for determination of the particle’s morphology, such as size and shape. The fluorescent light is analysed for its spectrum and lifetime. The instrument constantly takes in the ambient air through the air inlet on the top of its panel. Sample air flow is up to 2.8 L min−1with the counting rate of up to 4500 particle detections per minute; i.e. the theoretical saturation level is 1.6×10⁶particles m−3. Since according to the device provider the smallest observable particle is 0.5 µm in diameter, this saturation level will not be reached in real-istic ambient conditions.
I. Šaulien˙e et al.: Automatic pollen recognition with the Rapid-E particle counter 3437 obtained by a powerful deep-UV laser (320 nm) source that
induces fluorescence. Its spectrum (32 measuring channels within a spectral range of 350–800 nm, eight sequential ac-quisitions with 500 ns retention) and lifetime (four particular bands) are recorded and used for the particle identification (Fig. 1).
The threshold of the particle fluorescence intensity (> 1500 units) was empirically determined as a cut-off level for suf-ficiently recorded pollen grains. The spectra were subse-quently normalized to eliminate the difference in the signal strength between the instruments. Rapid-E has an embedded mechanism for collecting the particles, which passed through the registration chamber onto sticky slides for the follow-up microscopic analysis.
The device has several modes of operation. Since the deep-UV laser has a limited resource, the 400 nm scattering image is used for prior estimation of the particle morphology and deciding if it can be pollen. In the pollen mode, the device ignites the deep-UV laser only for the 5–100 µm particle size range (used in this study). Another mode allows detection of particles in the range of 0.5–100 µm for spores, particu-late matter and bacteria identification. However, the expected lifetime of the deep-UV laser is much shorter in this mode, especially in polluted atmosphere.
2.2 Data processing and recognition methods 2.2.1 Šiauliai
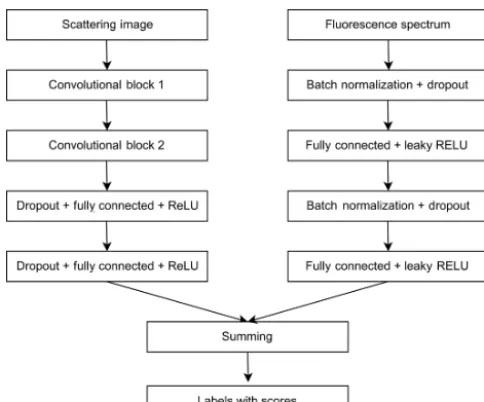
Both modalities of the Rapid-E output (scattering image and the fluorescence spectra) were processed independently with artificial neural networks (ANNs) and the scores were merged to obtain the final classification result.
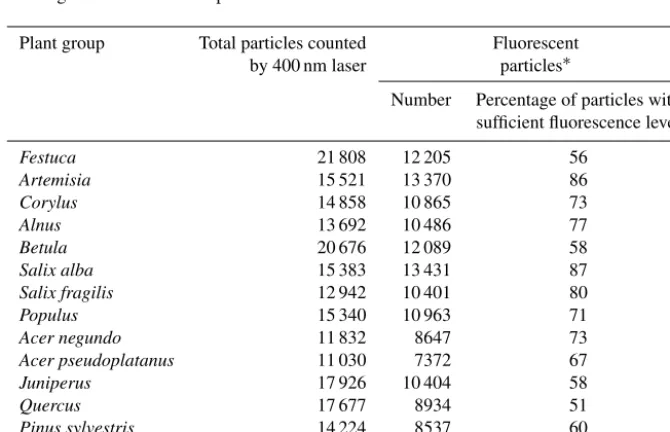
Both scattering and fluorescence signals (Fig. 1) signifi-cantly depend on the particle position with regard to the laser beam while passing through it. In particular, the apparent particle size (scattering) and the fluorescence intensity var-ied between the recordings. Apart from that, 15 %–50 % of particles are missed by the deep-UV laser. Therefore, pre-processing included (i) identification of a characteristic tem-plate of 44×20 pixels from the scattering image to localize the features characteristic for each pollen type; (ii) filtering of particles with insufficient fluorescence intensity (Table 1); (iii) normalization of fluorescence spectrum, (iv) at the first time moment, inclusion of only 16 of 32 wavelengths in the feature vector to exclude the saturated short-wavelength flu-orescence bands.
Several artificial neural networks (ANNs) were created. One of the best-performing networks included only scatter-ing and fluorescence signals, takscatter-ing them separately and dis-regarding the noisy lifetime component.
ANN for scattering images consists of two convolutional blocks for the feature extraction and two fully connected lay-ers for classification (Fig. 2).
Every convolutional block consists of the 2-D convolu-tional layer, the batch normalization layer, the rectified linear unit (ReLU) activation layer and the max-pooling layer. One mask of the convolutional layer has a size of 5×5. The con-volutional layer of the first block has 16 filters, and the one of the second block has 32 filters. The max-pooling layer selects the maximal response from the area of 2×2. At the output of the second convolutional block, the size of the feature vec-tor is 1760. The first fully connected layer has 256 neurons. The second fully connected layer classifies these vectors to the number of pollen classes chosen for the calibration. The ANN was trained using the cross-entropy loss criterion. The fluorescence spectrum was processed by a multilayer percep-tron ANN (Fig. 2) with dropout and batch normalization lay-ers used for regularization. This ANN was also trained using the cross-entropy loss criterion. Results of two ANNs were fused by summing scores of every pollen type. The training process was monitored to avoid overfitting the networks – see the Discussion section.
2.2.2 Novi Sad
All Rapid-E signals (i.e. scattering, fluorescence and life-time) were transformed into images and jointly processed by a single ANN (Fig. 3). Its architecture considers the same in-put dimensions of every image, and since the scatter signal could vary in the number of acquisitions, each image’s width was equalized by finding its centre of mass and either cut-ting or zero-padding to fit to 24×70 pixels. The dynamic range of each image was reduced by replacing each pixel value with its logarithm, which resulted in enhancement of the low-intensity pixels. Images from temporally resolved spectrum data and all bands of the lifetime data were used unprocessed.
Similarly to Šiauliai, particles with a fluorescence inten-sity less than 1500 units at the Rapid-E scale at all wave-lengths were filtered out. In addition, particles with calcu-lated optical size out of the range of 5–100 µm were filtered out using the manufacturer’s size approximation, depending on the sum of the scattering image. Size is 0.5 µm if the sum is less than 5 500 000. If the sum is between 5 500 000 and 500 000 000, the size is given by 9.95×10⁻¹·np.log(3.81× 10⁻⁵·x)−4.84×10. Finally, if the sum is greater than 500 000 000, the size is given by 0.0004×x0.5−3.9.
Each input signal is analysed with its own chain consist-ing of 2-D convolutional layers, replication paddconsist-ing layers, ReLU activation functions, batch normalization layers, max pooling and dropout layers, together forming the convolu-tional block (Fig. 3).
Figure 1.Examples of scattering images, fluorescence spectra and lifetimes of selected pollen types.
Table 1.Pollen used for testing the identification capabilities of the instrument in Šiauliai.
Plant group Total particles counted Fluorescent by 400 nm laser particles∗
Number Percentage of particles with sufficient fluorescence level
Festuca 21 808 12 205 56
Artemisia 15 521 13 370 86
Corylus 14 858 10 865 73
Alnus 13 692 10 486 77
Betula 20 676 12 089 58
Salix alba 15 383 13 431 87
Salix fragilis 12 942 10 401 80
Populus 15 340 10 963 71
Acer negundo 11 832 8647 73
Acer pseudoplatanus 11 030 7372 67
Juniperus 17 926 10 404 58
Quercus 17 677 8934 51
Pinus sylvestris 14 224 8537 60
Pinus mugo 13 399 8287 62
∗The particle fluorescence intensity level > 1500 at the Rapid-E scale for at least one emitted wavelength. The initial
I. Šaulien˙e et al.: Automatic pollen recognition with the Rapid-E particle counter 3439
Figure 2.Neural network for pollen classification in Šiauliai based on separately treated scattering and fluorescence signals.
Figure 3.Neural network for pollen classification in Novi Sad using all three signals.
the first convolutional layer had 70 filters with a kernel size of 7×1, the second one had 140 filters with a kernel size of 5×1 and that of the final block had 200 filters with the kernel size of 3×3. At the output of the final convolutional block, the sizes of the feature vectors for scattering image, fluorescence spectrum and lifetime are 1800, 1600 and 1400, respectively. Each feature vector is passed through one fully connected layer with 50 neurons. Those features were concatenated, re-sulting in the feature vector of dimension of 150. The size of the second (last) fully connected layer was the same as the number of classes, after which the samples were classified with the log-softmax activation function.
Figure 4.Neural network used for classification at Payerne.
The ANN was trained using negative log-likelihood (NLL) loss and the stochastic gradient descent with a learning rate of 0.001 and a momentum of 0.9.
2.2.3 Payerne
At the preprocessing stage, all three signals were normal-ized with their maxima. For scattering, the image was ad-ditionally centred and cut to a 24×100 shape. Extra filtering was imposed, retaining only calibrations with an optical size above 10 µm and a fluorescence signal in a range and spec-trum compatible with single pollen grains (see Crouzy et al., 2016, for examples of spectra). The optical size correspond-ing to 10 µm was estimated by comparcorrespond-ing the integral of the scattering signal of 5 µm polystyrene latex particles (PSLs) with the integral of the scattering signal forUrticaand Pari-etariapollen grains.
For scattering ANN, 5×5 convolutions were applied with 32 filters, ReLU activation and the pooling layers with a 2×2 window. For lifetime, 1-D convolution was applied with ReLU activation, with a window size of 10×1 and 10 fil-ters. For the spectrometer, asymmetric 2×4 convolution was applied with eight filters with ReLU activation. The ANN was trained using the Adam optimizer and categorical cross-entropy as loss function (Fig. 4).
2.2.4 Additional filtering of false positives in operational context
Even if high expectations on the performance of the classifier are met, problems are bound to occur in the operational ap-plications due to false positive detections. For example, birch pollen concentrations regularly exceed 1000 pollen m−3 in Switzerland in spring. If just 2 % of these are misinterpreted as ambrosia pollen, for example, the false concentration of 20 grains per cubic metre would already be significant for allergy analysis. In order to cope with this, extra steps were introduced in Payerne. Additional filtering was applied dis-regarding the events with classification quality below a cer-tain threshold as in Crouzy et al. (2016), where a reduction of sampling of 20 % led to an increase in precision of about 10 %.
For the operational monitoring, at least a few events with an extremely good classification score were required dur-ing the same or two preceddur-ing days to accept the middle-confidence recognition of the specific pollen type. This con-dition is applied uniformly over the pollen season to verify what pollen taxa are present in the air.
2.3 The scheme of the experiment
In this section, we present in detail how the calibration exper-iment was implemented in Šiauliai, followed by the descrip-tion of specifics of the setups in Novi Sad and Payerne. Most importantly, only pollen characteristic for each location was used. Comparison of the results was based on pollen types belonging to the same plant families found in all three loca-tions.
2.3.1 Šiauliai
The experiment in Šiauliai was carried out with 14 pollen morphotypes, the tested amounts of which are given in Ta-ble 1. Three genera (Salix, Acer, Pinus) were represented by two plant types. All 14 plants are naturally widespread in Lithuania and their airborne pollen is abundantly recorded annually (Šaulien˙e et al., 2016).
Pollen was taken from the plant inflorescences collected during the vegetation period in April–August of 2018 during the days with intense pollen release. The collected material was put in air-permeable paper bags and dried at a tempera-ture of 40◦C until the maximum release of pollen from the
inflorescences. A vibratory sieve shaker Analysette 3 PRO was used for gentle shaking of the pollen grains out of the in-florescences. The extracted pollen was stored in petri dishes at+4◦C.
Each experiment was performed twice and consisted of up to eight sample tests, using approximately 5 mg of pollen per sample test. The number of grains registered in the scattering signal is indicated in Table 1 as “total particles”, whereas the
Figure 5.The scheme of the experiment for identification of pollen.
column “fluorescent particles” shows the number of grains with usable fluorescent and lifetime signals.
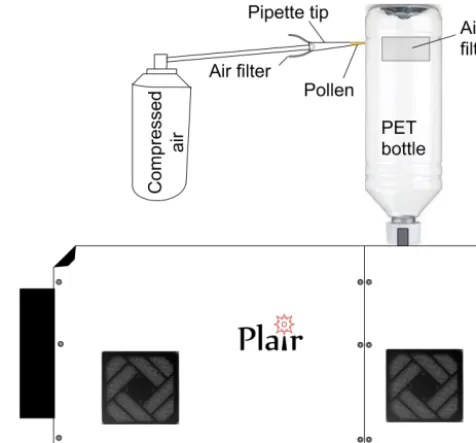
The experiments were carried out in laboratory conditions with a self-designed manual exposure method (Fig. 5). In or-der to isolate the environment of the experiment from the am-bient particles, a plastic (PET) bottle was fitted tightly to the Rapid-E inlet. One of the bottle walls was cut open and two holes of∼15 cm2were covered with a household air filter. The filter fabric was tested to hold∼99 % of particles larger than 1 µm in diameter without any noticeable disturbance of the air inflow into the device.
The pollen was injected into the upper part of the bottle by inserting the pipette tip with the pollen sample into the nar-row cut in the bottle and then gently blowing the air through the pipette. With the sampling rate up to 2.8 L min−1, Rapid-E was collecting the pollen grains from the bottle within a few tens of seconds. This simple scheme enabled reduction of the environmental sample contamination by up to 5 times compared to the unfiltered air in the lab. Each new exper-iment used a new bottle and the nozzle of the instrument was cleaned, thus ensuring the removal of previously sam-pled pollen.
I. Šaulien˙e et al.: Automatic pollen recognition with the Rapid-E particle counter 3441
Figure 6.Fluorescence spectra (first acquisition) ofSalix,PinusandAcerspecies.
in pollen mode, which excluded particles smaller than 5 µm of optical size.
2.3.2 Novi Sad
The scheme of the pollen exposure experiment was similar to that in Šiauliai. The exposure was conducted on the roof by fitting the PET bottle to the sampling pipe after removing the Sigma-2 inlet. Manual microscopic analysis of sticky slides was used to confirm the quality of samples and absence of non-pollen debris and pollen agglomerates. The device was also in pollen mode; i.e. it filtered out particles smaller than 5 µm of optical size.
Classification was tested for an adjusted set of pollen mor-photypes accounting for the availability of the fresh material during the study season. In particular,Juniperuswas replaced byTaxusandFestucawas replaced byCynodonandDactylis, aiming to assess the degree of discrimination between dif-ferent grass genera. Similarly,PiceaandCedruspollen was used for assessing differences between the same pollen mor-photype. OnlyAcer negundowas analysed as it is the only Acerpollen that is recorded regularly in Serbia.Fraxinus (in-cluding bothF. excelsiorandF. ornus) was added to the test as it is commonly recorded throughout spring.
2.3.3 Payerne
Low ambient concentration of coarse particles allowed a less laborious approach: pollen calibrations in Payerne were per-formed by directly blowing the material into the Sigma 2 in-let, without protection from contamination. The details of the procedure are described in Crouzy et al. (2016). In order to obtain a reasonable panel of the relevant pollen types, 60
cal-ibrations were performed for 21 different taxa. Focus was set on repeating calibrations, if possible under varying con-ditions. Only fresh pollen was used and time between col-lection and calibration was reduced to a minimum (range: 15–120 min). The presence of agglomerates and debris was investigated by collecting histograms of the optical size and of the fluorescence intensity of the recorded events. Cut-offs were introduced accordingly, in order to retain only single pollen grains. The device was also in pollen mode; i.e. it fil-tered out particles smaller than 5 µm of optical size.
3 Results obtained in Šiauliai
The analysis was started from a semi-qualitative considera-tion of the fluorescence spectra, primarily aiming at demon-stration of the capabilities and the limitations of the approach and preliminarily assessing the principal possibility of con-structing a reliable particle recognition algorithm.
3.1 Qualitative comparison of the fluorescence spectra of different pollen species
3.1.1 Comparison of fluorescence spectra of different species of the same genus
Figure 7. Comparison of fluorescence indicators of the tested pollen. The blue line represents the first acquisition. All other lines are acquisitions delayed by a step of 500 ns from the last. Shadows show the standard deviation ranges for each acquisition. In the figures, the xaxis represents the wavelength, nm. Theyaxis shows the amplitude; units not available.
0.001) at all wavelengths for bothPinusandAcermean spec-tra and even for some wavelengths of theSalixspectra.
Despite statistically significant differences between the mean spectra, the sample standard deviation (shadowed ranges in Fig. 6) was quite large. Therefore, it was not pos-sible to distinguish between Salix alba and Salix fragilis. The normalized spectra of Pinus sylvestrisandPinus mugo coincided at the maximum value of the amplitudes at the wavelength of 460 nm but the mean amplitude of the Pi-nus sylvestris spectrum was higher in the short-wave range (< 450 nm). At the longer wavelengths (480–550 nm) the am-plitude was higher for thePinus mugopollen. However, these differences were well inside the sample standard deviation. The difference between the species of the Acergenus was the most pronounced and, even taking the sample variability into account, these were the ones that could be distinguished. TheAcer pseudoplatanusspectrum showed a higher ampli-tude thanAcer negundo in the short-wave range and lower amplitude in the central part of the spectrum (400–520 nm).
Therefore, two out of three tested genera allowed, in prin-ciple, an inter-genus species classification using the pollen fluorescence spectrum. However, the differences between them were evidently too small for the multispecies algorithm
considered in the current paper. Practical work was therefore left for the follow-up studies.
3.1.2 Comparison of fluorescence spectra of species of different genera
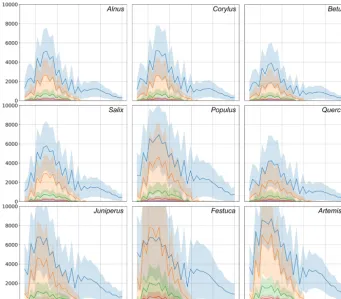
The study included 11 different pollen genera (Table 1), whose spectra are shown in Fig. 7 for recordings at every 500 ns starting from the first pulse reaching the detector. For all species, the most intense fluorescence was observed for the wavelengths from 390 to 570 nm, with different locations of the maximum and with different amplitude. For example, the highest mean intensity of fluorescence was recorded for theArtemisiapollen: it exceeded > 7000. Meanwhile, the am-plitudes ofBetulaandQuercusreached more than 4000. In all cases, the first pulse had a wider wavelength range than the subsequent ones. The amplitudes of already the second recording (500 ns from the first pulse) were close to zero for wavelengths longer than 600 nm.
I. Šaulien˙e et al.: Automatic pollen recognition with the Rapid-E particle counter 3443 the first and second signals was larger than for other tested
taxa. Tests withFestucapollen actually showed that, unlike all other species, the signal amplitude grows during the first 500 ns, resulting in the absolute maximum intensity of the spectrum registered at the second recording, 500 ns after the fluorescence is induced.
The qualitative analysis of the data was continued by grouping the data according to similarity of the fluorescence spectrum of the first recording (Fig. 8).
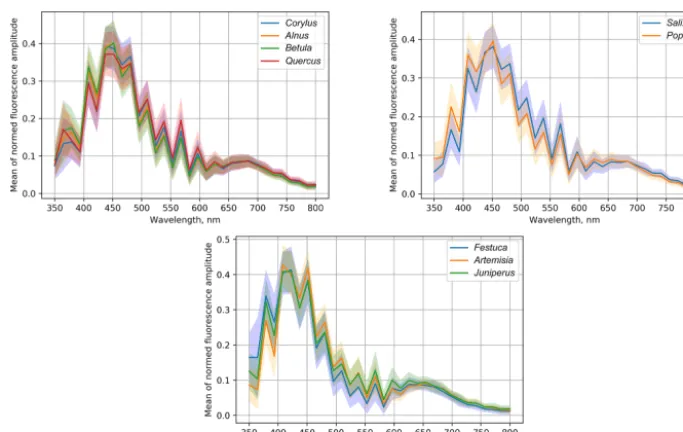
Alnus, Corylus and Betula plants are in one taxonomic family, and our results indicate that their pollen has a similar fluorescence spectrum. Interestingly, according to the simi-larities of the fluorescence spectra,Quercuspollen appeared in the same group withBetulaceae, although the maximum value of its mean of the normalized spectrum was the lowest in the group.
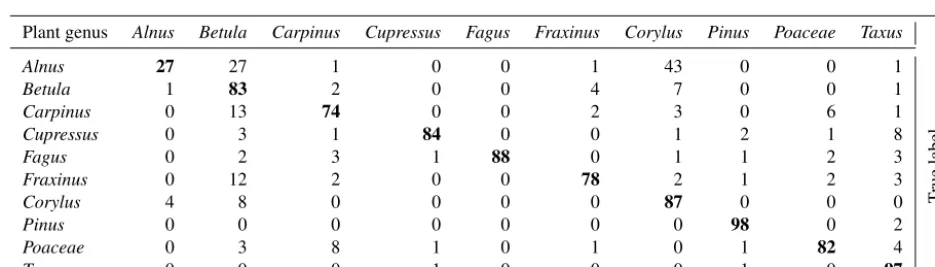
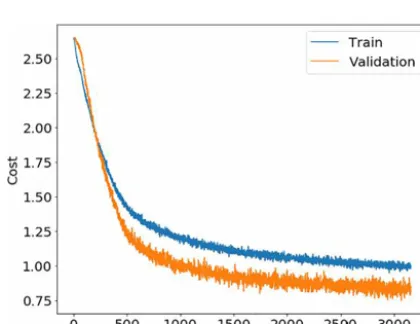
Another group in which the pollen fluorescence curves have similar shapes also consists of pollen of woody plants: PopulusandSalix. They also bloom at a similar time; there-fore their precise identification is an important but, as seen from Fig. 8, challenging task. The tested grass pollens form a separate group, which however also included pollen of the woody plant Juniperus. This group is characterized by the high mean amplitude in the short-wavelength (< 400 nm) range.
3.2 Recognition skills
The key practical question for Rapid-E application in daily pollen monitoring is the accuracy of the pollen type clas-sification presented below via the confusion matrices. In these matrices, rows represent the actual type of pollen and columns are the assigned type. All values are a percentage, and the sum of values over each row is 100 %: every pollen has to be assigned to some type.
3.2.1 Comparison of the confusion tables obtained in Novi Sad, Payerne and Šiauliai
The recognition procedure in Šiauliai was built indepen-dently for scattering and fluorescence signals with subse-quent fusion of the results. The tables for the individual com-ponents are presented in the Supplement. Tables S1 and S2 in the Supplement present the outcome of the combined identi-fication using both the scattering image and the fluorescence spectra. With the exception ofAlnus, the combination of the identification methods showed better recognition skills than each of the methods separately. Overall, the improvement over individual methods was∼23 % compared to scattering images and∼7 % compared to fluorescence.
Overall, 6 out of 11 tested pollen genera were identified with accuracy better than 75 %. The best results (> 91 % of correct classification) were achieved for Pinus pollen. The pollen of theBetulaceaegenus was identified comparatively
well but the recognition of the individual species of this fam-ily was poor.
The overall accuracy was very similar for Šiauliai and Novi Sad and somewhat better for Payerne, partially owing to the stricter filtering of the raw data. Although it is dif-ficult to make an exact comparison of the confusion tables between the studies, it still sheds some light on the overall performance and also highlights the similarities and differ-ences between the regions. Comparing the Tables 2 and 3, one can see that the difference in the recognition quality is about 10 % for most species, and practically identical for Be-tula(∼50 % in both studies) andQuercus(∼60 %).
Somewhat higher skill in Novi Sad was obtained for Cory-lus, Alnus and Populus while in Šiauliai higher skill was reached forAcerandArtemisia. It is interesting to note that the confusion between the two chosen grass pollen morpho-types in Novi Sad was not notable and for these genera the Rapid-E data have certain discrimination potential. One can therefore conclude that the multispecies discrimination algo-rithms applied in these studies showed similar recognition skills. It should be stressed however that the training of the ANNs was completely independent and used local pollen grains. Therefore, the similar recognition quality does not imply similar pollen in these regions.
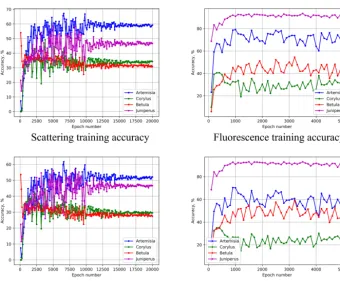
As mentioned earlier (Sect. 2.2.3), the calibration proce-dure used at MeteoSwiss was slightly different than in Novi Sad and in Šiauliai. In addition, the focus at MeteoSwiss was more towards operational applications. As a consequence, only a subset of the 60 calibrations was used to train the clas-sifier. Only taxa with high relevance for monitoring or for which very good calibrations were available were selected. It was noticed that increasing the number of taxa could worsen the problem of false positive detections (see below). An opti-mum for monitoring purposes was found when using 10 taxa. The performance of the corresponding classifier is shown in Table 4.
It is interesting to note that, as expected, most errors oc-cur within theBetulaceaefamily, with an extremely low re-call forAlnus. It was hypothesized that, although calibrations were repeated, the classifier may to some extent recognize the conditions under which the calibration was performed and quality of the sample. Obtaining a classifier working only on the generic features of the taxa is a very difficult task. A holistic validation procedure, going from the analysis of de-vice raw output (Sect. 3.1) analysis to the comparison with reference measurements (Sect. 4.5), is therefore essential.
4 Discussion
4.1 Overtraining – a problem?
eval-Figure 8.Groups with similar fluorescence spectra.
Table 2.Confusion table obtained in Šiauliai. Accuracy is 73 %.
Plant genus Festuca Artemisia Corylus Alnus Betula Salix Populus Acer Juniperus Quercus Pinus
Festuca 88 1 0 0 0 0 2 5 2 0 2
T
rue
label
Artemisia 2 86 0 0 0 2 1 4 5 0 0
Corylus 2 0 63 17 8 1 0 0 0 9 0
Alnus 1 0 15 53 18 2 1 0 0 9 1
Betula 3 1 9 30 47 1 1 0 1 6 1
Salix 1 1 2 1 2 78 10 0 1 4 0
Populus 3 6 1 1 1 18 58 3 3 5 1
Acer 5 2 1 1 1 0 2 86 1 1 0
Juniperus 4 4 0 0 0 0 3 1 87 0 1
Quercus 2 0 9 10 5 4 1 0 0 69 0
Pinus 7 0 0 0 0 0 0 0 1 0 91
Predicted label
uation and via an explicit verification of homogeneity of the datasets.
4.1.1 Performance in the training and test datasets
Prior to starting the ANN training, all datasets were split into the training and test subsets. The test subset in Šiauliai con-sisted of 1000 particles picked at the end of every calibration event while all other particles were used for training. The Ši-auliai ANN training continued until saturation of the recog-nition quality for the training dataset (see example in Fig. 9), thus including the overfitting range. The maximum perfor-mance of the fluorescence-based recognition was obtained at the epoch of ∼900, after which the overfitting gradually picked up. Therefore, the ANN parameters after this epoch were taken as the study outcome. For the
scattering-image-based training, a similar consideration suggested the epoch 3500 as the optimum.
For Novi Sad (Fig. 10), the training was stopped before the overfitting picked up and thus the parameters of the last trained epoch 3000 were used.
4.1.2 Test of homogeneity of the calibration datasets One of the concerns regarding the fluorescence-based tech-nology is the stability of the spectra for different conditions of pollen grains, which are affected by ambient humidity, temperature, time they spend in the air, chemical interaction and degradation, etc. Full-scale evaluation of this problem lies beyond the scope of this paper. Here, we only present a brief check demonstrating that it was not the major issue.
inde-I. Šaulien˙e et al.: Automatic pollen recognition with the Rapid-E particle counter 3445
Table 3.Confusion table obtained in Novi Sad. Accuracy is 74 % (obs. different number of species).
Plant genus Dactylus Cynodon Corylus Alnus Betula Salix Fraxinus Populus Acer Artemisia Taxus Quercus Picea Cedrus
Dactylus 78 3 0 3 0 2 0 4 5 0 1 0 0 0
T
rue
label
Cynodon 4 70 0 0 0 6 1 0 0 12 5 0 2 0
Corylus 0 0 64 6 12 1 10 0 0 0 4 2 0 0
Alnus 1 2 6 72 3 2 3 2 1 2 6 3 0 0
Betula 1 0 25 5 51 3 3 0 0 1 1 10 1 0
Salix 3 1 0 2 1 80 3 2 2 2 1 3 1 0
Fraxinus 0 0 7 1 3 2 79 1 0 0 4 3 0 0
Populus 5 3 1 4 0 4 3 71 1 1 3 4 1 0
Acer 8 1 0 2 1 4 0 0 73 0 1 9 1 0
Artemisia 1 5 0 2 1 4 0 1 0 84 0 1 1 0
Taxus 0 3 0 2 0 0 0 0 0 0 93 1 1 0
Quercus 1 0 4 5 8 9 2 1 1 1 1 63 4 0
Picea 3 3 0 2 4 3 0 1 1 7 1 13 61 0
Cedrus 0 0 0 0 0 1 0 1 0 1 0 0 1 95
Predicted label
Table 4.Confusion table obtained at MeteoSwiss, Payerne. Accuracy is 80 %.
Plant genus Alnus Betula Carpinus Cupressus Fagus Fraxinus Corylus Pinus Poaceae Taxus
Alnus 27 27 1 0 0 1 43 0 0 1
T
rue
label
Betula 1 83 2 0 0 4 7 0 0 1
Carpinus 0 13 74 0 0 2 3 0 6 1
Cupressus 0 3 1 84 0 0 1 2 1 8
Fagus 0 2 3 1 88 0 1 1 2 3
Fraxinus 0 12 2 0 0 78 2 1 2 3
Corylus 4 8 0 0 0 0 87 0 0 0
Pinus 0 0 0 0 0 0 0 98 0 2
Poaceae 0 3 8 1 0 1 0 1 82 4
Taxus 0 0 0 1 0 0 0 1 0 97
Predicted label
pendent calibration sessions for four species; these sessions were performed on different days and thus with pollen of different ages. A simple check of homogeneity of the flu-orescence spectra is then to use the data of one of these days as the training set and those from another day as the test subset. A substantial difference in the recognition qual-ity would point at the inhomogeneous data. Distinguishing the four species is simpler than 11 but the difference between the training and test recognition quality is important.
Comparing the upper and lower rows of Fig. 11, one can see that for the above epochs (3500 for scattering- and 900 for fluorescence-based ANNs), the quality of recognition for the training subset (one day) and test subset (another day) differs by < 5 % for all four species. Therefore, we conclude that the conditions during the different days of calibration did not affect the homogeneity of the dataset.
4.2 Comparison with other studies on pollen recognition
During recent years, a number of attempts to obtain infor-mation about pollen concentration in the air in real time
have been undertaken. However, even the most success-ful tests carried out with WIBS-4 (O’Connor et al., 2014), Hund BAA500 (Oteros et a., 2015), Yamatronics KH-3000-01 (Kawashima et al., 2KH-3000-017) and Plair PA-300 (Crouzy et al., 2016) devices, strongly advancing the pollen monitoring field, left open the questions of scalability and replicability of the results. They also did not touch the topics related to application of the tested systems in the operational context. Application of yet another new device – Plair Rapid-E – in our study pursued, apart from the scientific objectives, opera-tional implementation as a mid- to long-term goal. However, having tested 14 different pollen morphotypes, we found that significant work is still needed.
Figure 9.Šiauliai ANN multispecies cost function for scatter-based(a)and fluorescence-based(b)recognition as a function of the training epoch.
Figure 10.Novi Sad ANN overall cost as a function of the training epoch. The evaluation error is lower than the training error due to dropout (0.5) in each convolutional and fully connected layer, not used in the validation round.
Takahashi et al., 2018). However, it seems to be more or less sufficient for that region.
Varying levels of allergenicity of species within a single genus or a family raise the question of whether intra-genus classification is possible. Hirst-based manual techniques do not allow it: pollen grains are too similar in the microscopic analysis. Our results show that such a level of identification is not immediately possible using Rapid-E information ei-ther. In particular, our data demonstrated that the fluores-cence spectra of theSalix albaandSalix fragilisspecies were almost identical. More promising were the experiments with PinusandAcer(Fig. 6) and some grasses (Table 3) where the work should be continued with different identification algo-rithms built for these very species after their separation from other pollen types. Other genera should also be tested.
Fluorescence spectra can be similar not only between species of a particular genus but also between different fami-lies. Several groups of otherwise unconnected species mani-fested very similar spectra, to a degree that did not allow their reliable differentiation (Fig. 8). Similar results were obtained
in the studies conducted by O’Connor et al. (2011). They as-sessed the fluorescence spectrum of pollen of the Betulaceae family and stated that “birch and alder spectra closely resem-ble each other although there is a possibility that the birch pollen is less fluorescent than alder”. Our results show that in the case ofAlnus, the fluorescence amplitudes are higher than ofBetulabut the spectra are indeed similar.
Similar spectra ofSalixandPopuluspollen (Fig. 7) also resulted in poor differentiation between them. At the same time, the degree of confusion was higher forPopulusthan forSalix(Tables 2–4). This is in agreement with the results obtained with Hund BAA500 by Oteros et al. (2015), who identifiedSalixpollen as the worst of pollen types analysed (Oteros et al., 2015). The BAA500 algorithm is based on recognition of the particle shape, which can be weakly re-lated to the scattering images in our study – the very part that showed substantial confusion of almost all studied pollens withSalixandPopulus.
Crouzy et al. (2016) suggested that a non-zero fluores-cence amplitude around the 600 nm wavelength is incompati-ble with pollen from the Betulaceae family (Alnus,Carpinus, CorylusandBetula) but could possibly be observed for grass pollen (DactylisandPhleum) (Crouzy et al., 2016). Our re-sults support this suggestion and in addition the test in Novi Sad shows that ANN could show some discriminatory power betweenDactylisandCynodon. Noteworthy, recognition of the herbaceous plants (Festuca,Artemisia) was also consid-erably better than that of pollen of the Betulaceae family in Šiauliai (Table 2).
I. Šaulien˙e et al.: Automatic pollen recognition with the Rapid-E particle counter 3447
Figure 11.Performance of the Šiauliai ANN for the test subset taken from different days than the calibration subset. Values are percentages.
automated discrimination of just one species (Cryptomeria japonica) from non-pollen particles using KH-3000 was al-ready high 10 years ago (Kawashima et al., 2007, 2017). Similarly, the high fraction of BAA500 true positive counts (93.3 %) against manual analysis of individual species by Oteros et al. (2015) went down to 65 % when the recogni-tion of 13 pollen morphotypes was requested. It took an ad-ditional training of the algorithm to raise it up to the same 72 % as in our study. Finally, it should also be noted that PA-300 delivers fewer parameters than Rapid-E, possibly mak-ing it difficult to identify the important combinations in the raw signal in a single-level many-to-many identification task. Application of additional levels of the discrimination filters can improve the results.
4.3 Possible ways to improve the recognition skills The dependence of the recognition quality on the number of categories is one of the directions of future research. It may be possible to consider independent groups of pollens that never (or very rarely) appear in the air at the same time – but it can make the algorithm place-specific. It is vital however to obtain improvement of the algorithm for reliable separation of pollens that can be in the air together (e.g. Betulaceae, Quercusand the like).
Considering improvements of the recognition algorithms, Matsuda and Kawashima (2018) suggested the “extract win-dow” method of analysis of the scattering images, which
en-abled us to distinguish unique ranges of light-scattering in-tensities for each taxon. However, the reliability of the algo-rithm is known only for five pollen morphotypes. Develop-ment of this and similar approaches for the Rapid-E scatter-ing images may eventually improve this line of analysis and, subsequently, push up the overall scores.
Since the output of the ANN can be transformed to give a vector of probabilities, where each elementi of the vec-tor represents the probability that the sample belongs to class
ci, we expect improvement of the classification accuracy if
we demand that the classification occurs only if the high-est probability in that vector is greater than some probability threshold, but with the price of discarding the samples below the defined threshold. This direction was initially explored by Crouzy et al. (2016) and showed high potential: discard-ing 20 % of samples led to an increase in precision of about 10 % (see also Sect. 2.2.4).
Figure 12. Comparison between automatic (Plair Rapid-E) and manual (Hirst-type) pollen counts forBetula,Fraxinus, Pinaceae and
Poaceae.
4.4 Lessons from the comparison of the Hirst and Rapid-E measurements
Comparison of Rapid-E of MeteoSwiss with the operational Hirst measurements in Payerne from February to June 2018 extended the results of Crouzy et al. (2016) to more impor-tant taxa (Fig. 12), but also showed that robust determination of the sampling still needs to be achieved.
In order to obtain pollen concentrations, large particles presenting bimodal fluorescence spectra with position and intensity of maxima compatible with the observations made from calibrations (see Sect. 3.1) were first selected. Then, the classifier presented in Sect. 2.2.3 was applied. The effec-tive sampling of Rapid-E is the result of a series of physi-cal and algorithmic processes: the sampling efficiency of the Sigma-2 head, the imperfect targeting by lasers and the drop-offs due to the below-threshold classification. In Fig. 12, the Rapid-E data are scaled with species-dependent factors (con-stant over the season), bringing the seasonal mean to that of the Hirst time series. The issue deserves attention since, as shown by the Novi Sad results, tightening the thresholds im-proves the recognition skills but increases the drop-offs at the recognition stage. Sampling with Poaceae is the high-est, Pinaceaepresents a 2 % decrease in sampling and Be-tula presents a 33 % decrease in sampling with respect to
Poaceae. False positives are a significant issue withFraxinus: the sampling is dramatically reduced (75 %) for higher fluo-rescence thresholds. As a consequence of those limitations, the results presented here should not be taken as a complete demonstration of operational capabilities.
The suppression of the false positive detections as de-scribed in Sect. 2.2.4 worked quite efficiently but still an evident false positive event resulting from the Betula mis-interpretation asPoaceaeis visible in the beginning of April. Further work is required to completely remove such events, and, as a last resort, expert supervision could be used in an operational setup.
4.5 Opinion of the Rapid-E producer
During the work, we have been in periodic contact with the Plair company regarding features and issues of the Rapid-E devices used by our groups. With the paper finalized, we asked for their feedback.
Denis Kiselev, Plair, said
fil-I. Šaulien˙e et al.: Automatic pollen recognition with the Rapid-E particle counter 3449 tering falls short of the actual needs. Our results
are 5 %–10 % better without overfitting the data or other special processing. The time series Plair gets for “problematic pollens” likeBetula, Corylusand Alnusare actually very good. Our goal is to obtain high-quality time series calculated in real time by the instruments and the good calibration is essen-tial for that.
We agree with importance of the calibration datasets; the procedures ensuring their quality are described in the Methodology section and further explained in the discussion above. Note that our groups were working largely indepen-dently using local pollen and original methods of the data collection and processing. Therefore, the similarities in the observed features provide additional support for our conclu-sions. Unfortunately, details of the Plair analysis were not available when the paper was prepared. Therefore, indepen-dent evaluation of that algorithm against the common criteria described in this paper was not possible.
5 Conclusions
We conducted the first analysis of the pollen monitoring ca-pabilities of the new automatic pollen detector Plair Rapid-E. Using the very limited data pre-processing and basic ANN classification it was shown that, if comparatively large num-bers of pollen types are considered, stand-alone scattering-and fluorescence-based recognition algorithms fail to pro-duce reliable results for the majority of species. The combi-nation of these algorithms performed better, exceeding 80 % accuracy for 5 out of 11 species. Therefore, this combina-tion can be considered the first-stage classificacombina-tion of pollen types. It should be followed by more in-depth discrimination efforts, also including lifetime of florescence in the classifi-cation model.
The fluorescence spectra showed similarities among sev-eral tested species ending up with three groups: (Alnus, Cory-lus,BetulaandQuercus), (SalixandPopulus) and (Festuca, Artemisia andJuniperus) – as identified from the Šiauliai data. The classification between the groups was compara-tively easy. Attempts to distinguish between the species of the same genus showed certain potential for some genera but more work is needed.
The results obtained in Šiauliai and Novi Sad with a very similar experimental setup but independent analysis, showed comparable results confirming the overall conclusions. They also pointed out certain limitations of replicability of the raw data features between the devices, which will require an addi-tional conversion step to make them compatible. In this line, the comparison performed at MeteoSwiss shows a reason-able potential for automatic monitoring of important taxa; however it is not clear to which extent algorithms can be transposed from one device to another.
The in-depth discussion and improvement of the method-ology and the extension to more taxa goes beyond the scope of this paper. We decided to communicate the current results early, as well as the methods developed independently by the three teams currently working with the Rapid-E counters, in order to stimulate parallel developments by the user commu-nity of the Rapid-E devices. The emergence of such a com-munity is a good opportunity to address generalization and replicability of the device-specific results. We also believe that moving from expert supervision or calendar methods to the approach presented here and based only on device out-puts for elimination of false positive detections could be of help for other automatic monitoring systems.
– Among the main challenges to be resolved in future work, the most important ones are
– to obtain reliable recognition skills at least for the pollen types that can be in the air at the same time
– to reach full replicability of the algorithms and results across the different copies of the same monitors (we are thankful to the Plair team for suggesting the scripts ad-dressing this problem, which are now under evaluation) – to resolve specific questions related to the algorithm construction and training – including the minimal sam-ple volume, problems of over- and underfitting, prepro-cessing and pre-filtering of the data, false positive iden-tifications, etc.
Successful resolution of these questions will open the way for wide applications of the automatic particle counters for pollen observations.
Code and data availability. All data and algorithms presented in the paper are experimental and subject to further development. They are available for research purposes on request to the authors of the paper. Work is in progress to harmonize the algorithms and make them public together with the data via open software and data repos-itories. The possibility of a GPL-type license is being evaluated.
Supplement. The supplement related to this article is available online at: https://doi.org/10.5194/amt-12-3435-2019-supplement.
Author contributions. All the authors made significant contribu-tions to this study. The conceptualization was performed by MS Experiments in Šiauliai were conducted by IŠ, LŠ, GD, GV and LV; in Novi Sad by PM, SB, MP and BS; and in Payerne by BC and BCr. All authors contributed to the methodology, the interpretation of the results and the editing of the paper.
Acknowledgements. Authors thank the Plair engineering team for their advice concerning the Rapid-E operations.
Financial support. This research has been supported by the Euro-pean Social Fund (project no. 09.3.3-LMT-K-712-01-0066) under grant agreement with the Research Council of Lithuania (LMTLT), the Academy of Finland (PS4A grant no. 318194) and the Real-ForAll project (grant no. 2017HR-RS151) co-financed by the In-terreg IPA Cross-border Cooperation Programme Croatia–Serbia 2014–2020 and the Provincial Secretariat for Science, Autonomous Province Vojvodina, Republic of Serbia.
Review statement. This paper was edited by Vassilis Amiridis and reviewed by four anonymous referees.
References
Akdis, C. A., Hellings, P. W., and Agache, I. (Eds.): European Academy of Allergy and Clinical Immunology. Global atlas of allergic rhinitis and chronic rhinosinusitis, EAACI, Zürich, 2015. Bennett, K. D.: Pollen counting on a pocket computer, New Phytol., 114, 275–280, https://doi.org/10.1111/j.1469-8137.1990.tb00399.x, 1990.
Bousquet, J., Van Cauwenberge, P., Ait Khaled, N., Bachert, C., Baena-Cagnani, C. E., Bouchard, J., Bunnag, C., Canonica, G. W., Carlsen, K. H., Chen, Y. Z., Cruz, A. A., Custovic, A., De-moly, P., Dubakiene, R., Durham, S., Fokkens, W., Howarth, P., Kemp, J., Kowalski, M. L., Kvedariene, V., Lipworth, B., Lockey, R., Lund, V., Mavale-Manuel, S., Meltzer, E. O., Mul-lol, J., Naclerio, R., Nekam, K., Ohta, K., Papadopoulos, N., Passalacqua, G., Pawankar, R., Popov, T., Potter P., Price, D., Scadding, G., Simons, F. E. R., Spicak, V., Valovirta, E., Wang, D.-Y., Yawn, B., and Yusufand, O.: Pharmacologic and anti-IgE treatment of allergic rhinitis ARIA update (in collaboration with GA2LEN), Allergy, 61, 1086–96, https://doi.org/10.1111/j.1398-9995.2006.01144.x, 2006.
Bousquet, J., Schunemann, H. J., Fonseca, J., Samolinski, B., Bachert, C., Canonica, G. W., Casale, T., Cruz, A. A., Demoly, P., Hellings, P., Valiulis, A., Wickman, M., Zuberbier, T., Bosnic-Anticevitch, S., Bedbrook, A., Bergmann, K. C., Caimmi, D., Dahl, R., Fokkens, W. J., Grisle, I., Lodrup Carlsen, K., Mullol, J., Muraro, A., Palkonen, S., Papadopoulos, N., Passalacqua, G., Ryan, D., Valovirta, E., Yorgancioglu, A., Aberer, W., Agache, I., Adachi, M., Akdis, C. A., Akdis, M., Annesi-Maesano, I., An-sotegui, I. J., Anto, J. M., Arnavielhe, S., Arshad, H., Baiardini, I., Baigenzhin, A. K., Barbara, C., Bateman, E.D., Beghé, B., Bel, E. H., Ben Kheder, A., Bennoor, K. S., Benson, M., Be-wick, M., Bieber, T., Bindslev-Jensen, C., Bjermer, L., Blain, H., Boner, A. L., Boulet, L. P., Bonini, M., Bonini, S., Bosse, I., Bourret, R., Bousquet, P. J., Braido, F., Briggs, A. H., Brightling, C. E., Brozek, J., Buhl, R., Burney, P. G., Bush, A., Caballero-Fonseca, F., Calderon, M. A., Camargos, P. A. M., Camuzat, T., Carlsen, K. H., Carr, W., Cepeda Sarabia, A. M., Chavannes, N. H., Chatzi, L., Chen, Y. Z., Chiron, R., Chkhartishvili, E., Chuchalin, A. G., Ciprandi, G., Cirule, I., Correia De Sousa, J., Cox, L., Crooks, G., Costa, D. J., Custovic, A., Dahlen, S.
E., Darsow, U., De Carlo, G., De Blay, F., Dedeu, T., Deleanu, D., Denburg, J. A., Devillier, P., Didier, A., Dinh-Xuan, A. T., Dokic, D., Douagui, H., Dray, G., Dubakiene, R., Durham, S. R., Dykewicz, M. S., El-Gamal, Y., Emuzyte, R., Fink Wagner, A., Fletcher, M., Fiocchi, A., Forastiere, F., Gamkrelidze, A., Gemicio˘glu, B., Gereda, J. E., González Diaz, S., Gotua, M., Grouse, L., Guzmán, M. A., Haahtela, T., Hellquist-Dahl, B., Heinrich, J., Horak, F., Hourihane, J. O. B., Howarth, P., Hum-bert, M., Hyland, M. E., Ivancevich, J. C., Jares, E. J., John-ston, S. L., Joos, G., Jonquet, O., Jung, K. S., Just, J., Kaida-shev, I. P., Kalayci, O., Kalyoncu, A. F., Keil, T., Keith, P. K., Khaltaev, N., Klimek, L., Koffi N’Goran, B., Kolek, V., Kop-pelman, G. H., Kowalski, M. L., Kull, I., Kuna, P., Kvedariene, V., Lambrecht, B., Lau, S., Larenas-Linnemann, D., Laune, D., Le, L. T. T., Lieberman, P., Lipworth, B., Li, J., Louis, R., Ma-gard, Y., Magnan, A., Mahboub, B., Majer, I., Makela, M. J., Manning, P., De Manuel Keenoy, E., Marshall, G. D., Mas-jedi, M. R., Maurer, M., Mavale-Manuel, S., Melén, E., Melo-Gomes, E., Meltzer, E. O., Merk, H., Miculinic, N., Mihal-tan, F., Milenkovic, B., Mohammad, Y., Molimard, M., Mo-mas, I., Montilla-Santana, A., Morais-Almeida, M., Mösges, R., Namazova-Baranova, L., Naclerio, R., Neou, A., Neffen, H., Nekam, K., Niggemann, B., Nyembue, T. D., O’Hehir, R. E., Ohta, K., Okamoto, Y., Okubo, K., Ouedraogo, S., Paggiaro, P., Pali-Schöll, I., Palmer, S., Panzner, P., Papi, A., Park, H. S., Pa-vord, I., Pawankar, R., Pfaar, O., Picard, R., Pigearias, B., Pin, I., Plavec, D., Pohl, W., Popov, T. A., Portejoie, F., Postma, D., Potter, P., Price, D., Rabe, K. F., Raciborski, F., Radier Pontal, F., Repka-Ramirez, S., Robalo-Cordeiro, C., Rolland, C., Rosado-Pinto, J., Reitamo, S., Rodenas, F., Roman Rodriguez, M., Ro-mano, A., Rosario, N., Rosenwasser, L., Rottem, M., Sanchez-Borges, M., Scadding, G. K., Serrano, E., Schmid-Grendelmeier, P., Sheikh, A., Simons, F. E. R., Sisul, J. C., Skrindo, I., Smit, H. A., Solé, D., Sooronbaev, T., Spranger, O., Stelmach, R., Strand-berg, T., Sunyer, J., Thijs, C., Todo-Bom, A., Triggiani, M., Va-lenta, R., Valero, A. L., Van Hage, M., Vandenplas, O., Vez-zani, G., Vichyanond, P., Viegi, G., Wagenmann, M., Walker, S., Wang, D. Y., Wahn, U., Williams, D. M., Wright, J., Yawn, B. P., Yiallouros, P. K., Yusuf, O. M., Zar, H. J., Zernotti, M. E., Zhang, L., Zhong, N., Zidarn, M., and Mercier, J.: MACVIA-ARIA Sentinel NetworK for allergic rhinitis (MASK-rhinitis): the new generation guideline implementation, Allergy, 70, 1372– 1392, https://doi.org/10.1111/all.12686, 2015.
I. Šaulien˙e et al.: Automatic pollen recognition with the Rapid-E particle counter 3451 Buters, J. T. M., Antunes, C., Galveias, A., Bergmann, K. C.,
Thibaudon, M., Galán, C., Schmidt-Weber, C., and Oteros, J.: Pollen and spore monitoring in the world, Clin. Transl. Allergy, 8, 9, https://doi.org/10.1186/s13601-018-0197-8, 2018. Choual, I., Radu, C., Khayath, N., Beck, N., Schoettel, F., Jacob, A.,
Domis, N., and de Blay, F. J.: Comparison of symptoms during a conjunctival provocation test (CPT) and a controlled exposure to birch pollen in the Strasbourg Environmental Exposure Cham-ber (EEC) (ALYATEC), J. Allergy Clin. Immunol., 141, AB236, https://doi.org/10.1016/j.jaci.2017.12.748, 2018.
Crouzy, B., Stella, M., Konzelmann, T., Calpini, B., and Clot, B.: All-optical automatic pollen identification: to-wards an operational system, Atmos. Environ., 140, 202–212, https://doi.org/10.1016/j.atmosenv.2016.05.062, 2016.
Devillier, P., Wahn, U., Zielen, S., and Heinrich, J.: Grass pollen sublingual immunotherapy tablets provide long-term relief of grass pollen-associated allergic rhinitis and reduce the risk of asthma: findings from a retrospective, real-world database subanalysis, Expert Rev. Clin. Immunol., 13, 1199– 1206, https://doi.org/10.1080/1744666X.2017.1398082, 2017. Douladiris, N., Garib, V., Tejkl, M. F., Valenta, R.,
Papadopou-los, N. G., and Linhart, B.: Detection of genuine grass pollen sensitization in children by skin testing with a recombinant grass pollen hybrid, Pediatr. Allergy Immunol., 30, 59–65, https://doi.org/10.1111/pai.12991, 2018.
Galán, C., Smith, M., Thibaudon, M., Frenguelli, G., Oteros, J., Gehrig, R., Berger U., Clot, B., Brandao R., and EAS QC working group: Pollen monitoring: minimum requirements and reproducibility of analysis, Aerobiologia, 30, 385–395, https://doi.org/10.1007/s10453-014-9335-5, 2014.
Horgan, D. and Pazzagli, M.: Prevention, Early Dialogue and Ed-ucation in the Personalised Healthcare Era, Biomed. Hub., 2, 7, https://doi.org/10.1159/000479492, 2017.
Høst, A., Andrae, S., Charkin, S., Diaz-Vázquez, C., Dreborg, S., Eigenmann, P. A., Friedrichs, F., Grinsted, P., Lack, G., Meylan, G., Miglioranzi, P., Muraro, A., Nieto, A., Niggemann, B., Pas-cual, C., Pouech, M. G., Rancé, F., Rietschel, E., and Wickman, M.: Allergy testing in children: why, who, when and how?, Al-lergy, 58, 559–569, 2003.
Kawashima, S., Clot, B., Fujita, T., Takahashi, Y., and Nakamura, K.: An algorithm and a device for counting airborne pollen au-tomatically using laser optics, Atmos. Environ., 41, 7987–7993, https://doi.org/10.1016/j.atmosenv.2007.09.019, 2007.
Kawashima, S., Thibaudon, M., Matsuda, S., Fujita, T., Lemonis, N., Clot, B., and Oliver, G.: Automated pollen monitoring sys-tem using laser optics for observing seasonal changes in the con-centration of total airborne pollen, Aerobiologia, 33, 351–362, https://doi.org/10.1007/s10453-017-9474-6, 2017.
Kiselev, D., Bonacina, L., and Wolf, J. P.: Individual bioaerosol particle discrimination by multi-photon ex-cited fluorescence, Opt. Express, 19, 24516–24521, https://doi.org/10.1364/OE.19.024516, 2011.
Kiselev, D., Bonacina, L., and Wolf, J. P.: A flash-lamp based device for fluorescence detection and identification of individual pollen grains, Rev. Sci. Instrum., 84, 033302, https://doi.org/10.1063/1.4793792, 2013.
Landsmeer, S. H., Hendriks, E. A., De Weger, L. A., Reiber, J. H., and Stoel, B. C.: Detection of pollen grains in multifocal optical
microscopy images of air samples, Microsc. Res. Tech., 72, 424– 430, https://doi.org/10.1002/jemt.20688, 2009.
Leynaert, B., Neukirch, C., Liard, R., Bousquet, J., and Neukirch, F.: Quality of life in allergic rhinitis and asthma: a population-based study of young adults, Am. J. Respir. Crit. Care Med., 162, 1391–1396, https://doi.org/10.1164/ajrccm.162.4.9912033, 2000.
Matsuda, S. and Kawashima, S.: Relationship be-tween laser light scattering and physical properties of airborne pollen, J. Aerosol Sci., 124, 122–132, https://doi.org/10.1016/j.jaerosci.2018.07.009, 2018.
O’Connor, D. J., Iacopino, D., Healy, D. A., O’Sullivan, D., and Sodeau, J. R.: The intrinsic fluorescence spectra of selected pollen and fungal spores, Atmos. Environ., 45, 6451–6458, https://doi.org/10.1016/j.atmosenv.2011.07.044, 2011.
O’Connor, D. J., Healy, D. A., Hellebust, S., Buters, J. T., and Sodeau, J. R.: Using the WIBS-4 (Waveband Inte-grated Bioaerosol Sensor) technique for the on-line detec-tion of pollen grains, Aerosol Sci. Technol., 48, 341–349, https://doi.org/10.1080/02786826.2013.872768, 2014.
Oteros, J., Pusch, G., Weichenmeier, I., Heimann, U., Möller, R., Röseler, S., Traidl-Hoffmann, C., Schmidt-Weber, C., and Buters, J. T.: Automatic and online pollen mon-itoring, Int. Arch. Allergy Immunol., 167, 158–166, https://doi.org/10.1159/000436968, 2015.
Oteros, J., Buters, J., Laven, G., Roseler, S., Wachter, R., Schmidt-Weber, C., and Hofman, F.: Errors in determining the flow rate of Hirst-type pollen traps, Aerobiologia, 33, 201–210, https://doi.org/10.1007/s10453-016-9467-x, 2017.
Pereira, A. M., Jácome, C., Almeida, R., and Fonseca, J. A.: How the Smartphone Is Changing Allergy Diagnostics, Curr. Allergy Asthma Rep., 18, 69, https://doi.org/10.1007/s11882-018-0824-4, 2018.
Poethko-Müller, C., Thamm, M., and Thamm, R.: Allergic rhinitis and asthma among children and adolescents in Germany, Results of the cross-sectional KiGGS Wave 2 study and trends, J. Health Monitor., 3, 52–56, https://doi.org/10.25646/5557, 2018. Prank, M., Sofiev, M., Siljamo, P., and Kauhaniemi, M.: Increasing
the Number of Allergenic Pollen Species in SILAM Forecasts, in: Air Pollution Modeling and its Application XXIV, edited by: Steyn, G. D., Chaumerliac, N., Springer International Publish-ing, Cham, Switzerland, 313–317, https://doi.org/10.1007/978-3-319-24478-5, 2016.
Radauer, C. and Breiteneder, H.: Pollen allergens are re-stricted to few protein families and show distinct patterns of species distribution, J. Allergy Clin. Immunol., 117, 141–147, https://doi.org/10.1016/j.jaci.2005.09.010, 2006.
Ritenberga, O., Sofiev, M., Kirillova, V., Kalnina, L., and Genikhovich, E.: Statistical modelling of non-stationary pro-cesses of atmospheric pollution from natural sources: ex-ample of birch pollen, Agric. For. Meteorol., 226, 96–107, https://doi.org/10.1016/j.agrformet.2016.05.016, 2016.
Ronneberger, O., Schultz, E., and Burkhardt, H.: Auto-mated pollen recognition using 3D volume images from fluorescence microscopy, Aerobiologia, 18, 107–115, https://doi.org/10.1023/A:1020623724584, 2002.
questionnaire-based study in Lithuania, Aerobiologia, 32, 157–170, https://doi.org/10.1007/s10453-015-9387-1, 2016.
Skoner, D. P.: Allergic rhinitis: definition, epidemiology, patho-physiology, detection, and diagnosis, J. Allergy Clin. Immunol., 108, 2–8, https://doi.org/10.1067/mai.2001.115569, 2001. Sofiev, M., Siljamo, P., Ranta, H., Linkosalo, T., Jaeger, S.,
Ras-mussen, A., Rantio-Lehtimaki, A., Severova, E., and Kukko-nen, J.: A numerical model of birch pollen emission and disper-sion in the atmosphere, Description of the emisdisper-sion module, Int. J. Biometeorol., 57, 45–58, https://doi.org/10.1007/s00484-012-0532-z, 2013.
Sofiev, M., Berger, U., Prank, M., Vira, J., Arteta, J., Belmonte, J., Bergmann, K.-C., Chéroux, F., Elbern, H., Friese, E., Galan, C., Gehrig, R., Khvorostyanov, D., Kranenburg, R., Kumar, U., Marécal, V., Meleux, F., Menut, L., Pessi, A.-M., Robertson, L., Ritenberga, O., Rodinkova, V., Saarto, A., Segers, A., Severova, E., Sauliene, I., Siljamo, P., Steensen, B. M., Teinemaa, E., Thibaudon, M., and Peuch, V.-H.: MACC regional multi-model ensemble simulations of birch pollen dispersion in Europe, At-mos. Chem. Phys., 15, 8115–8130, https://doi.org/10.5194/acp-15-8115-2015, 2015.
Sofiev, M., Ritenberga, O., Albertini, R., Arteta, J., Belmonte, J., Bernstein, C. G., Bonini, M., Celenk, S., Damialis, A., Douros, J., Elbern, H., Friese, E., Galan, C., Oliver, G., Hrga, I., Kouznetsov, R., Krajsek, K., Magyar, D., Parmen-tier, J., Plu, M., Prank, M., Robertson, L., Steensen, B. M., Thibaudon, M., Segers, A., Stepanovich, B., Valdebenito, A. M., Vira, J., and Vokou, D.: Multi-model ensemble simula-tions of olive pollen distribution in Europe in 2014: current status and outlook, Atmos. Chem. Phys., 17, 12341–12360, https://doi.org/10.5194/acp-17-12341-2017, 2017.
Tabatabaian, F. and Casale, T. B.: Allergic rhinitis manage-ment: what’s next?, Expert Rev. Clin. Immunol., 14, 191–196, https://doi.org/10.1080/1744666X.2018.1438270, 2018. Takahashi, Y., Kawashima, S., Suzuki, Y., Ohta, N., and Kakehata,
S.: Enrichment of airborne Japanese cedar (Cryptomeria japon-ica) pollen in mountain ranges when passing through a front ac-companying temperate low pressure, Aerobiologia, 34, 105–110, https://doi.org/10.1007/s10453-017-9494-2, 2018.
Valenta, R., Vrtala, S., Ebner, C., Kraft, D., and Scheiner, O.: Di-agnosis of grass pollen allergy with recombinant timothy grass (Phleum pratense) pollen allergens, Int. Arch. Allergy Immunol., 97, 287–294, https://doi.org/10.1159/000236135, 1992. Wang, Q., Gong, X., Suzuki, M., Lu, S., Sekiguchi, K.,
Naka-jima, D., and Miwa, M.: Size-segregated Allergenic Parti-cles Released from Airborne Cryptomeria japonica Pollen Grains during the Yellow Sand Events within the Pollen Scattering Seasons, Asian J. Atmos. Environ., 7, 191–198, https://doi.org/10.5572/ajae.2013.7.4.191, 2013.
Wang, Q., Nakamura, S., Gong, S., Suzuki, M., Nakajima, D., Takai, Y., Lu, S., Sekiguchi, K., and Miwa, M.: Release be-haviour of Cryptomeria japonica pollen allergenic cry j 1 and cry j 2 in rainwater containing air pollutants, Int. J. Dev. Sustain, 9, 42–53, https://doi.org/10.2495/SDP-V9-N1-42-53, 2014. Zink, K., Kaufmann, P., Petitpierre, B., Broennimann, O., Guisan,