Analysis of the Runoff for Watershed Using
SCS-CN Method and Geographic
Information Systems
P.Sundar Kumar1 Dr.M.J.Ratna Kanth Babu2 Dr. T.V.Praveen3 Venkata kumar.vagolu4
1- Assoc.Prof, Dept of Civil Engineering K L University Vaddeswaram, Guntur Dist. 2- Asst.Prof, Dept of Civil Engineering K L University Vaddeswaram Guntur Dist 3- Professor, Dept of Civil Engineering, Andhra University, Visakhapatnam, A.P 4- Research Scholar, Dept of Physics, Andhra University, Visakhapatnam, A.P
ABSTRACT
The Soil Conservation Service Curve Number (SCS-CN) method is widely used for predicting direct runoff volume for a given rainfall event. The applicability of the SCS-CN method and the runoff generation mechanism were thoroughly analyzed in a Mediterranean experimental watershed in Hyderabad. The region is characterized by a Mediterranean semi-arid climate. A detailed land cover and soil survey using remote sensing and GIS techniques, showed that the watershed is dominated by coarse soils with high hydraulic conductivities, whereas a smaller part is covered with medium textured soils and impervious surfaces. The analysis indicated that the SCS-CN method fails to pre direct runoff for the storm events studied, and that there is a strong correlation between the CN values obtained from measured runoff and the rainfall depth. The hypothesis that this correlation could be attributed to the existence of an impermeable part in a very permeable watershed was examined in depth, by developing a numerical simulation water flow model for predicting surface runoff generated from each of the three 15 soil types of the watershed. The results support the validity of this hypothesis for most of the events examined where the linear runoff formula provides better results than the SCS-CN method. The runoff coefficient of this formula can be taken equal to the percentage of the impervious area. However, the linear formula should be applied with caution in case of 20 extreme events with very high rainfall intensities. In this case, the medium textured soils may significantly contribute to the total runoff and the linear formula may significantly underestimate the runoff produced.
Key words: Remote sensing; Geographical information systems; Watershed: SCS- CN: Rainfall-runoff
modelling
1.0 INTRODUCTION
Runoff is one of the most important hydrologic variables used in most of the water resources applications. Reliable prediction of quantity and rate of runoff from land surface into streams and rivers is difficult and time consuming to obtain for ungauged watersheds. However, this information is needed in dealing with many watershed development and management problems. Conventional models for prediction of river discharge require considerable hydrological and meteorological data. Collection of these data is expensive, time consuming and a difficult process.
The Soil Conservation Service Curve Number (SCS-CN) method is widely used for predicting direct runoff volume for a given rainfall event. This method was originally developed by the US Department of Agriculture, Soil Conservation Service and documented in detail in the National Engineering Handbook, Sect. 4: Hydrology (NEH-4) SCS, 1956, 1964, 1971, 1985, 1993). Due to its simplicity, it soon became one of the most popular techniques among the engineers and the practitioners, mainly for small catchment hydrology (Mishra and Singh, 2006).The main reasons 5 for its success is that it accounts for many of the factors affecting runoff generation including soil type, land use and treatment, surface condition, and antecedent moisture condition, incorporating them in a single CN parameter. Furthermore, it is the only methodology that features readily grasped and reasonably well documented environmental inputs and it is a well established method, widely accepted for use in the United States and other countries. On the other hand, the SCS-CN main weak points are the following: it does not consider the impact of rainfall intensity and its temporal distribution, it does not address the effects of spatial scale, it is highly sensitive to changes in values of its sole parameter; and it does not address clearly the effect of adjacent moisture condition (Hawkins, 1993; Ponce and Hawkins, 1996, Michel et al., 2005).
2.0 STUDY AREA DESCRIPTION
The study area consists of Hyderabad and Mahabubnagar district of A.P., India. The historic city of Hyderabad (Deccan) was founded in the year 1591 A.D. by Mohd. Qutub shah, the fifth king of Golconda, with its city center at charminar. Hyderabad city became the capital of enlarge state of Andhra Pradesh from 1st November 1956. It is situated at southern part of in the country and is the fifth largest city in India. The whole city is surrounded by hillocks on all sides and is built on undulated ground.
Hyderabad city is situated on the bank as river Musi at 170 22’ E longitudes and is an average of 1734ft.Above mean sea level. Musi River is a part of history and heritage of Hyderabad city .The Hussian Sagar bund known as Tankbund is a mile in length connects the twin cities Hyderabad and Secunderabad. Hyderabad contains innumerable archaeological, historical, educational and recreational places of interest and is a tourist paradise. The Golkonda fort, Qutub Shahi tombs, the famous charminar, Macca Masijid and Falaknuma palaces are some monuments of historical importance. Hyderabad has been the focus of administration, business and educational pursuits for over 400 years since its inception as the state capital. More recently Hyderabad has emerged as the hub of economic and IT revolution. Hyderabad as the state headquarters since the Nizam’s rule, had occupied a central position both geographically and politically.
In the study area very small part of SW corner will coming in the Mahabubnagar district was named after Mir Mahbub Ali Khan the Nizam of Hyderabad. The area of the district is 18,432 Sq.Kms. The total population of the district according to the 1981 census count is 2,444,619 persons. The district may be physiographically divided into more or less two distinct regions, the plains region with low laying scattered hills and the extensive Amarabad – Farhabad plateau. Two important rivers Krishna and Tungabhadra flow through the district. The Krishna River enters Andhrapradesh in Makthal taluk. The Tungahadra flows through the taluks of Gadwal and Alampur. Mahabubnagar district is bounded on north by Rangareddy and Nalgonda district, on the east by Nalgonda and Guntur district. On south by river Krishna and Tungabadra on west by Raichur and Gulbarga district of Karnataka state
2
.1.1 Location and Regional Setting:The Study area is situated in a part of Hyderabad and Mahabubnagar district of Andhra Pradesh between east longitude 780 30’& 78045’ and north latitude 170 0’ & 17015’ falling in SOI toposheet no. 56K/12. The Hyderabad district is situated on 17º20’ of the north latitude and 78º30’ of eastern longitude. The Hyderabad district occupies an area of 217 sq Km with density population of14, 497 per sq km. The total population of district is 38, 29,754 as per 2001 census.
The location map of the study area is given in Fig 1.0.
3
.0 METHODOLOGYThe Soil Conservation Service (SCS) model developed by United States Department of Agriculture (USDA) computes direct runoff through an empirical equation that requires the rainfall and a watershed coefficient as inputs. The watershed coefficient is called the curve number (CN), which represents the runoff potential of the land cover soil complex. This model involves relationship between land cover, hydrologic soil class and curve number. The method is based on an assumption of proportionality between retention and runoff in the form.
Normally the SCS model computes direct runoff with the help of following relationship (Hand book of Hydrology, 1972)
S = (24500/CN) - 254 --- (1) Q = ((P - 0.3S)2)/(P + 0.7S) --- (2) Where, CN = (∑ (Ci X Ai ))/A --- (3)
Where,
CN = weighted curve number.
CNi = curve number from 1 to any no. N. Ai = area with curve number CNi A = the total area of the watershed.
where CN is the runoff curve number of hydrologic soil cover complex, which is a function of soil type, land cover and antecedent moisture condition (AMC); Q, actual direct runoff, mm; P, total storm rainfall, mm; and S, the potential maximum retention of water by the soil, mm. The basin has been divided into eight smaller sub-basins in order to fulfill the requirement of SCS model. Thiessen polygon method was followed to get weighted average rainfall in the eight sub-basins. Visual interpretation technique was followed to prepare the landuse/land cover map of Krishna / Musi river basin using IRS LISS-II data on 1:50 000 scale. The whole catchment area falls under shallow and medium black soils, which fall under group-C of hydrologic soil group. The drainage map, Thiessen polygon map and the final interpreted map showing landuse/land cover of the basin were digitized and stored as thematic maps in vector format. These maps were then converted into raster maps. The spatial information
India
Andhra Pradesh
Study area 56k/12
Location M ap
N
E W
Table: 1 Runoff Curve Numbers for (AMC II) for the Indian Conditions
S.No Landuse Treatment/Practice Hydrologic condition
Hydrologic soil group
1 Cultivated
Straight row --- 76 86 90 93
Contour Poor 70 79 84 88
Good 65 75 82 86 Contour and
terraced
poor 66 74 80 82
Good 67 75 81 83
Bunded poor 59 69 76 79
Good 95 95 5 95
Paddy(rice) ----
2 Orchards
With under stony cover
---- 39 53 67 71
Without under stony cover
---- 41 55 69 73
3 Forest
Dense ---- 26 40 58 61
Open ---- 28 44 60 64
Shrubs 33 47 64 67
4 Pasture
---- Poor 68 79 86 89
Fair 49 69 79 84
Good 39 61 74 80
5 Wasted Land ---- ---- 71 80 85 88
6 Hard surface ---- ---- 77 86 91 93
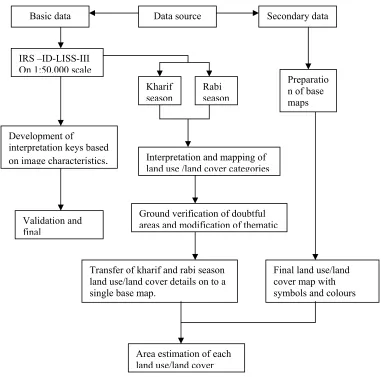
3.1.0 Methodology for land use/land cover mapping
Flowchart showing the Methodology adopted for land use/land cover mapping is given in Fig 2.0 . For analysis and interpretation two types of data are needed:
1. Basic data 2. Ground data
1. Basic data includes:
(a) Fused data of IRS-ID PAN and IRS-ID LISS-III satellite data (b) Toposheets
(c) Local knowledge
(d) Area map on any scale to transfer details (e) Reports and other literature of the study area
Ground data: Ground data is very much essential to verify and to increase the accuracy of the interpreted classes
and also to minimize the fieldwork
2. Data analysis: For analysis and interpretation of satellite data, the study can be divided into three parts:
A. Preliminary work B. Field work C.Post field work
A. Preliminary work includes:
i)..to see the limitation of satellite data ii).to lay down the criteria for land use classification to be adopted
iii). to fix the size of mapping units, which depends upon the scale iv). interpretation of different land Use/land cover classes
B.Field work:
i. Type of ground data to be collected ii) Selection of sample area for final classification
C.Post field work:
I. Reinterpretation or analysis or correction of doubtful areas ii) transfer of details on base map iii. Marginal information preparation of final land use/land cover map
Fig 2.0 Flowchart showing the Methodology adopted for land use/land cover mapping
Basic data Data source
IRS –ID-LISS-III On 1:50,000 scale
Kharif
season Rabi season
Preparatio n of base maps
Interpretation and mapping of land use /land cover categories
Ground verification of doubtful areas and modification of thematic
Transfer of kharif and rabi season land use/land cover details on to a single base map.
Area estimation of each land use/land cover
Final land use/land cover map with symbols and colours Development of
interpretation keys based on image characteristics
.
Validation and final
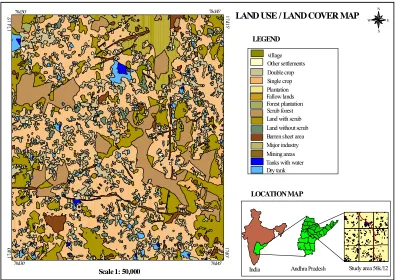
LOCATION MAP
N E W
S
LEGEND
India Andhra Pradesh
Scale 1: 50,000
Tanks with water Dry tank Major industry Single crop Double crop
Fallow lands Plantation Forest plantation Scrub forest
Barren sheet area Land with scrub Land without scrub
Mining areas village Other settlements
LAND USE / LAND COVER MAP
78d30'
17d 1
5' 78d45' 17d15'
17
d0'
78d45' 78d30'
17d0
'
Study area 56k/12
4.0 RESULTS AND DISCUSSIONS
In the present study, an attempt has been made to estimate the runoff volume due to the rainfall occurred in catchment area. Thus, the total volume of water flowing through Krishna River at the proposed dam site during the monsoon period, i.e., June 15 to October 15 resulting from daily rainfall in the upstream catchment area has been estimated using the SCS curve number method Hyderabad basin was divided into eight sub-basins such that the area of each sub-basin does not exceed 100 km2. Weights were assigned according to area of Thiessen polygons falling in each sub-basin and the weighted average daily rainfall was calculated for the eight sub-basins. Five landuse/land cover classes could be identified based on the colour, tone, texture, shape, size and association of the objects in the imagery. The landuse map is given in Figure3.0 and spatial distribution of landuse in each sub-basin is given in Table 2.0.
Table 2.0 Spatial distribution of landuse/land cover in study area
Landuse Sub-basin-wise Area, ha
Class # 1 # 2 # 3 # 4 # 5 #6 # 7 # 8 Total area
Wasteland 2.845 3.276 1.073 1.100 6.148 4.568 .773 6 6.577 29.360 Shrub 8.474 6.105 14.127 9.108 14.002 4.545 4.160 18.689 79.210 Open
forest 8.482 5.647 15.473 5.405 17.677 0.000 0.000 19.106 71.790 Good
crop 63.740 38.353 35.189 26.935 50.279 19.145 7.133 23.494 264.268 Poor crop 11.710 13.674 22.289 6.971 6.726 0.000 0.000 1.122 62.492 Total area 95.251 67.055 88.151 49.519 94.832 28.258 15.066 68.988 507.12
Table 3.0 Weighted average runoff curve number
Sub-basins in the Study area
CN for Hydrologic Soil Group – C and Moisture Condition
AMC –I AMC- II AMC-III
Sub-basin - 1 64 81 92
Sub-basin - 2 65 81 92
Sub-basin - 3 63 79 91
Sub-basin - 4 64 80 91
Sub-basin - 5 63 79 91
Sub-basin - 6 66 82 92
Sub-basin - 7 66 81 92
Sub-basin - 8 60 77 89
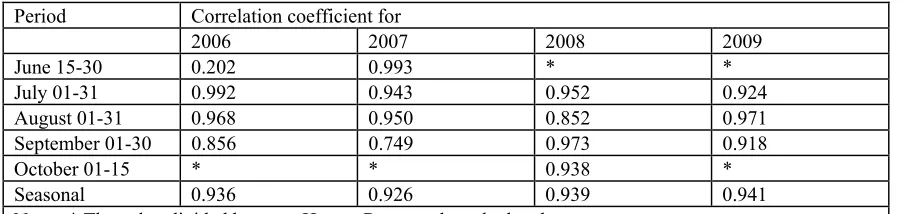
Table 4.0 Correlation between estimated and observed runoff
Period Correlation coefficient for
2006 2007 2008 2009
June 15-30 0.202 0.993 * *
July 01-31 0.992 0.943 0.952 0.924
August 01-31 0.968 0.950 0.852 0.971
September 01-30 0.856 0.749 0.973 0.918
October 01-15 * * 0.938 *
Seasonal 0.936 0.926 0.939 0.941
Note : * The value divided by zero. Hence, R cannot be calculated
5.0 CONCLUSIONS
2 Geographical information system arises as an efficient tool for the preparation of most of the input data required by the SCS curve number model;
3 The runoff estimated using SCS curve number model are comparable with the runoff measured by the conventional method; and
4
The analysis can be extended further to assess the impact of landuse changes after construction of the proposed dam on the rainfall-runoff relationshipREFERENCES
1. Baltas, E. A., Dervos, N. A., and Mimikou, M. A.: Technical Note: Determination of the SCS initial abstraction ratio in an experimental watershed in Greece, Hydrol. Earth Syst. Sci., 11.1825–1829, 2007
2. Brocca, L., Melone, F., and Moramarco, T.: On the estimation of antecedent wetness conditions in rainfall-runoff modelling, Hydrol. Process., 22(5), 629–642, 2008
3. C Chatterjee, R Jha, A K Lohani and R K Jaiswal. .Determination of SCS Curve Number and Landuse Changes for Hamidnagar Sub-basin of Punpun Basin, CS(AR) 14/96-97.. National Institute of Hydrology, Roorkee, 1997
4. Choi, J., Engel, B. A., and Chung, H. W.: Daily stream flow modeling and assessment based on the curve-number technique, Hydrol. Process. 16(16), 3131–3150, 2002.
5. Dingman, S. L.: Physical Hydrology Second Edition, Prentice-Hall, Inc., p. 409, 2002.
6. European Soil Bureau: Soil geographical database of Eurasia at scale 1:1000000 version beta 5 25/09/2001 and Pedotransfer Rules 2.0, Dominant surface textural class (infered), JRC,online: http://eusoils.jrc.ec.europa.eu/ESDB Archive/ESDBv2/fr thema.htm, 2004. 7. Geetha, K., Mishra, S. K., Eldho, T. I., Rastogi, A. K., and Pandey, R. P.: SCS-CN-based continuous simulation model for hydrologic
forecasting, Water Resource. Manag., 22(2), 165–190, 2008.
8. Hawkins, R. H.: Improved Prediction of Storm Runoff in Mountain Watersheds, J. Irrig. Drain.Div.-ASCE, 99, No. IR4, Proc. Paper, 10188, 519–523, 1973.
9. Hawkins, R. H.: Runoff curve numbers for partial area watersheds, J. Irrig. Drain. Div. ASCE,105(4), 375–389, 1979. 10. Handbook of Hydrology. .Soil Conservation Department.. Ministry of Agriculture, New Delhi, 1972.
11. Hawkins, R. H.: Asymptotic determination of runoff curve numbers from data, J. Irrig. Drain. 15 E.-ASCE, 119(2), 334–345, 1993.Hjelmfelt, A. T.: Investigation of curve number procedure, J. Hydraul. Eng.-ASCE, 117, 725–737, 1991.
12. P Balakrishnan. .Issues in Water Resources Development and Management and Role of Remote Sensing.. ISRO Publication, ISRO, Bangalore, 1986.