ANALYSIS OF FORCES, ROUGHNESS,
WEAR AND TEMPERATURE IN
TURNING CAST IRON USING
CRYOTREATED CARBIDE INSERTS
B.R. RAMJI*
Department of Manufacturing Science and Engineering, BMS College of Engineering, Bangalore,
H. N. NARASIMHA MURTHY
Department of Mechanical Engineering, R V College of Engineering, Bangalore, India
M. KRISHNA
Department of Mechanical Engineering, R V College of Engineering, Bangalore, India, Abstract
The aim of this research was to examine the effect of cryogenic treatment of the coated carbide inserts on their performance in turning gray cast iron work pieces. The cryogenic treatment cycle consisted of cooling the test samples from room temperature to cryogenic temperature of -178.9 C in three hours, soaking at cryogenic temperature around 24 hours and warming to room temperature in about five hours. Cutting forces, surface roughness, flank wear and tool tip temperature were studied for both coated and coated-treated inserts. ANOVA was performed to identify the effect of the parameters on the response variables. Cryogenically treated inserts proved superior to the non-treated in all the test conditions in terms of lesser flank wear of the inserts and reduced surface roughness of the specimens. The after turned inserts were examined using Scanning Electron Microscopy for studying the flank wear mechanism.
Keywords: Cryogenic , FEM, Taguchi, Surface Roughness, Flank wear, Tool Tip Temperature 1. Introduction
Cast iron has been used in large quantities for years because of the desirable properties such as good castability, good machinability and low cost. A wide variety of Gray Cast Iron is used in industries for various applications. Machinability of Cast Iron is affected by the amount of carbon in it [1]. High production machining of cast iron inherently generates high cutting zone temperatures. Such high temperatures cause dimensional deviations and premature failure of cutting tools. It also impairs the surface integrity of the product by inducing tensile residual stresses and surface and subsurface micro cracks in addition to rapid oxidation and corrosion [2, 3].
Cryogenic treatment of HSS tools has been widely studied. The mechanisms responsible for the improvement in properties of tool steel have also been well documented. Tungsten carbide is more efficient than HSS. But, the performance of cryogenically treated coated Tungsten carbide inserts has not been fully studied. While coatings are only superficial or surface treatment, the cryogenic treatment is applied to the whole volume of the material, reaching the core of the tools, which ensures their stable properties even after regrinding or resharpening [4].
Effect of cryogenic treatment on cutting performance is a not stable for all machining applications and cutting conditions. The results reported in open literature on this area are diverse and contradictory. The main objective of this research was to critically examine the performance of cryogenic treatment of coated and non-coated carbide tool inserts in turning gray cast iron by selecting parameters such as tool wear, tool tip temperature, surface roughness of the work piece and cutting forces Liquid nitrogen was selectively applied to the chip and the tool rake face in well-controlled jet. Finite element analysis showed that this cooling approach can bring the chip temperature down to the embrittlement temperature for the material, −55°C. Consequently, it expands the chip-breaking range of feed and cutting speed, with a reduced chip–tool interface temperature and increased tool life [8].
2. Experimental Investigation
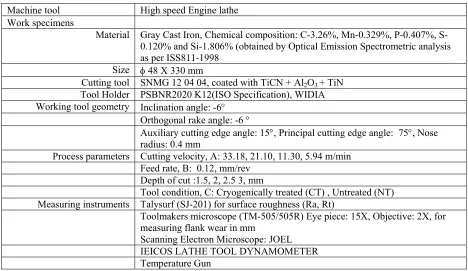
Machine tool High speed Engine lathe Work specimens
Material Gray Cast Iron, Chemical composition: C-3.26%, Mn-0.329%, P-0.407%, S-0.120% and Si-1.806% (obtained by Optical Emission Spectrometric analysis as per ISS811-1998
Size 48 X 330 mm
Cutting tool SNMG 12 04 04, coated with TiCN + Al2O3 + TiN
Tool Holder PSBNR2020 K12(ISO Specification), WIDIA Working tool geometry Inclination angle: -6
Orthogonal rake angle: -6
Auxiliary cutting edge angle: 15, Principal cutting edge angle: 75, Nose radius: 0.4 mm
Process parameters Cutting velocity, A: 33.18, 21.10, 11.30, 5.94 m/min Feed rate, B: 0.12, mm/rev
Depth of cut :1.5, 2, 2.5 3, mm
Tool condition, C: Cryogenically treated (CT) , Untreated (NT) Measuring instruments Talysurf (SJ-201) for surface roughness (Ra, Rt)
Toolmakers microscope (TM-505/505R) Eye piece: 15X, Objective: 2X, for measuring flank wear in mm
Scanning Electron Microscope: JOEL IEICOS LATHE TOOL DYNAMOMETER Temperature Gun
Table 1 Experimental Conditions
The details of the turning experimental conditions are presented in Table 1. The carbide inserts were coated with micro column TiCN+Al2O3+TiN using chemical vapour deposition technique. TiCN improves the fracture
resistance, Al2O3 provides high temperature stability and crater wear resistance and TiN provides surface
smoothness and welding resistance.
The cryogenic treatment involved cooling the inserts from room temperature to cryogenic temperature (-178.9 C) in 3 hours, soaking at this temperature for 24 hours and warming to room temperature in 5 hours in accordance with Yong et al[9]. Turning exercises were undertaken for each experimental condition for duration of 10 minutes to maintain uniformity.
2.1 Design of experiments
The experimental layout was developed based on Taguchi’s Orthogonal Array Experimentation Technique. An L32
Orthogonal Array Experimental layout was selected to satisfy the minimum number of experiments condition for the factors and levels presented in Table 2.
A Dept of cut 4 3
B Cutting velocity 4 3
C Tool condition 2 1
A X B Interaction 3 X 3 9
Total degrees of freedom 16
Minimum number of Experiments 17
Table 2 Factors, levels and degrees of freedom
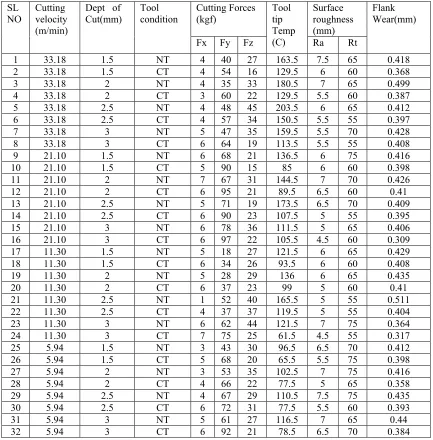
The physical lay-out and the responses according to L32 Orthogonal Array Lay-out are presented in Table 3, for all
the four response factors namely, cutting forces, tool tip temperature, surface roughness and flank wear. SL
NO Cutting velocity (m/min)
Dept of
Cut(mm) Tool condition Cutting Forces (kgf) Tool tip Temp (C) Surface roughness (mm) Flank Wear(mm)
Fx Fy Fz Ra Rt
1 33.18 1.5 NT 4 40 27 163.5 7.5 65 0.418
2 33.18 1.5 CT 4 54 16 129.5 6 60 0.368
3 33.18 2 NT 4 35 33 180.5 7 65 0.499
4 33.18 2 CT 3 60 22 129.5 5.5 60 0.387
5 33.18 2.5 NT 4 48 45 203.5 6 65 0.412
6 33.18 2.5 CT 4 57 34 150.5 5.5 55 0.397
7 33.18 3 NT 5 47 35 159.5 5.5 70 0.428
8 33.18 3 CT 6 64 19 113.5 5.5 55 0.408
9 21.10 1.5 NT 6 68 21 136.5 6 75 0.416
10 21.10 1.5 CT 5 90 15 85 6 60 0.398
11 21.10 2 NT 7 67 31 144.5 7 70 0.426
12 21.10 2 CT 6 95 21 89.5 6.5 60 0.41
13 21.10 2.5 NT 5 71 19 173.5 6.5 70 0.409
14 21.10 2.5 CT 6 90 23 107.5 5 55 0.395
15 21.10 3 NT 6 78 36 111.5 5 65 0.406
16 21.10 3 CT 6 97 22 105.5 4.5 60 0.309
17 11.30 1.5 NT 5 18 27 121.5 6 65 0.429
18 11.30 1.5 CT 6 34 26 93.5 6 60 0.408
19 11.30 2 NT 5 28 29 136 6 65 0.435
20 11.30 2 CT 6 37 23 99 5 60 0.41
21 11.30 2.5 NT 1 52 40 165.5 5 55 0.511
22 11.30 2.5 CT 4 37 37 119.5 5 55 0.404
23 11.30 3 NT 6 62 44 121.5 7 75 0.364
24 11.30 3 CT 7 75 25 61.5 4.5 55 0.317
25 5.94 1.5 NT 3 43 30 96.5 6.5 70 0.412
26 5.94 1.5 CT 5 68 20 65.5 5.5 75 0.398
27 5.94 2 NT 3 53 35 102.5 7 75 0.416
28 5.94 2 CT 4 66 22 77.5 5 65 0.358
29 5.94 2.5 NT 4 67 29 110.5 7.5 75 0.435
30 5.94 2.5 CT 6 72 31 77.5 5.5 60 0.393
31 5.94 3 NT 5 61 27 116.5 7 65 0.44
32 5.94 3 CT 6 92 21 78.5 6.5 70 0.384
Table 3. Experimental layout
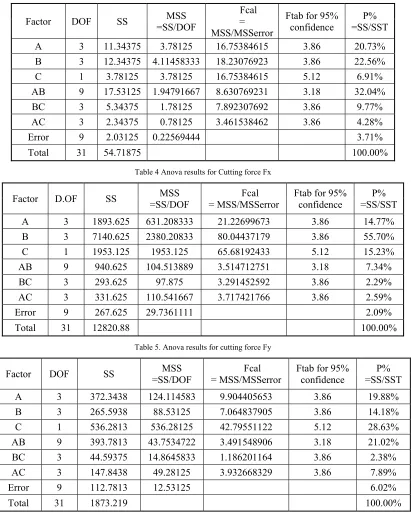
The analysis of variance based on the responses obtained in the turning exercises is presented in Table 4 -10 for Fx, Fy Fz, tool tip temperature, surface roughness and Flank wear respectively.
Factor DOF SS =SS/DOF MSS
Fcal = MSS/MSSerror
Ftab for 95%
confidence =SS/SST P% A 3 11.34375 3.78125 16.75384615 3.86 20.73% B 3 12.34375 4.11458333 18.23076923 3.86 22.56%
C 1 3.78125 3.78125 16.75384615 5.12 6.91%
AB 9 17.53125 1.94791667 8.630769231 3.18 32.04% BC 3 5.34375 1.78125 7.892307692 3.86 9.77% AC 3 2.34375 0.78125 3.461538462 3.86 4.28%
Error 9 2.03125 0.22569444 3.71%
Total 31 54.71875 100.00%
Table 4 Anova results for Cutting force Fx
Factor D.OF SS =SS/DOF MSS = MSS/MSSerror Fcal Ftab for 95% confidence =SS/SST P% A 3 1893.625 631.208333 21.22699673 3.86 14.77% B 3 7140.625 2380.20833 80.04437179 3.86 55.70%
C 1 1953.125 1953.125 65.68192433 5.12 15.23%
AB 9 940.625 104.513889 3.514712751 3.18 7.34% BC 3 293.625 97.875 3.291452592 3.86 2.29% AC 3 331.625 110.541667 3.717421766 3.86 2.59%
Error 9 267.625 29.7361111 2.09%
Total 31 12820.88 100.00%
Table 5. Anova results for cutting force Fy
Factor DOF SS =SS/DOF MSS = MSS/MSSerror Fcal Ftab for 95% confidence =SS/SST P% A 3 372.3438 124.114583 9.904405653 3.86 19.88%
B 3 265.5938 88.53125 7.064837905 3.86 14.18%
C 1 536.2813 536.28125 42.79551122 5.12 28.63% AB 9 393.7813 43.7534722 3.491548906 3.18 21.02% BC 3 44.59375 14.8645833 1.186201164 3.86 2.38%
AC 3 147.8438 49.28125 3.932668329 3.86 7.89%
Error 9 112.7813 12.53125 6.02%
Total 31 1873.219 100.00%
Table 6. Anova results for Cutting force Fz
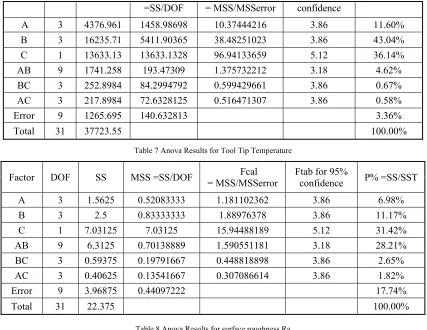
=SS/DOF = MSS/MSSerror confidence
A 3 4376.961 1458.98698 10.37444216 3.86 11.60% B 3 16235.71 5411.90365 38.48251023 3.86 43.04% C 1 13633.13 13633.1328 96.94133659 5.12 36.14% AB 9 1741.258 193.47309 1.375732212 3.18 4.62% BC 3 252.8984 84.2994792 0.599429661 3.86 0.67% AC 3 217.8984 72.6328125 0.516471307 3.86 0.58%
Error 9 1265.695 140.632813 3.36%
Total 31 37723.55 100.00%
Table 7 Anova Results for Tool Tip Temperature
Factor DOF SS MSS =SS/DOF = MSS/MSSerror Fcal Ftab for 95% confidence P% =SS/SST
A 3 1.5625 0.52083333 1.181102362 3.86 6.98%
B 3 2.5 0.83333333 1.88976378 3.86 11.17%
C 1 7.03125 7.03125 15.94488189 5.12 31.42%
AB 9 6.3125 0.70138889 1.590551181 3.18 28.21%
BC 3 0.59375 0.19791667 0.448818898 3.86 2.65% AC 3 0.40625 0.13541667 0.307086614 3.86 1.82%
Error 9 3.96875 0.44097222 17.74%
Total 31 22.375 100.00%
Table 8 Anova Results for surface roughness Ra
Factor DOF SS MSS =SS/DOF = MSS/MSSerror Fcal Ftab for 95% confidence =SS/SST P%
A 3 108.5938 36.1979167 1.039900249 3.86 7.73%
B 3 327.3438 109.114583 3.134663342 3.86 23.29%
C 1 488.2813 488.28125 14.02743142 5.12 34.74%
AB 9 82.03125 9.11458333 0.261845387 3.18 5.84%
BC 3 58.59375 19.53125 0.561097257 3.86 4.17%
AC 3 27.34375 9.11458333 0.261845387 3.86 1.95%
Error 9 313.2813 34.8090278 22.29%
Total 31 1405.469 100.00%
Table 9 Anova Results for surface roughness Rt
=SS/DOF = MSS/MSSerror confidence =SS/SST
A 3 0.007145 0.00238175 2.909501188 3.86 14.71%
B 3 0.001504 0.00050125 0.612317611 3.86 3.10%
C 1 0.015842 0.015842 19.35229046 5.12 32.61%
AB 9 0.01541 0.00171222 2.091618595 3.18 31.72%
BC 3 0.00025 8.325E-05 0.101696641 3.86 0.51%
AC 3 0.00106 0.00035325 0.431523583 3.86 2.18%
Error 9 0.007368 0.00081861 15.17%
Total 31 0.048578 100.00%
Table 10. Anova Results for Flank Wear
3.0 SEM (Scanning Electron Microscope)
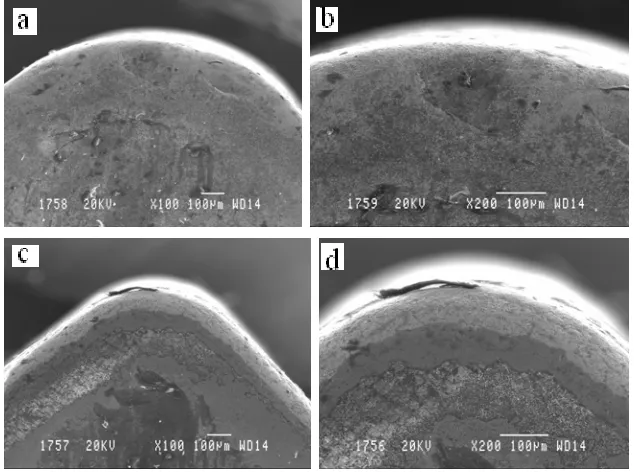
Figure 1 shows the scanning electron micrographs of worn out turning inserts used for machining gray cast iron work pieces for 40 minutes under cryogenically treated and non-treated conditions. The main cutting edge of the untreated insert was found to suffer from chipping as shown in the micrographs. Cryogenic treatment hardened the inserts and increased their brittleness. The non treated inserts showed greater crater wear than the cryogenically treated inserts. The lesser wear in treated inserts was attributed to the chemical inertness of alumina and TiCN.
Fig 1 SEM of tool inserts after turning a) and b) cryogenically treated, c) and d) Non- treated conditions
4.0 Finite Element Analysis for Tool Tip Temperature
flow into the material during the simulation of the cutting process. Table 11 shows the material properties used for the FEA.
Table 11 Tungsten Carbide Material properties used for FEA
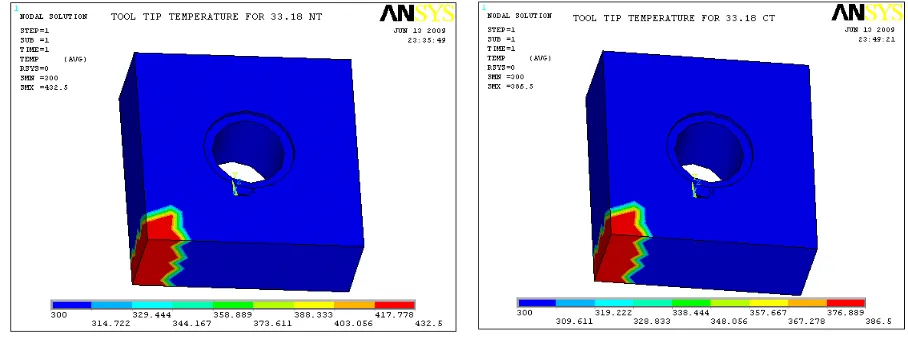
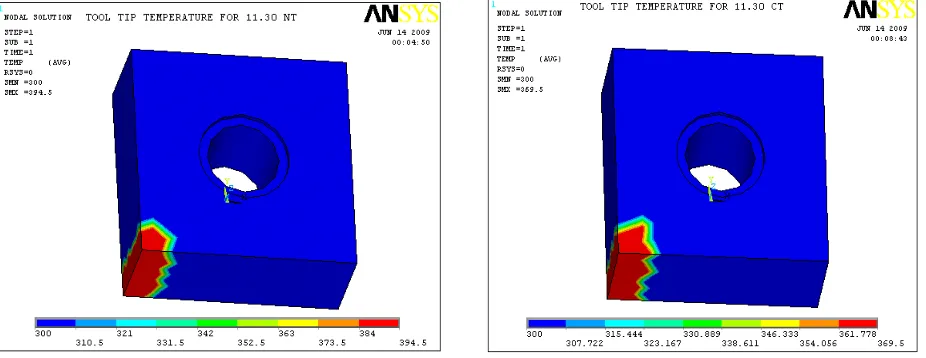
The experimental values of the tool tip temperature were considered as loads. Temperature was applied on the tool tip. Fig 2-5 show the FEA results of the temperature profiles for different cutting velocities and the two tool conditions.
Fig 2 FE results of tool tip temperature for cutting velocity: 33.18 mm/rev and Tool conditions
Property value
Density 12000 kg/m3
Modulus of Elasticity 0.06205 Mpa Compressive Strength 3998.96 Mpa
Poisson’s Ratio 0.24
Volume Resistivity 2.5 x 10⁻⁸ ohm-cm2
Coefficient of Thermal Expansion 6.0 x 10⁻⁶/°C
Fig 3 FE results of tool tip temperature for cutting velocity: 21.10 mm/rev and tool conditions
Fig 4 FE results of tool tip temperature for cutting velocity: 5.94 mm/rev and tool conditions
Fig 5 FE results of tool tip temperature for cutting velocity: 11.30 mm/rev and tool conditions
The ANOVA indicated that cryogenic treatment significantly influenced Fz, tool tip temperature; surface roughness and flank wear to the extent of 28 %, 36 %, 32% and 34 % respectively. Both feed and tool condition influenced tool tip temperature to the extents of 43 % and 36 % respectively. The heat generated during turning also affects tool life. At higher speeds the sliding distance of cutting tool increases for a given time. Also, greater amount of heat is generated at higher speeds. The combined effect of these increases wear and the plastic deformation of the cutting edge. The temperature was greatest i.e. 432.5 ºC for NT and 386.5 ºC for CT, at the tool tip for feed 0.12 mm/rev, cutting velocity 33.18 m/min and depth of cut of 3 mm. Increase in cutting velocity and dept of cut cause corresponding increase in temperature due to the greater amount of heat generation leading to greater amount of flank wear. Lesser the tool tip temperature greater the tool life due to lesser tool wear in case of treated inserts. 6.0 Conclusions
This research work was carried out in order to study the effect of cryogenic treatment of carbide inserts on cutting forces, tool tip temperature, surface roughness and flank wear of the tool.
Force Fx remained approximately same through the experiment, were as Fy values varied with variation in cutting velocity, Feed and dept of cut. The temperature increased with increase in machining time, cutting velocity and dept of cut. The surface roughness and flank wear also increased with increase in the velocity and depth of cut.
ANOVA indicated that cryogenic treatment on carbide inserts was the only factor that influenced more, cutting velocity influenced tool tip temperature and cutting forces where as depth of cut affected mainly on flank wear and surface roughness.
FE Analysis showed that the maximum temperature was found near the tool tip and decreased gradually towards the face of tool.
Cryogenic treatment of the cutting inserts proved better than the non-treated ones in terms of less flank wear and better surface finish of cast iron specimens.
References
[1] Reed R.P. and Clark A.F Materials at low temperatures, American society for metals, Carnes publication, Metal park OH (1983). [2] P. Leskover and J. Grum, The metallurgical aspect of machining, Annals ofCIRP, 35 (1):537–550 (1986).
[3] H. K. Tonshoff and E. Brinkomeier, Determination of the mechanical and thermal influences on machined surface by microhardness and residual stress analysis,Annals of CIRP,29 (2): 519–532 (1986)
[4] Flavio J. da Silva, Sinesio D. Franco, Performance of cryogenically treated HSS tools, WEAR 261(5): 674-685(2006)
[5] D. M. Lal, S. Renganarayana, A. Kalanidhi, Cryogenic treatment to augument wear resistence of tool and die steels, Cryogenics 41:149-155(2001).
[6] K.W.H. Seha, M. Rahaman and K. H. Young, Performance evaluation of cryogenically treated tungsten carbide cutting tool inserts, Proceedings of the Insitution of Mehanical Engineers Part B Journal of Engineering Manufacture 217: 29-43.(2003).
[7] W. E. Bryson, Cryogenics, Hanser Garden Publications, Cincinnati, OH 81-107(1999).
[8] Shane Y. Hong, and Y. Ding Micro-temperature manipulation in cryogenic machining of low carbon steel Journal of material processing
technology Volume 116,Issue 1,22-30 2001