R E S E A R C H A R T I C L E
Open Access
Final height and body mass index in adult
survivors of childhood acute lymphoblastic
leukemia treated without cranial radiotherapy: a
retrospective longitudinal multicenter Italian study
Patrizia Bruzzi
1, Barbara Predieri
1, Andrea Corrias
2, Alberto Marsciani
3, Maria Elisabeth Street
4, Aurora Rossidivita
5,
Paolo Paolucci
1and Lorenzo Iughetti
1*Abstract
Background:Young adult survivors of childhood acute lymphoblastic leukemia (ALL) treated with protocols including cranial radiotherapy demonstrate a persistent weight gain and reduced final height. Published reports on the effects on growth of different oncologic therapies are conflicting and difficult to interpret because they combined children treated with both cranial irradiation and multi-agent chemotherapy. Our study investigated the effect of chemotherapy alone on body mass index (BMI) and on growth at the achievement of final height in a homogeneous cohort of Italian childhood ALL survivors.
Methods:We retrospectively studied 162 Caucasian patients treated on the Italian Association of Pediatric
Hematology and Oncology protocols without radiotherapy between 1989 and 2000 at five Italian centers with 107 inclusions (58 males). Height- and BMI-standard deviation score (SDS) were collected at diagnosis of ALL, at the end of treatment and at the achievement of final height. Changes in height SDS and BMI SDS with time were analyzed using dependent sample Student's t-test.
Results:A significant reduction of height-SDS was documented during treatment in both genders. This reduction of height-SDS was not followed by an appropriate catch-up growth, despite the achievement of a mean final height within the normal range. At diagnosis females showed a lower mean BMI-SDS than males. During treatment, in the whole population, BMI-SDS increased significantly. After it, while males lost BMI-SDS, females showed its persistent increase.
Conclusions:Survivors of childhood ALL generally seemed to achieve a normal final height with a BMI within the normal range. These parameters appeared to be only minimally affected by chemotherapy. Nevertheless, height catch-up growth was not completed after chemotherapy in both genders and all patients experienced an increase of BMI-SDS during chemotherapy that only females seemed to conserve until the achievement of final height.
* Correspondence:iughetti.lorenzo@unimore.it
1Pediatric Unit, Department of Medical and Surgical Sciences for Mothers,
Children and Adults, University of Modena & Reggio Emilia, Via del Pozzo, 71, 41124 Modena, Italy
Full list of author information is available at the end of the article
Background
Acute lymphoblastic leukemia (ALL) is the most common malignancy in children and represents 80% of all leukemia cases [1]. Recent progress in risk-adapted treatment for childhood ALL has secured eight-year event-free survival rates of approximately 90% [2-4]. Consequently, the late side-effects of the cancer treatment have obtained an increased attention and the long-term monitoring of sur-vivors has become an important part of their overall health care [5]. Treatment of ALL during childhood is as-sociated with final height deficit. Young age at diagnosis and radiotherapy are considered the major risk factors [6]. Moreover, adult survivors of childhood ALL have a four-fold excess risk of mortality from cardiovascular disease. Obesity seems highly prevalent among female and survi-vors treated with radiotherapy [7].
Nowadays, ALL survivors form the largest group of long-term survivors from childhood cancer, even if they are a heterogeneous group considering therapeutic proto-cols. In last decades, in most of them, cranial radiotherapy has been replaced by intrathecal chemotherapy, as stand-ard central nervous system prophylaxis and treatment, and a reduced percentage of children have received cranial ra-diation [8] with a consequent reduction of sequelae related to this treatment modality. However, it has been suggested that also chemotherapy can negatively affect growth and endocrine functions [9,10]. Published reports on the effects on growth of these therapies are conflicting and difficult to interpret because most studies have analyzed growth in children treated with both cranial irradiation and combin-ation chemotherapy and disentangling the adverse contri-bution of these two major therapeutic modalities has proved tricky [11-13].
To evaluate the impact on growth, we performed a retrospective multicenter study in a large pediatric ALL population treated without radiotherapy, followed until the achievement of final height.
Methods
Design and setting
This study was a longitudinal, retrospective and multi-center study: we reviewed the clinical notes of patients treated for ALL at five Italian pediatric oncologic centers (Modena, Turin, Rome, Rimini and Parma) on Italian Association of Pediatric Hematology and On-cology (AIEOP) protocols, without radiotherapy, from 1989 to 2000, and followed until the achievement of adult height. Inclusion criteria comprised the success-ful completion of the treatment (standard risk proto-cols) and a continued first remission. Exclusion criteria included: relapse, exposure to radiotherapy and/or bone marrow transplant, the presence of other diseases potentially influencing growth (i.e. Down’s syndrome, neurofibromatosis type 1) and of chronic treatment
with any other medication apart from the AIEOP protocols which might affect growth (i.e. growth hormone therapy, sex steroid) and lack of complete auxological data. Details concerning ALL treatment protocols were published else-where [14] and summarized in Table 1.
Provincial Ethical Committee approved the protocol study (practice 185/11).
Data collection
Age, height and weight at diagnosis of ALL (sT), at the end of treatment (EoT), and at final height (FH) were extracted from the record of each eligible patient. Uniformly, in every center, height was measured to the nearest 0.1-cm with a wall-mounted stadiometer (Harpenden, Crymych; UK); body weight was measured to the nearest 0.1-kg and body mass index (BMI) was obtained from the weight in kg/ height in meters squared and expressed as standard deviation-score (SD-S) with respect to chronological age. The auxological instruments were routinely checked and calibrated. Height- and BMI- SDS were calculated for each value using age- and sex- specific World Health Organization (WHO) growth chart 2007 [15]. Parental height was also collected to estimate target height (TH), calculated according to the formula: [(mother’s height +13) + father’s height]/2 in males and [(mother’s height - 13) + father’s height]/2 in females [16]. Final height (FH) was defined as the standing height achieved when the linear growth velocity during the preceding year was less than 1 cm/year.
For each participant, demographic and therapeutic information was obtained, including gender, ethnicity, diagnostic white cell count (WBC) at sT and treatment modalities.
Data analysis
All results, apart from ages expressed by median, were reported as the mean ± SD. Parametric statistical analysis (STATISTICA™ software, StatSoft Inc., Tulsa, OK, USA) was performed using dependent sample Student’s t-test to detect mean changes in height SDS and BMI SDS from diagnosis of ALL to final height.
Data were also analyzed according to gender and to groups of age (younger or older than four years at diagnosis). Independent t-test was performed to detect differences between groups. Gender, WBC, age at diag-nosis, height at diagnosis and BMI at diagdiag-nosis, genetic target height were analyzed in a univariate regression model with final height SDS as dependent variable through Pearson’s correlation. Potential predictors of final height SDS and BMI SDS at FH were analyzed by multivariate regression models.
Results
Of 162 Caucasian patients treated on AIEOP ALL87, 88, 91, 95 and 2000 protocols without radiotherapy from 1989 to 2000, 107 met inclusion criteria. Causes of exclusion enclosed: relapse (7.4% of initial population), exposure to radiotherapy (6.7%) and lack of data (19.7%). None was
excluded because of the presence of other diseases or of other chronic treatment potentially influencing growth. Only auxological parameters at sT were available in the 32 non-participants patients excluded because of lacking data. No statistical differences were detected between included and excluded patients among available variables (Table 2).
Table 1 Characteristics of treatment protocols
Protocols 87 8801 8802 8805 9101 9102 9501–9502 armA 9502 armB 2000
PDN 2500 1830 1830 150 2030 1970 1970 1620 1910
VCR 20.5 9 12 9 12 12 12 15 18
DNM 180 160 160 - 120 120 - 120 120
MTX IT ٧ ٧ ٧ ٧ ٧ ٧ ٧ ٧ ٧
L-ASP 5400 80000 80000 - 80000 80000 120000 120000 80000
6-MP 6000 29920 25900 - 5100 28920 27350 6710 6830
MTX IV 180 1540 1500 30 1488 1500 1488 1500 1500
CPM - 2000 3000 1600 1000 3000 1000 3000 2500
DESA - 189 249 300 249 249 261 297 409
6-TG - 900 900 - 840 840 780 780 780
ARA-C - 600 600 900 600 1800 600 1600 600-1800
IFO - - - 12000 - - - -
-VM-26 - - - 600 - - - -
-ADM - 60 120 150 120 120 120 120 60-120
Num. patients exposed 2 1 2 4 5 28 2 57 6
Legend: Drugs are expressed as cumulative dose (mg/mq). PDN, prednisolone; VCR, vincristine; DNM, daunorubicin; MTX, metotrexate; IT, intrathecal;٧included; L-ASP; L-asparaginase (UI/mq); 6-MP, 6-mercatopurine; IV, intravenously; CPM, cyclophosphamide; DESA, dexamethasone; 6-TG, 6-thioguanine; ARA-C, cytosine arabinoside.; IFO, ifosfamide; VM-26,teniposide; ADM, adriamycin.
Table 2 Meadian age (years; range); Height-SDS (media ± SDS); Height-SDS adjusted according to target height (media ± SDS) and BMI-SDS (media ± SDS) in study population and non-participants and according to gender from sT to FH
Total participant population
Participants males (58 pts)
Participant females (49 pts)
Non-participans males (17 pts)
Non-participans females (15 pts)
Meadian age
sT 5.57 (1.20–13.73) 5.93 (1.31–12.85) 5.15 (1.20–13.73) 5.84 (1.15–12.74) 5.12 (1.14–13.45)
EoT 7.60 (3.0–15.98) 7.97 (3.23–14.97) 7.16 (3.0–15.98) / /
FH 17.52 (14.05–23.98) 17.68 (14.05–23.98) 17 · 24 (14.05- 23.7) / /
Height-SDS
sT 0.61 ± 1.04 0.62 ± 1.05 0.60 ± 1.05 0.60 ± 1.02 0.62 ± 1.09
EoT 0.25 ± 1.08 (0.000) 0.30 ± 1.09 (0.003) 0.19 ± 1.09 (0.000) / /
FH 0.18 ± 1.13 (0.000) 0.27 ± 1.03 (0.013) 0.07 ± 1.25 (0.000) / /
Height-SDS adjusted TH
sT 0.45 ± 1.22 0.51 ± 1.38 0.38 ± 1.22 / /
EoT 0.04 ± 1.2 (0.000) 0.18 ± 1.36 (0.043) -0.12 ± 1.11 (0.000) / /
FH 0.15 ± 1.20 (0.000) 0.37 ± 1.23 -0.13 ± 1.11 (0.022) / /
BMI-SDS
sT 0.15 ± 1.32 0.39 ± 1.30 -0.12 ± 1.31† 0.35 ± 1.24 -0.09 ± 1.20
EoT 0.58 ± 1.34 (0.000) 0.82 ± 1.29 (0.010) 0.29 ± 1.36 (0.015)† / /
FH 0.51 ± 1.03 (0.010) 0.49 ± 1.09 0.54 ± 0.96 (0.001) / /
Demographic data of participants and non-participants are shown in Table 2.
Among participants, there was no significant difference between male and female groups in age. The median time from diagnosis to assessment of FH was 11.90 ± 3.26 years (range 4.23 -18.46).
Table 2 lists anthropometric data over time.
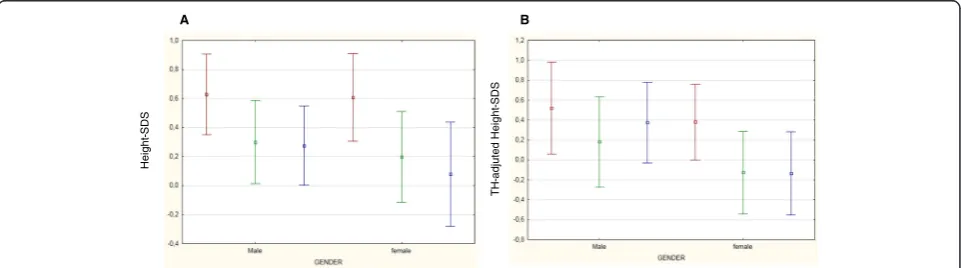
At every step-time, both males and females had a mean height- and BMI-SDS within the normal range (Figures 1 and 2). At sT, children appeared generally well-nourished, showing a mean SDS of + 0.61 for height and +0.15 for BMI. Only one girl presented a height-SDS less than -2 SD, but appropriate for her TH SDS (corre-sponding to -2.70 SD). Analyzing BMI SDS distribution at sT, 7 children were thin (BMI SDS less than -2 SD) and the same number were obese (BMI SDS more than +2 SD).
Changes with time in height-SDS
In the whole population, a significant reduction of height-SDS was documented during treatment (from sT to EoT) in both genders (Table 2). This reduction of height-SDS was not followed by an appropriate catch-up growth (Figure 1). In fact, after the end of chemother-apy, height-SDS further decreased both in females and in males.
TH-SDS was 0.02 ± 1.10 SDS in the whole group, -0.08 ± 0.79 SDS in males and 0.16 ± 1.40 in females. At sT, height-SDS adjusted according to TH was higher than at EoT and at FH (Table 2). The discrepancy in height-SDS
from TH-SDS reduced over time (TH SDS – sT SDSvs
TH SDS–FH SDS: -0.59vs.-0.16; -0.70vs.-0.35; -0.44 vs. -0.09 in the whole population, males and females; respectively). Only females achieved a FH SDS signifi-cantly reduced than data at sT (Table 2).
In the whole population FH-SDS correlated with height-SDS at sT (Figure 3A) and TH-SDS (Figure 3B).
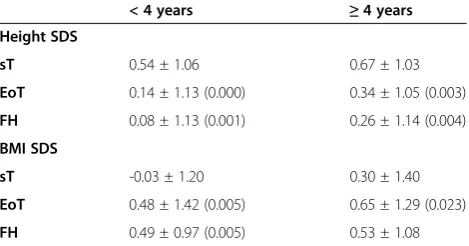
Changes with time in BMI-SDS
As far as BMI-SDS is concerned, at diagnosis females showed a lower mean BMI-SDS than males (Table 2). During follow-up, in the whole population, BMI-SDS increased significantly both during treatment and after it until the achievement of FH. After the end of chemo-therapy the variation in BMI SDS significantly differed
between males and females (BMI SDS FH – BMI SDS
EoT: -0.32 ± 1.23 vs. 0.24 ± 1.34 SDS, respectively, p 0 · 023): males decreased significantly their BMI-SDS (FH vs. EoT: p 0.047), whereas females demonstrated no improvement in BMI SDS (FH vs. EoT: p 0.210) (Figure 2). Therefore, at FH only females showed a significant increase of BMI-SDS than at sT (Table 2).
Age of exposure to chemotherapy
According to age, 47 children were younger than four years at diagnosis of ALL (median age 3.06; range 1.20– 3.89 years). Other 60 presented at sT a median age of 7.79 years (range 4.15–13.73 years). There was no signifi-cant difference between groups in sex distribution. During chemotherapy, a significant reduction of height-SDS was registered in both groups and it still persisted at FH (Table 3). BMI-SDS increased significantly from sT to EoT in both group, but it was still increased in comparison to the previous at sT only among children exposed to chemotherapy at a younger age (Table 3).
Multiple regression analysis
Multiple regression analysis identified TH and height SDS at sT as independent predictive factors for FH (coeff. 0.04, SE 0.02; coeff. 0.46, SE 0.12, respectively). Height SDS together with BMI SDS at sT was also identified as independent predictive factors for final BMI SDS (coeff. 0.30, SE 0.11; coeff. 0.41, SE 0.12, respectively).
A B
Height
-SDS
T
H
-a
djuted Height
-S
DS
Discussion
According to our knowledge, this is the first study examining long-term growth outcomes in a wide cohort of un-irradiated Italian survivors from childhood ALL.
Changes with time in height-SDS
Growth impairment has already been reported as a fre-quent complication of the treatment of ALL [17]. Patients treated when younger than four years and who received cranial irradiation seem to be the more affected [18,19]. Nevertheless, a variety of other factors can contribute to growth impairment, including decreased nutritional intake, psychosocial dysfunction, chemotherapy and ster-oid therapy [20]. Data on long-term growth in children treated with chemotherapy alone are scarce and discord-ant [9,12,13,18,21-26].
Our data demonstrate that chemotherapy minimally af-fected final height, confirming some short-term previous published findings [18,24,25,27]. In 2013, Vandecruys and colleagues described the longitudinal growth of 67 adult survivors of childhood ALL, treated from 1983 to 1989 according to European Organization for Research and Treatment of Cancer 58831/2 protocols with chemother-apy as the only treatment modality, and demonstrated a decrease in FH SDS from the time of diagnosis of -0.53 SDS in the standard-risk ALL group (45 patients) and of -0.73 SDS in the medium- or high-risk survivors (22 patients) [26]. In our study, survivors showed at FH a significant mean height loss of – 0.42 SDS (p 0 .000) compared to height SDS at diagnosis and, analyzing height-SDS adjusted according to TH, the loss in SDS from sT to FH still persisted (-0.30; p 0.000). Differ-ences could be due to the inclusion in our study of a
BMI
-SDS
Figure 2Mean BMI-SDS changes with time in both gender.Legend: Data at diagnosis of ALL (sT) are colored in red. Data at the end of treatment (EoT) are colored in green. Data at final height (FH) are colored in blue.
A B
FH SDS
Height SDS at sT TH
FH SDS
larger number of survivors treated on more recent chemo-therapy protocols. The damage induced by chemochemo-therapy could impede a complete catch-up growth, even if our survivors reached a FH within the normality. In fact, only TH and height-SDS at sT directly correlated with FH and they were both identified as independent predictive factors for FH in the multiple regression analysis, demonstrating than genetic potentiality together with growth pattern be-fore ALL still remain the two main factors influencing FH. In irradiated population, girls typically experienced greater growth impairment than boys [11,28]. Also in our study, analyzing data adjusted according to TH, only females showed a significant persistent reduction of height-SDS data, while males seemed to partially catch up after the end of chemotherapy. Because of the retro-spective design of our study and the lack of a description of pubertal data, we could only hypothesized that it is possibly due to the early occurrence of puberty in female survivors of childhood ALL but not in males, as already described in literature [29,30].
How chemotherapy can affect growth is still unclear, even because hypothalamic-pituitary cells together with liver and chondrocyte do not have a high multiplicative capacity and, therefore, they have not usually been con-sidered vulnerable to the action of chemotherapeutic agents. A reduction of growth hormone (GH) secretion induced by chemotherapy could be supposed. Rose and colleagues documented a hypothalamic-pituitary abnor-mality after chemotherapy in 83% of 18 hematological malignancy survivors (17 ALL) who were referred to their Clinic because of slow growth [31]. GH deficiency developed in 9 survivors. Even if this report did not rep-resent a study of prevalence, authors hypothesized that chemotherapy alone may affect hypothalamic neurons through the loss of hypothalamic releasing or inhibitory hormone functions or through an altered processing of pituitary hormone. Host factors which might be associ-ated with greater susceptibility to chemotherapy could be considered contributing factors [31]. On the contrary, Vandecruys and colleagues evaluated GH status in their
population through glucagon stimulation test at the end of chemotherapy. In the 28% of cases, they demonstrated a decrease of GH secretion. This biochemical status did not correlate with the reduction in height SDS from diagnosis or end of treatment to FH [26]. Moreover, pa-tients with an altered peak GH level at the end of chemotherapy were retested at the onset of puberty and demonstrated a normalized response to the GH stimula-tion test [26]. In older studies, a condistimula-tion of GH-deficiency requiring GH replacement therapy has re-ported prevalence of 0.9 and 1.2% of childhood survivors of ALL treated with chemotherapy alone [32,33]. In our study, data were collected retrospectively and we did not investigate GH secretion in our population. Neverthe-less, the demonstration of limited growth during chemo-therapy could support the hypothesis that GH secretion could be directly and acutely altered by chemotherapeu-tic agents and that, in acute phases, both ALL and its treatment can caused severe catabolic effects in children, leading to increasing protein breakdown and reducing protein synthesis. The growth-promoting and metabolic actions of GH are mediated by specific GH receptors. The absence of or reduction in functional proteins might result in a condition of partial, transient and reversible GH insensitivity [34]. All our patients were exposed to high dose, intravenous MTX associated to its intrathecal administrations and to glucocorticoids in pre-induction, induction and re-induction phases (Table 1). Mild late effects on growth could be due to a direct, structural negative effect of chemotherapy on epiphysis with partial recovery [35]. Up to now, we can demonstrate a signifi-cant and not obvious role of chemotherapy in long-term growth impairment, but we can only hypothesize a synergic effect of all chemotherapeutic compounds in altering the multitude and the functionality of cells in growth plate.
Changes with time in BMI-SDS
Obesity is probably the most worrisome and common late effect in survivors of childhood ALL [36]. Razzouk in 2007 documented that 33.7% of 101 young adults treated previ-ously with chemotherapy-alone for ALL were obese [37]. In addition, children treated for childhood cancer may be at unusually high risk from the consequences of obesity, particularly cardiovascular and metabolic comorbidities. Our data help in clarifying changes in BMI SDS over time, meanwhile and after chemotherapy for ALL. Excess weight gain usually starts soon after diagnosis, particularly during the first year of therapy, and it seems to be main-tained [20,38]. Nevertheless, up to now, long-term BMI data in an unirradiated population are not yet fully de-scribed and short-term data are extrapolated from small populations [39]. The rate of weight gain varies between studies [10,37,40-42]. In our study, BMI-SDS increased
Table 3 Variation of anthropometric data in patients according to age (younger or older than 4 years)
< 4 years ≥4 years
Height SDS
sT 0.54 ± 1.06 0.67 ± 1.03
EoT 0.14 ± 1.13 (0.000) 0.34 ± 1.05 (0.003)
FH 0.08 ± 1.13 (0.001) 0.26 ± 1.14 (0.004)
BMI SDS
sT -0.03 ± 1.20 0.30 ± 1.40
EoT 0.48 ± 1.42 (0.005) 0.65 ± 1.29 (0.023)
FH 0.49 ± 0.97 (0.005) 0.53 ± 1.08
significantly from the start of treatment and the in-crease persisted until the achievement of FH. Inin-creased energy intake and reduced habitual physical activity are commonly considered the main responsible factors of weight gain. During treatment, patients usually undergo changes in their lifestyle. The loss of physical activity may start during hospitalization or unwellness period of the patient, but it persists into adulthood due to a number of factors, including diminished exercise capacity, impaired motor function, diminished interest in recreational activity and over-protectiveness of the child’s primary caregivers [36]. In adulthood, almost 44% of ALL survivors are unlikely to meet the Centers for Disease Control and Prevention Recommendations for physical activity and over 74% are less likely to be physically active [43] and their dietary intake is not concordant with specific dietary recommendation [44]. In our study, BMI SDS at sT is identified as independ-ent predictive factor for BMI-SDS at FH. This might indirectly document that, independently from the diagnosis of ALL and its treatment, environmental factors as a negative lifestyle acquired in the family setting during first years of life may intervene in the development of obesity during and after the treatment of ALL.
Exposure to chemotherapeutic medications seemed to differ between genders: females seemed more sensitive to effects of chemotherapy and they might be more at risk to present greater and more persistent metabolic alterations than males. Up to now, none of therapeutic choices and/or doses could explain this sexual dimorph-ism. Others factors should be considered. Female survi-vors are already known to be less active and to have a more unbalanced caloric intake than males [45]. Never-theless, a definitive explanation of gender dymorphism could be identified only when other risk factors respon-sible for an indirect damage of the hypothalamus-pituitary region or of the metabolic pathways will be studied [36]. Our findings confirm and reinforce recent Harper’s data [27,46]. The group from Cambridge pre-sented data from only 27 ALL survivors (17 females) who reached FH. Only in females, persisting increases in weight-SDS and BMI-SDS (+1.45 vs. +0.46, p < 0.0001) were evident at FH [27].
In our cohort, age at diagnosis did not correlate with final BMI SDS and it was not identified as its independ-ent predictive factors. Nevertheless, examining popula-tion according to age-subgroups (younger and older than 4 years at sT), only younger children presented a persistent increase of BMI SDS after the end of chemo-therapy. This might support that chemotherapy acts similarly to radiotherapy in altering body composition later-in-life via blunting hypothalamic leptin sensitivity and via modification of metabolism.
Conclusions
In conclusion, our study demonstrates that chemotherapy alone, as in AIEOP protocols, minimizes the loss in FH SDS together with the increase in BMI SDS in adult survi-vors of childhood. These results could be positively influ-enced by the fact that, in all the included Italian centers, the management of oncologic patients involves pediatric endocrinologists from the early stages of treatment, allow-ing early evaluation of pathological conditions and, conse-quently, early interventions. Nevertheless, both males and females experienced a loss in height-SDS during chemo-therapy that was not followed by an appropriate catch-up growth, and an increase of BMI-SDS. Physicians have to keep in mind that cancer survivors, because of treatment (potential cardiotoxic chemotherapy), are prone to de-velop cardiovascular disease. Obesity can increase the risk for morbidity and mortality due to diabetes, coronary ar-tery disease, atherosclerosis and other diseases related to overweight in adulthood [38], especially in females [47]. Our findings confirmed females as more at risk of either becoming or persisting obese long after chemotherapy. This enables us to focus our efforts in preventing their weight gain and long-term complications of obesity. Nevertheless, the majority of adult survivors are followed by primary health care physicians, rather than by an onco-logic center. This leads to an imperative need: educate all health workers on preventing these risks and on develop-ing specific intervention strategies, includdevelop-ing correct diet-ary and lifestyle choices [48] in ALL survivors, even if treated with chemotherapy only.
Abbreviations
ADM:Adriamycin; AIEOP: Italian Association of Pediatric Hematology and Oncology; ALL: Acute Lymphoblastic Leukemia; ARA-C: Cytosine arabinoside; BMI: Body Mass Index; CPM: Cyclophosphamide; DESA: Dexamethasone; DNM: Daunorubicin; EoT: End of Treatment; FH: Final Height; GH: Growth Hormone; IFO: Ifosfamide; IT: Intrathecal; IV: Intravenously; ASP: L-asparaginase; MTX: Methotrexate; PDN: prednisolone; SD: Deviation Score; SDS: Standard Deviation Score; sT: diagnosis of ALL; TH: Target Height; VCR: Vincristine; VM-26: teniposide; WBC: White Blood Cells; MP: 6-mercatopurine; 6-TG: 6-thioguanine.
Competing interests
The authors declare that they have no competing interests.
Authors’contributions
PB, AC, AM, MES and AR collected data. PB and LI conceived the study and its design, coordinated it and wrote the manuscript. BP performed the statistical analysis. PP supervised the project as the head of department and reviewed the manuscript making important intellectual contributions. All authors read and approved the final manuscript.
Author details
1
Received: 1 February 2014 Accepted: 10 September 2014 Published: 22 September 2014
References
1. Redaelli A, Laskin BL, Stephens JM, Botteman MF, Pashos CL:A systematic literature review of the clinical and epidemiological burden of acute lymphoblastic leukemia (ALL).Eur J Cancer Care2005,14(1):53–62. 2. Pui CH, Robison LL, Look AT:Acute lymphoblastic leukaemia.Lancet2008,
371:1030–1043.
3. Smith MA, Altekruse SF, Adamson PC, Reaman GH, Seibel NL:Declining childhood and adolescent cancer mortality.Cancer2014,
120(16):2497–2506.
4. Gatta G, Rossi S, Foschi R, Trama A, Marcos-Gragera R, Pastore G, Peris-Bonet R, Stiller C, Capocaccia R, EUROCARE Working Group:Survival and cure trends for European children, adolescents and young adults diagnosed with acute lymphoblastic leukemia from 1982 to 2002.Haematologica2013, 98(5):744–752.
5. Essig S, Li Q, Chen Y, Hitzler J, Leisenring W, Greenberg M, Sklar C, Hudson MM, Armstrong GT, Krull KR, Neglia JP, Oeffinger KC, Robison LL, Kuehni CE, Yasui Y, Nathan PC:Risk of late effects of treatment in children newly diagnosed with standard-risk acute lymphoblastic leukaemia: a report from the Childhood Cancer Survivor Study cohort.Lancet Oncol2014, 15(8):841–851.
6. Vilela MI, Serravite Mde O, Oliveira NB, de Brito PC, Ribeiro-Oliveira A Jr, Viana MB:Height deficit and impairment of the GH/IGF-1 axis in patients treated for acute lymphoblastic leukemia during childhood.Horm Res Paediatr2013,79(1):9–16.
7. Nottage KA, Ness KK, Li C, Srivastava D, Robison LL, Hudson MM:Metabolic syndrome and cardiovascular risk among long-term survivors of acute lymphoblastic leukaemia - From the St. Jude Lifetime Cohort.
Br J Haematol2014,165(3):364–374.
8. Smith MA, Seibel NL, Altekruse SF, Ries LAG, Melbert DL, O’Leary M, Smith FO, Reaman GH:Outcomes for children and adolescents with cancer: challenges for the twenty-first century.J Clin Oncol2010,28:2625–2634. 9. Chow EJ, Friedman DL, Yasui Y, Whitton JA, Stovall M, Robinson LL, Sklar
CA:Decreased adult height in survivors of childhood acute lymphoblastic leukemia: a report from the Childhood Cancer Survivor Study.J Pediatr2007,150:370–375.
10. Breene RAL, Williams RM, Hartle J, Gattens M, Acerini CL, Murray MJ: Auxological changes in UK survivors of childhood acute lymphoblastic leukemia treated without cranial irradiation.BJC2011,104:746–749. 11. Cicognani A, Cacciari E, Rosito P:Longitudinal growth and final height in
long-term survivors of childhood leukemia.Eur J Pediatr1994, 153:726–730.
12. Birkebaek NH, Clausen N:Height and weight pattern up to 20 years after treatment for acute lymphoblastic leukaemia.Arch Dis Child1998, 79:161–164.
13. Hokken-Koelega AC, van Doorn JW, Hahlen K, Stijnen T, de Muinck Keizer-Schrama SM, Drop SL:Long-term effects of treatment for acute lymphoblastic leukemia with and without cranial irradiation on growth and puberty: a comparative study.Pediatr Res1993,33:577–582. 14. Conter V, Aricò M, Basso G, Biondi A, Barisone E, Messina C, Parasole R, De
Rossi G, Locatelli F, Pession A, Santoro N, Micalizzi C, Citterio M, Rizzari C, Silvestri D, Rondelli R, Lo Nigro L, Ziino O, Testi AM, Masera G, Valsecchi MG: Long-term results of the Italian Association of Pediatric Hematology and Oncology (AIEOP) Studies 82, 87, 88, 91, and 95 for childhood acute lymphoblastic leukemia.Leukemia2010,24(2):255–264.
15. World Health Organization Growth Reference 2007.[www.who.int/ growthref]
16. Tanner JM, Goldstein H, Whitehouse RH:Standards for children’s height at ages 2–9 years allowing for height of parents.Arch Dis Child1970, 47:755–762.
17. Schriock EA, Schell MJ, Carter M, Hustu O, Ichs JJ:Abnormal growth patterns and adult short stature in 115 long-term survivors of childhood leukemia.J Clin Oncol1991,9:400–405.
18. Vilela MI, Viana MB:Longitudinal growth and risk factors for growth deficiency in children treated for acute lymphoblastic leukaemia.
Pediatr Blood Cancer2007,48(1):86–92.
19. Ben Arush MW, Elhasid I:Effects of radiotherapy on the growth of children with leukemia.Pediatr Endocrinol Rev2008,5:785–788.
20. Withycombe JS, Post-white JE, Meza JL, Hawks RG, Smith LM, Sacks N, Seibel NL:Weight patterns in children with higher risk acute lymphoblastic leukemia: a report from the children’s oncology group for CCG 1961.
Pediatr Blood Cancer2009,53:1249–1254.
21. Katz JA, Pollock BH, Jacaruso D, Morad A:Final attained height in patients successfully treated for childhood acute lymphoblastic leukemia.
J Pediatr1993,123:546–552.
22. Holm K, Nysom K, Hertz H, Muller J:Normal final height after treatment for acute lymphoblastic leukemia without irradiation.Acta Paediatr1994, 83:1287–1290.
23. Dalton VK, Rue M, Silverman LB, Gelber RD, Asselin BL, Barr RD, Clavell LA, Hurwitz CA, Moghrabi A, Samson Y, Schorin M, Tarbell NJ, Sallan SE, Cohen LE: Height and weight in children treated for acute lymphoblastic leukemia: relationship to CNS treatment.J Clin Oncol2003,21:2953–2960.
24. Sklar C, Mertens A, Walter A, Mitchell D, Nesbit M, O'Leary M, Hutchinson R, Meadows A, Robison L:Final height after treatment for childhood acute lymphoblastic leukemia: comparison of no cranial irradiation with 1800 and 2400 centigrays of cranial irradiation.J Pediatr1993,123(1):59–64. 25. Bongers ME, Francken AB, Rouwé C, Kamps WA, Postma A:Reduction of
adult height in childhood acute lymphoblastic leukemia survivors after prophylactic cranial irradiation.Pediatr Blood Cancer2005,45(2):139–143. 26. Vandecruys E, Dhooge C, Craen M, Benoit Y, De Schepper J:Longitudinal
linear growth and final height is impaired in childhhod acute lymphoblastic leukemia survivors after treatment without cranial irradiation.J Pediatr2013,163(1):268–273.
27. Harper RLC, Breene RAL, Gattens M, Williams RM, Murray MJ:Non-irradiated females survivors of childhood acute lymphoblastic leukemia are at risk of long-term increases in weight and body mass index.Br J Haematol
2013,163(4):510–513.
28. Uruena M, Stanhope R, Chessells JM, Leiper AD:Impaired pubertal growth in acute lymphoblastic leukemia.Arch Dis Child1991,66:1403–1407. 29. Leiper AD, Stanhope R, Kitching P, Chessells JM:Precocious and premature
puberty associated with treatment of acute lymphoblastic leukemia.
Arch Dis Child1987,62(11):1107–1112.
30. Didcock E, Davies HA, Didi M, Ogilvy Stuart AL, Wales JK, Shalet SM: Pubertal growth in young adults survivors of childhood leukemia.
J Clin Oncol1995,13(10):2503–2507.
31. Rose SR, Schreiber RE, Kearney NS, Lustig RH, Danish RK, Burghen GA, Hudson MM:Hypothalamic dysfunction after chemotherapy.J Pediatr Endocrinol Metab2004,17(1):55–66.
32. Haddy TB, Mosher RB, Nunez SB, Reaman GH:Growth hormone deficiency after chemotherapy for acute lymphoblastic leukemia in children who have not received cranial radiation.Pediatr Blood Cancer2006, 46(2):258–261.
33. Leung W, Rose SR, Zhou Y, Hancock ML, Burstein S, Schriock EA, Lustig R, Danish RK, Evans WE, Hudson MM, Pui CH:Outcomes of growth hormone replacement therapy in survivors of childhood acute lymphoblastic leukemia.J Clin Oncol2002,20(13):2959–2964.
34. Arguelles B, Barrios V, Buno M, Madero L, Argente J:Anthropometric parameters and their relationship to serum growth hormone-binding protein and leptin levels in children with acute lymphoblastic leukemia: a prospective study.Eur J Endocrinol2000,143(2):243–250.
35. van Leeuwen BL, Hartel RM, Jansen HW, Kamps WA, Hoekstra HJ:The effect of chemotherapy on the morphology of the growth plate and metaphysis of the growing skeleton.Eur J Surg Oncol2003,29(1):49–58. 36. Iughetti L, Bruzzi P, Predieri B, Paolucci P:Obesity in patients with acute
lymphoblastic leukemia in childhood.Ital J Pediatr2012,38:4. 37. Razzouk I, Rose SR, Hongeng S, Wallace D, Smeltzer MP, Zacher M, Pui CH,
Hudson MM:Obesity in survivors of childhood acute lymphoblastic leukemia and lymphoma.J Clin Oncol2007,25:1183–1189. 38. Chow EJ, Pihoker C, Hunt K, Wilkinson K, Friedman DL:Obesity and
hypertension among children after treatment for acute lymphoblastic leukaemia.Cancer2007,110:2313–2320.
39. Craig F, Leiper AD, Stanhope R, Brain C, Meller ST, Nussey SS:Sexually dimorphic and radiation dose dependent effect of cranial irradiation on body mass index.Arch Dis Child1999,81:500–504.
41. Oeffinger K, Mertens A, Sklar C, Yasui Y, Fears T, Stovall M, Vik TA, Inskip PD, Robison LL:Obesity in adult survivors of childhood acute lymphoblastic leukemia: a report from the childhood cancer survivor study.J Clin Oncol
2003,21:1359–1365.
42. Didi M, Didcock E, Davies HA, Ogilvy-Stuart AL, Wales JK, Shalet SM: High incidence of obesity in young adults after treatment of acute lymphoblastic leukemia in childhood.J Pediatr1995,127:63–67. 43. Florin TA, Fryer GE, Miyoshi T, Weitzman M, Mertens AC, Hudson MM, Sklar
CA, Emmons K, Hinkle A, Whitton J, Stovall M, Robison LL, Oeffinger KC: Physical inactivity in adult survivors of childhood acute lymphoblastic leukemia: a report from the childhood cancer survivor study.Cancer Epidemiol Biomarkers Prev2007,16:1356–1363.
44. Robien K, Ness KK, Klesges LM, Baker KS, Gurney JG:Poor adherence to dietary guidelines among adult survivors of childhood acute lymphoblastic leukemia.J Pediatr Hematol Oncol2008,30(11):815–822. 45. Jarvela LS, Niinikoski H, Lahteenmaki PM, Heinonen OJ, Kapanen J, Arola M,
Kemppainen J:Physical activity and fitness in adolescent and young adult long-term survivors of childhood acute lymphoblastic leukemia.
J Cancer Surviv2010,4(4):339–345.
46. Mayer EI, Reuter M, Dopfer RE, Ranke MB:Energy expenditure, energy intake and prevalence of obesity after therapy for acute lymphoblastic leukemia during childhood.Horm Res2000,53:193–199.
47. Armstrong GT, Oeffinger KC, Chen Y, Kawashima T, Yasui Y, Leisenring W, Stovall M, Chow EJ, Sklar CA, Mulrooney DA, Mertens AC, Border W, Durand JB, Robison LL, Meacham LR:Modifiable risk factors and major cardiac events among adult survivors of childhood cancer.J Clin Oncol2013, 31(29):3673–3680.
48. World Cancer Research Fund. American Institute for Cancer Research. [www.dietandcancerreport.org–http://www.health.gov/DietaryGuidelines/]
doi:10.1186/1471-2431-14-236
Cite this article as:Bruzziet al.:Final height and body mass index in adult survivors of childhood acute lymphoblastic leukemia treated without cranial radiotherapy: a retrospective longitudinal multicenter Italian study. BMC Pediatrics201414:236.
Submit your next manuscript to BioMed Central and take full advantage of:
• Convenient online submission
• Thorough peer review
• No space constraints or color figure charges
• Immediate publication on acceptance
• Inclusion in PubMed, CAS, Scopus and Google Scholar
• Research which is freely available for redistribution