https://doi.org/10.5194/amt-12-6209-2019 © Author(s) 2019. This work is distributed under the Creative Commons Attribution 4.0 License.
A new method to quantify mineral dust and other aerosol species
from aircraft platforms using single-particle mass spectrometry
Karl D. Froyd1,2, Daniel M. Murphy1, Charles A. Brock1, Pedro Campuzano-Jost2,3, Jack E. Dibb4,
Jose-Luis Jimenez2,3, Agnieszka Kupc1,5, Ann M. Middlebrook1, Gregory P. Schill1,2, Kenneth L. Thornhill6, Christina J. Williamson1,2, James C. Wilson7, and Luke D. Ziemba8
1NOAA Earth System Research Laboratory Chemical Sciences Division, Boulder, CO 80305, USA
2Cooperative Institute for Research in Environmental Sciences, University of Colorado, Boulder, CO 80309, USA 3Department of Chemistry, University of Colorado, Boulder, CO 80309, USA
4Earth Systems Research Center, Institute for the Study of Earth, Oceans, and Space, University of New Hampshire, Durham, NH 03824, USA
5Faculty of Physics, University of Vienna, 1090 Vienna, Austria
6NASA Langley Research Center, Science Systems and Applications, Inc., Hampton, VA 23666, USA 7Department of Mechanical and Materials Engineering, University of Denver, Denver, CO 80210, USA 8NASA Langley Research Center, Hampton, VA 23681, USA
Correspondence:Karl D. Froyd (karl.froyd@noaa.gov) Received: 17 April 2019 – Discussion started: 25 April 2019
Revised: 3 October 2019 – Accepted: 23 October 2019 – Published: 27 November 2019
Abstract.Single-particle mass spectrometry (SPMS) instru-ments characterize the composition of individual aerosol par-ticles in real time. Their fundamental ability to differentiate the externally mixed particle types that constitute the atmo-spheric aerosol population enables a unique perspective into sources and transformation. However, quantitative measure-ments by SPMS systems are inherently problematic. We in-troduce a new technique that combines collocated measure-ments of aerosol composition by SPMS and size-resolved ab-solute particle concentrations on aircraft platforms. Quantita-tive number, surface area, volume, and mass concentrations are derived for climate-relevant particle types such as min-eral dust, sea salt, and biomass burning smoke. Additionally, relative ion signals are calibrated to derive mass concentra-tions of internally mixed sulfate and organic material that are distributed across multiple particle types.
The NOAA Particle Analysis by Laser Mass Spectrometry (PALMS) instrument measures size-resolved aerosol chemi-cal composition from aircraft. We describe the identification and quantification of nine major atmospheric particle classes, including sulfate–organic–nitrate mixtures, biomass burning, elemental carbon, sea salt, mineral dust, meteoric material, alkali salts, heavy fuel oil combustion, and a remainder class.
Classes can be sub-divided as necessary based on chemical heterogeneity, accumulated secondary material during aging, or other atmospheric processing. Concentrations are derived for sizes that encompass the accumulation and coarse size modes. A statistical error analysis indicates that particle class concentrations can be determined within a few minutes for abundances above ∼10 ng m−3. Rare particle types require longer sampling times.
1 Introduction
Particle mass spectrometry is a valuable method for charac-terizing atmospheric aerosol composition from airborne plat-forms. Instrumental techniques can be broadly categorized into bulk methods, where all aerosol within a size range are collected and characterized as a population (Canagaratna et al., 2007; Pratt and Prather, 2012), and single-particle meth-ods that characterize individual particles as a subset of the aerosol population, with a few hybrid methods also demon-strated (Cross et al., 2009; Freutel et al., 2013). Single-particle mass spectrometry (SPMS) instruments (Hinz and Spengler, 2007; Murphy, 2007) have been used for over 25 years to characterize the chemical composition of at-mospheric aerosol from ground sites and aircraft platforms. The NOAA Particle Analysis by Laser Mass Spectrome-try (PALMS) instrument first flew in 1998 (Thomson et al., 2000), and several other SPMS instruments have successfully flown on airborne platforms (Brands et al., 2011; Coggiola et al., 2000; Pratt et al., 2009a; Trimborn et al., 2000; Ze-lenyuk et al., 2015). Their high sensitivity to a wide vari-ety of aerosol species, size-resolved capability, and ability to characterize internally and externally mixed aerosol species make SPMS instruments well suited to airborne studies of atmospheric aerosol composition.
PALMS measures aerosol composition by evaporating in-dividual particles and ionizing their chemical constituents using a single pulse from a powerful laser, then analyzes the ions with a time-of-flight mass spectrometer. PALMS and other SPMS instruments that use single-step laser desorption–ionization (LDI) are not inherently quantitative because ion formation is not a well-controlled process and gives rise to considerable particle-to-particle variability in both total and relative ion signals (Hinz and Spengler, 2007; Murphy, 2007). Many bulk aerosol mass spectrome-ters (Canagaratna et al., 2007; Tobias et al., 2000) and some SPMS instruments (Passig et al., 2017; Simpson et al., 2009; Sykes et al., 2002) use a two-step particle desorption and ion-ization process that can more readily quantify particle sub-components. Very high laser irradiances generate plasmas that can also improve consistency in ion signals but at the expense of losing all molecular information (Wang and John-ston, 2006).
SPMS instruments have not typically calibrated the abso-lute ion signal intensity to aerosol mass abundance due to ionization variability. Also, SPMS particle detection usually relies on optical scattering, so that the overall detection effi-ciency is a strong and variable function of particle size. Nev-ertheless, a number of studies have used SPMS techniques to quantify various aerosol species. Relative abundance mea-surements of internally mixed aerosol sub-components have been reported for metals (Cziczo et al., 2001; Healy et al., 2013; Murphy et al., 2007; Zawadowicz et al., 2015), organosulfate species (Froyd et al., 2010; Liao et al., 2015), elemental carbon (EC; Healy et al., 2012), and non-refractory
material such as ammonium and nitrate (Healy et al., 2013), or sulfate and organic material (Healy et al., 2013; Jeong et al., 2011; Middlebrook et al., 1998; Murphy et al., 2006; Ze-lenyuk et al., 2008; Zhou et al., 2016). Some groups have scaled SPMS data rates to aerosol reference instruments, ei-ther under controlled conditions prior to deployment (Shen et al., 2019) or more commonly co-located in the field, to derive total number or mass concentrations (Bein et al., 2006; Pratt et al., 2009a; Qin et al., 2006) or concentrations for specific particle types and sub-components (Gemayel et al., 2017; Healy et al., 2012, 2013; Jeong et al., 2011; Reinard et al., 2007; Shen et al., 2019). Many of these scaling studies invoke potentially large assumptions such as constant SPMS detec-tion efficiencies or a single density applied to all particles that can strongly affect derived concentrations. Uncertainty estimates in these derived concentrations are rarely reported (Shen et al., 2019), and a complete analysis of all principal error sources has not been previously undertaken. To date these methods have been restricted to ground-based sampling under relatively high aerosol loadings (∼1–100 µg m−3) and have employed long sample times≥1 h. Few coarse-mode concentrations have been reported (Gunsch et al., 2018; Qin et al., 2006), and in particular, studies using SPMS to de-termine absolute concentrations of mineral dust are nearly absent (Shen et al., 2019).
Mineral dust is one of the most abundant aerosol types in the atmosphere. Dust contributes a substantial fraction to global aerosol optical depth by scattering and absorbing ra-diation. Dust’s role as a leading cirrus cloud nucleating agent (Cziczo et al., 2013) further elevates its importance for the climate system. However, dust measurement techniques for airborne studies, particularly fast-response online methods, are lacking. Online bulk mass spectrometry techniques are typically not sensitive to refractory particles such as dust. Also, instruments and aircraft inlets must be optimized to sample coarse-mode aerosol up to several microns in size. Electron microscopy (EM) techniques with associated ele-mental analysis remain valuable offline single-particle meth-ods to detect and quantify components associated with min-eral dust (Kandler et al., 2009; Levin et al., 2005; Lieke et al., 2011; Matsuki et al., 2010) and other less volatile aerosol such as sulfate, sea salt, industrial metals, and some carbonaceous particles (Pósfai et al., 2003; Sheridan et al., 1994). Computer-controlled EM analysis can now charac-terize thousands of particles and generate population statis-tics of size, morphology, and detailed chemical composition (Ault and Axson, 2017; Craig et al., 2017). However, contin-uous measurements at high time resolution remain impracti-cal, the derivation of dust mass concentrations under back-ground aerosol levels is challenging, and like most offline methods, volatile or reactive aerosol species can change prior to analysis.
characteriza-tion of particle mixing state, i.e., the distribucharacteriza-tion of chemical constituents within single particles or across different parti-cle types, are tractable by few methods. SPMS instruments are uniquely capable of detecting both refractory and non-refractory particles in real time. PALMS and other SPMS instruments with sufficient laser power observe a chemical fingerprint for every type of aerosol particle in the atmo-sphere, minimizing chemical bias. Lower laser power and/or a longer ionization wavelength can result in biases against particles such as sulfate (Wenzel et al., 2003). SPMS instru-ments are particularly adept at characterizing some climate-relevant aerosol types, including mineral dust, biomass burn-ing smoke, sea salt, and biological particles with high sensi-tivity and selecsensi-tivity.
We present a new method that combines PALMS com-position with independently measured particle size distribu-tions to determine absolute number, surface area, volume, and mass concentrations of mineral dust, biomass burning, sea salt, and other common atmospheric particle types, with fast time response applicable to aircraft sampling where to-tal mass concentrations are often > 100 times lower than at ground level. Low detection limits on the order of 10 ng m−3 for principal particle types are typical over a few minutes of sampling time. A unique capability of this technique is the derivation of number concentration for specific particle types, which is particularly important for aerosol–cloud in-teraction studies. Size-resolved aerosol composition is mea-sured over a wide size range that spans the accumulation and coarse modes under most atmospheric conditions. Addition-ally, we determine bulk-like mass concentrations for sulfate and organic material that are distributed across multiple par-ticle types. The quantification methods described here are de-veloped specifically for the PALMS instrument, but they are designed to act as a framework for quantifying particle types using other well-characterized SPMS instruments. We sum-marize the principal sampling considerations and measure-ment criteria for deriving particle type concentrations, and we conclude with general recommendations for implement-ing the method in airborne composition studies. Estimations for principal sources of uncertainty are detailed in the Ap-pendix.
2 Measurement methods
Brief descriptions of the airborne aerosol sampling methods employed over several aircraft campaigns are given below, followed by descriptions of aerosol instrumentation for mea-suring composition and size distributions.
2.1 Airborne aerosol sampling
Aerosol properties were measured aboard the NASA DC-8 aircraft during three campaigns: DC3, SEAC4RS, and ATom. The Deep Convective Clouds and Chemistry (DC3)
campaign was based in Salina, Kansas, in April–May 2012 and targeted convective outflow from isolated storm systems (Barth et al., 2015). The Studies of Emissions and Atmo-spheric Composition, Clouds and Climate Coupling by Re-gional Surveys (SEAC4RS) campaign was based in Hous-ton, Texas, in August–September 2013, and sampled a vari-ety of continental environments including regions with high biogenic activity, urban emissions, wildfires, and convective outflow (Toon et al., 2016). The NASA Atmospheric To-mography (ATom) campaign consisted of four seasonal de-ployments from 2016 to 2018 to map the troposphere with near pole-to-pole coverage in north–south transects along the Pacific and Atlantic basins (Wofsy et al., 2018). Measure-ments during the New England Air Quality Study (NEAQS) campaign were taken aboard the NOAA WP-3D aircraft based in Portsmouth, New Hampshire, in July–August 2004, with flights targeting anthropogenic emissions from the east-ern US (Fehsenfeld et al., 2006). During the NASA Mid-latitude Airborne Cirrus Properties Experiment (MACPEX) campaign the WB-57 aircraft was based in Houston, Texas, in March–April 2011 and sampled tropospheric continen-tal and stratospheric background air near cirrus cloud sys-tems (https://espo.nasa.gov/macpex/, last access: 26 Octo-ber 2019). Cloudy flight segments are excluded from all aerosol data (Murphy et al., 2004b).
A virtual impactor was added upstream of PALMS for the DC-8 ATom deployments to enhance supermicron particle concentration. The design is based on Loo and Cork (1988) and is scaled to achieve an enhancement of at least 50 % of the flow ratio above∼2.0 µm. The virtual impactor was op-erated at total-to-minor flow ratios of 5.6–11. Figure S1 in the Supplement shows the virtual impactor design and its con-centration enhancement for lab-generated aerosol.
2.2 Aerosol size and composition measurements The NOAA PALMS instrument (Thomson et al., 2000) char-acterizes the size and chemical composition of individual aerosol particles from about 0.15 to 5 µm in diameter. Par-ticles pass through an aerosol focusing lens (Schreiner et al., 2002) and enter a vacuum where they pass through two con-tinuous laser beams and scatter light. The transit time be-tween the beams provides the particle velocity, which is used to determine particle aerodynamic diameters based on labo-ratory calibrations using polystyrene latex sphere size stan-dards (Duke Scientific). A scatter signal triggers a 193 nm pulse from an excimer laser that ablates and ionizes a single particle. Either positive or negative ions are analyzed with a time-of-flight mass spectrometer, with the polarity switched every few minutes during flight. Single-particle mass spec-tra are post-processed to classify each particle into a com-positional type and calculate the relative abundance of parti-cle sub-components (Froyd et al., 2009; Hudson et al., 2004; Murphy et al., 2003).
An important consideration when measuring fractional and absolute abundance from single-particle analysis is the estimation of potential sampling biases due to particle com-position or physical properties. In one example, if a certain particle type does not produce detectable ions when hit by the ionization laser, a systematic bias would occur that would underestimate the concentration of that particle type. Addi-tionally, particle mass spectrometers can exhibit a low bias for non-spherical particles due to diverging particle trajec-tories (Huffman et al., 2005; Vaden et al., 2011). Many as-pects of the PALMS instrument design reduce these potential biases (Murphy, 2007). The very close proximity of detec-tion and ionizadetec-tion beams (center separadetec-tion∼100 µm) en-ables PALMS to obtain positive ion mass spectra for > 90 % of particle triggers. In addition, the particle transit distance between the vacuum entrance and the ionization region is shorter than most other SPMS systems. This high targeting efficiency and compact detection region in PALMS mini-mizes chemical biases from particles of different shape or density that could have diverse trajectories. The PALMS ion-ization laser produces a mass spectrum for all known particle types in the atmosphere. Even pure sulfuric-acid–water par-ticles, which are notoriously difficult to ionize due to their low absorption properties, generate sufficient ions in PALMS for particle classification. For the data presented here, parti-cles were exposed to > 2500 MW cm−2 of laser fluence at
193 nm, which is above the ion formation threshold for rel-atively pure sulfuric acid (Thomson et al., 1997). For or-ganics and sulfate–organic mixtures, ion production is self-limiting due to space-charge repulsion, and total ion current in PALMS is relatively insensitive to laser power. Lastly, par-ticles in the accumulation mode are nearly or completely ab-lated by the excimer laser (Murphy, 2007). Consequently, PALMS mass spectra represent the composition of the entire particle so that classification routines and relative measure-ments of chemical sub-components are not biased to phys-ical inhomogeneities such as coatings, phase separation, or surface-enhanced species. It should be noted that although coarse-mode sea salt mineral dust particles do not fully ablate and therefore may give an incomplete picture of the particle composition, the mass spectral signatures are still unique to those particle types, and they are classified accurately. We therefore assume that detection biases due to particle chem-ical or physchem-ical properties yield systematic errors that are small compared to other sources of error (see Appendix A).
Several optical particle spectrometer instruments were used for size distribution measurements. During NASA DC-8 sampling campaigns, the Laser Aerosol Spectrome-ter (LAS 3340, TSI, Inc) measured concentrations for par-ticles from 0.1 to about 5 µm, above which the aircraft inlet transmission truncated the size distribution. Also on the DC-8, an Ultra-High Sensitivity Aerosol Spectrometer (Droplet Measurement Technologies) measured particles from 0.06 to either 0.5 or 1.0 µm, above which the LAS data were used. On the NOAA P-3 aircraft, the combination of a Lasair model 1001 (Particle Measurement Systems) and a custom-built white light optical particle counter (WLOPC) mea-sured particle concentrations from 0.12 to about 8 µm. On the NASA WB-57 aircraft, a custom-built Focused Cavity Aerosol Spectrometer (FCAS II) measured particles from about 0.07 to 1.5 µm dry diameter (Jonsson et al., 1995; Wil-son et al., 2008). All sizes are reported as ammonium sul-fate diameters, and all concentrations are reported at standard conditions (1013 hPa and 273.15 K).
3 Deriving absolute concentrations
3.1 Composition-resolved size distributions from SPMS combined with particle size spectrometers The general method of deriving quantitative abundance from single-particle composition data is introduced here and out-lined in Fig. 1, with details described in the following sec-tions. The approach combines size-resolved, single-particle composition from the PALMS instrument with a concurrent measurement of size-resolved absolute number concentra-tion. Typically, an optical particle spectrometer (OPS) is used to measure the aerosol size distribution across the accumu-lation and coarse modes, although other sizing techniques based on electric mobility or aerodynamic diameter, or a combination of techniques, can be employed. Mass spectra of individual particles acquired with PALMS are classified into one of several compositional categories. Aerodynamic diameters, Da, for each particle are converted to volume-equivalent (geometric) diameters,Dve, using particle densi-ties and dynamic shape factors to match the OPS data. The particle classes are binned into size ranges that align with the particle size spectrometer. Then the fraction of each par-ticle class within each size bin is multiplied by the aver-age concentration within that bin. The resulting composition-resolved size distribution is integrated to give absolute num-ber, surface area, or volume concentrations for each particle class. Mass concentrations for each particle type are deter-mined by applying particle densities to the volume concen-trations. Total sulfate and organic mass concentrations were derived from the non-refractory particle types.
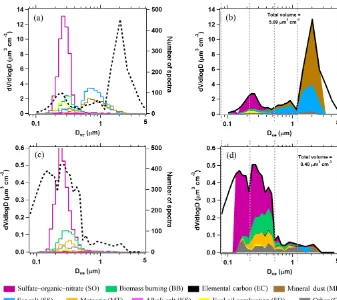
Figure 2 shows two composition-resolved volume distri-butions measured from aircraft that are representative of two diverse atmospheric environments. Panels a and c give raw spectra counts as a function of size for each PALMS com-position class, as well as the OPS volume distribution. The PALMS size bins are then aligned to the OPS, and fractional abundances in each size bin are applied to the OPS volume distribution to generate the panels b and d.
The composition-resolved size distributions in Fig. 2b and d contain a wealth of information and represent a pow-erful set of tools to investigate atmospheric aerosol proper-ties. PALMS and other single-particle techniques show that the atmosphere consists of an external mixture of particle types, and in Fig. 2 the compositional size modes for these particle types are clearly revealed. Three broad aerosol re-gions are apparent in the volume distributions: the accu-mulation mode at Dve< 0.5 µm consisting of mostly non-refractory particle types, a coarse mode atDve> 1 µm domi-nated by mineral dust and sea salt, and the inter-mode min-imum at 0.5 <Dve< 1 µm that is a mixture of accumulation-and coarse-mode composition. Most particle classes extend to sizes beyond their principal mode. For instance, sea salt and mineral dust can also contribute significantly to submi-cron aerosol volume. In many environments, an extension
Figure 1.Flow chart to derive particle type concentrations and bulk sulfate and organic mass concentrations from SPMS and OPS data.
of the accumulation mode continues to > 1 µm where non-refractory particle types contribute to supermicron volume (Fig. 2d).
Figure 2.Quantification of PALMS particle classes.(a, c)Raw PALMS counts for different particle classes (colors) overlaid on the aerosol volume size distribution (dashed black).(b, d)For each diameter bin, the fractional contributions of each PALMS particle class are applied to the total volume. Vertical dashed lines define four broad diameter bins that are used to generate concentration products at higher time resolution (see text). The upper panels are from 39 min of sampling at low altitude over the Gulf of Mexico and contain influences from the marine boundary layer, long-range mineral dust transport, and lower tropospheric pollution. The bottom panels represent the remote upper troposphere with minor influences from continental and stratospheric sources, sampled over 27 min.
describe simplifying assumptions that allow faster measure-ments of particle type concentration while maintaining rea-sonable uncertainties. Uncertainties and limits of detection for particle type concentrations are detailed in Appendix A. 3.2 Particle composition classes
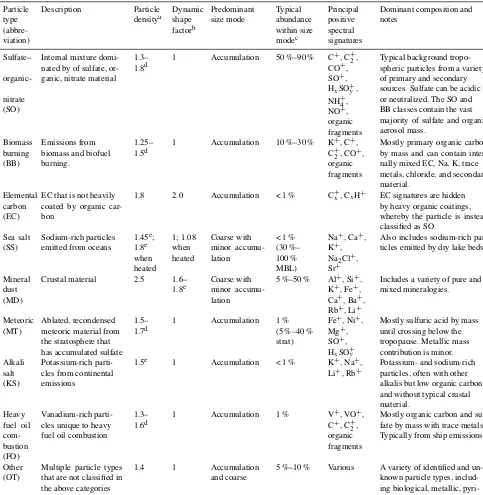
Each PALMS particle mass spectrum is classified as one composition type, e.g., mineral dust, sea salt, or sulfate– organic–nitrate (SO) mixtures, according to dominant spec-tral signatures. PALMS particle classification has been de-scribed previously (Cziczo et al., 2001, 2004; Froyd et al., 2009; Hudson et al., 2004), and definitions for nine principal atmospheric particle types are updated here. Chemical signa-tures, sizes, and other properties are listed in Table 1. These particle classes are defined so as to broadly capture the main chemical components or identify a distinct aerosol source. It is important to note that PALMS and other SPMS particle type definitions are flexible and can be tailored to a particu-lar environment or objective. Only positive ion mass spectra are used to categorize particles into these classes. The classi-fication method uses empirical criteria based on relative peak
intensities, and a spectra clustering algorithm (Murphy et al., 2003) is then used to refine particle sorting. Figure S2 shows representative particle mass spectra for all classes in Table 1. The most abundant classes under most tropospheric en-vironments are the sulfate–organic–nitrate internal mixtures and biomass burning (BB) particles. Particles classified as SO can be composed of primary or secondary material from a wide variety of sources but contain no biomass burning or other clear chemical markers that denote a particular source. Biomass burning particles are identified by a distinct potas-sium signature, abundant organic signatures, and a lack of crustal, marine, or industrial metals, based on the method of Hudson et al. (2004). The crucial potassium signature is sta-ble over weeks of aging, and due to PALMS extreme sensi-tivity to alkali metals, the potassium signal is observed above organic background peaks even when potassium constitutes
Table 1.PALMS principal atmospheric particle types. Particle type (abbre-viation) Description Particle densitya Dynamic shape factorb Predominant size mode Typical abundance within size modec Principal positive spectral signatures
Dominant composition and notes
Sulfate–
organic–
nitrate (SO)
Internal mixture domi-nated by of sulfate, or-ganic, nitrate material
1.3– 1.8d
1 Accumulation 50 %–90 % C+, C+2, CO+, SO+, HxSO+y,
NH+4, NO+, organic fragments
Typical background tropo-spheric particles from a variety of primary and secondary sources. Sulfate can be acidic or neutralized. The SO and BB classes contain the vast majority of sulfate and organic aerosol mass.
Biomass burning (BB)
Emissions from biomass and biofuel burning.
1.25– 1.5d
1 Accumulation 10 %–30 % K+, C+, C+
2, CO
+,
organic fragments
Mostly primary organic carbon by mass and can contain inter-nally mixed EC, Na, K, trace metals, chloride, and secondary material.
Elemental carbon (EC)
EC that is not heavily coated by organic car-bon
1.8 2.0 Accumulation < 1 % C+x, CxH+ EC signatures are hidden
by heavy organic coatings, whereby the particle is instead classified as SO.
Sea salt (SS)
Sodium-rich particles emitted from oceans
1.45e; 1.8e when heated 1; 1.08 when heated Coarse with minor accumu-lation
< 1 % (30 %– 100 % MBL)
Na+, Ca+, K+, Na2Cl+, Sr+
Also includes sodium-rich par-ticles emitted by dry lake beds.
Mineral dust (MD)
Crustal material 2.5 1.6– 1.8e
Coarse with minor accumu-lation
5 %–50 % Al+, Si+, K+, Fe+, Ca+, Ba+, Rb+, Li+
Includes a variety of pure and mixed mineralogies.
Meteoric (MT)
Ablated, recondensed meteoric material from the stratosphere that has accumulated sulfate
1.5– 1.7d
1 Accumulation 1 % (5 %–40 % strat)
Fe+, Ni+, Mg+, SO+, HxSO+y
Mostly sulfuric acid by mass until crossing below the tropopause. Metallic mass contribution is minor. Alkali
salt (KS)
Potassium-rich parti-cles from continental emissions
1.5e 1 Accumulation < 1 % K+, Na+, Li+, Rb+
Potassium- and sodium-rich particles, often with other alkalis but low organic carbon and without typical crustal material. Heavy fuel oil com-bustion (FO) Vanadium-rich parti-cles unique to heavy fuel oil combustion
1.3– 1.6d
1 Accumulation 1 % V+, VO+, C+, C+2, organic fragments
Mostly organic carbon and sul-fate by mass with trace metals. Typically from ship emissions.
Other (OT)
Multiple particle types that are not classified in the above categories
1.4 1 Accumulation and coarse
5 %–10 % Various A variety of identified and un-known particle types, includ-ing biological, metallic, pyri-dinium, and others.
aDensity at measurement conditions.bχv, within or near free molecular flow.cMass fraction within the dominant size mode for background tropospheric air.; strat=lower stratosphere, MBL=marine boundary layer.dCalculated based on organic-to-sulfate mass ratio.eDerived from optical–aerodynamic analysis.
sources that can confound bulk measurements (Legrand et al., 2016; Sullivan et al., 2019). Although secondary aerosol material is by definition distributed across many composition classes, the SO and BB classes contain the vast majority of sulfate, organic, ammonium, and nitrate aerosol mass.
A variety of minor but important particle types contributes to the external aerosol mixture of the lower atmosphere. The elemental carbon (EC) class include particles dominated by
is easily distinguished by a dominant sodium signal, often with calcium, strontium, other alkalis, and sodium chloride ion clusters, but without crustal metals. Mineral dust (MD) spectra are identified from multiple crustal metal signatures such as silicon, aluminum, iron, and calcium and often con-tain trace amounts of alkalis, barium, tin, antimony, or lan-thanides. This category is more heterogeneous than other classes and contains many different sub-types of spectra, rep-resenting a wide variety of mineralogies. Meteoric material (MT) is identified by iron, nickel, and magnesium within par-ticular intensity ratios (Cziczo et al., 2001) and without other crustal material, and it is usually accompanied by strong sul-fate signatures. The alkali salt (KS) category is reported here for the first time. The spectra for this class contain potas-sium and other alkali metals but no crustal material, and very low organic signatures distinguish them from biomass burn-ing particles. Despite the similarity to biomass burnburn-ing parti-cles they are not enhanced in smoke plumes. The spatial and vertical patterns of these particles suggest primary continen-tal emissions, but their exact source is still uncertain. Their size is exclusively submicron, which suggests they are not a type of mineral dust. The KS class constitutes 0.1 %–0.5 % of accumulation-mode particles over the US and < 0.1 % in the remote troposphere. Heavy fuel oil combustion particles (FO) are readily identified by strong vanadium signatures mixed with sulfate, organics, and sometimes iron or nickel (Ault et al., 2010; Divita et al., 1996). Spectra not identi-fied as any of the above composition types are compiled into a class labeled as “Other” (OT), which contains a va-riety of minor particle types. By far the most abundant sub-type in OT is a sulfate–organic mixture with possible alkali or metallic signatures that are small and difficult to distin-guish from organic peaks. Other examples include spectra with the pyridinium ion and other amine signatures, indus-trial metals without obvious crustal components, and several types of organic-rich particles with distinct signatures that suggest unique but unknown sources. Primary biological par-ticles are currently identified from negative ion spectra only (Zawadowicz et al., 2017), and a separate particle class is not implemented. In continental air they account for ∼1 % of supermicron particles and < 0.1 % of all detected particles (Zawadowicz et al., 2019).
All particle types acquire secondary material such as sul-fate, ammonium, organics, and nitrate during atmospheric transport and aging. This secondary accumulation does not change particle assignments, except that heavy coatings may partially obscure unique signatures, resulting in a particle classified as “Other”. For example, a mineral dust particle that contains secondary sulfate, nitrate, and organic material will still be classified as mineral dust, and the derived dust mass includes the secondary material. Similarly, BB parti-cles may contain secondary material sourced from biomass burning and non-biomass burning emissions. Laboratory cal-ibrations of secondary mass spectral signatures could be used to subtract secondary mass from primary particle types. In
some cases, the chemical component that identifies a parti-cle’s source is a minor constituent. For example, particles in the meteoric class are mostly sulfuric acid by mass, and the metals from ablated meteorites only account for a few per-cent of mass. Similarly, particles from heavy fuel oil com-bustion are composed of mostly sulfate and organic material but also contain traces of vanadium and other metals that de-note their unique emission source.
3.3 Simplifying the size distribution
It is infeasible to retain the raw size resolution of the OPS for the integrated concentration analysis, since some com-mon commercial instruments report up to 50 size bins per decade of diameter. For example, to achieve a minimal com-positional representation with > 5 particle spectra in each size bin would require > 5000 spectra if acquired evenly across the instrument’s size range. Accounting for inefficient acqui-sition at the extreme size limits of the instrument and with typical single-particle mass spectra data rates of a few hertz, this would require sampling times > 1 h to display composi-tion at the native resolucomposi-tion of the OPS. Therefore, raw size bins of the optical spectrometer must be combined into fewer bins to improve time resolution but at some expense in accu-racy of the derived concentrations. Ideally, size bins are de-fined such that the composition is homogeneous within each combined bin, in which case this simplification is rigorous and introduces no error to the derived number, surface area, and volume concentrations. Induced error should be mini-mized by defining size bins such that neither the concentra-tion nor particle type fracconcentra-tions have strong gradients across a bin limit. Concentration products cannot be determined if zero PALMS spectra are acquired within any one size bin that contributes significantly to the integrated concentration from the OPS. In practice, composition gradients across size bins and statistical noise at the size range extremes generate systematic error that increases as size bins are combined and the size distribution simplified.
cases across several flight campaigns. Typical deviations are 5 %–25 % when the size distribution is represented by three or four bins.
For sampling times of a few minutes, reducing the size resolution improves the data coverage (Fig. 3b). For each flight campaign, the number of sampling periods with suffi-cient statistics to generate concentration products are plotted relative to the two-bin case. To generate concentration prod-ucts, every diameter bin that contributes significantly to the total volume must include ≥5 PALMS spectra. The three-or four-bin approach offers a good trade-off between reason-able time resolution and data coverage (65 %–85 % for three bins) while still yielding particle volume and mass concen-trations whose systematic errors are less than or equal to typ-ical volume uncertainties of a particle spectrometer (Kupc et al., 2018). Small particle detection efficiency (see Sect. 3.6) was worse for DC3 than for SEAC4RS, resulting in a steeper reduction in data coverage between three and four diameter bins. For DC3 the lower sensitivity to small particles results in more sampling periods with less than five particles in the smallest size bin, so that relative data coverage with four diameter bins is 25 %–50 % compared to SEAC4RS with 65 %–75 %.
Figure 3a suggests that induced errors are not a simple function of a particular atmospheric environment. Instead, most of the variability for any given bin count is due to sparse data within a single size bin or composition inhomo-geneity across a size bin limit. The choice of size binning and time resolution when deriving integrated products can be altered based on both these conditions. Three size bins, where one bin encompasses the entire accumulation mode, are adequate for many tropospheric sampling environments (Fig. 2b). When certain external mixtures are apparent, it is recommended to split the accumulation mode into two size bins. For instance, biomass burning particles and me-teoric or other stratospheric particles occupy the larger end of the accumulation mode, D> 200 nm, whereas secondary sulfate–organic particles typical of the upper troposphere can be smaller,∼60–150 nm (Fig. 2d).
The PALMS size range encompasses the majority of accumulation- and coarse-mode size ranges under most at-mospheric conditions (Fig. 2). Exceptions include the marine boundary layer and strong mineral dust plumes that often contain particles larger than ∼4 µm, and very clean upper tropospheric conditions, where number and volume contri-butions can be significant for sizes below the PALMS range, e.g.,Dve< 150 nm. In the latter case for example, the lower size bin limits for the concentration analysis can be set to fully include the lower end of the accumulation mode, e.g.,
Dve(bin1)=60–250 nm. The PALMS composition averages applied to that bin will be biased to the larger end of the bin (Dve∼150–250 nm), but PALMS fractions are applied to the entire bin as usual. The total concentration is still accu-rately measured by the particle spectrometer, but the PALMS composition is effectively extrapolated to sizes outside of the
Figure 3. (a)Error in integrated volume introduced by reducing the size resolution of the analysis. Integrated volume was calculated for every PALMS particle class over several long flight segments with externally mixed but constant composition. Volumes computed at full diameter resolution (25–29 bins) provide a reference, and the average deviation for populous particle classes (contributing > 5 % of volume) is plotted as bins are combined.(b)Lines show the rel-ative data coverage, defined as the number of time periods with > 5 particles in every diameter bin, using three different raw sampling times for two flight campaigns.
3.4 Response of optical particle spectrometers (OPSs) to composition
The optical scattering response of an aerosol particle de-pends on its size, shape, refractive index, and the light col-lection geometry of the spectrometer instrument. Size distri-butions derived from optical particle spectrometers are based on the assumption of a fixed refractive index and spherical shape to translate the optical response of the measured parti-cle population into volume-equivalent diameter,Dve≡Dopt. A typical atmospheric air mass contains an external mixture of several diverse particle types. Fortunately, the real refrac-tive indices for background tropospheric environments have been observed to fall within a narrow range (n≈1.50–1.56 at mid-visible wavelengths) such that ambient particle size measurements are not strongly affected by this assumption (Hand and Kreidenweis, 2002; Liu et al., 2008; Müller, 2002; Espinosa et al., 2017; Shingler et al., 2016; Yamasoe et al., 1998). Ammonium sulfate and ammonium nitrate (n=1.53 and 1.56 atλ=532 nm, respectively) are common inorganic constituents. Visible refractive indices (n-ki) have been de-rived for mineral dust aerosol from a variety of field mea-surements and typically range from aboutn=1.52–1.58 and
k∼0.001–0.01 (Balkanski et al., 2007; Dubovik et al., 2002; Kandler et al., 2011; McConnell et al., 2010; Müller et al., 2010; Petzold et al., 2009; Schladitz et al., 2009), with ab-sorption increasing at shorter visible wavelengths. Pure min-eral samples can exhibit higher variability. Many retrievals for ambient organic aerosol material fall within typical inor-ganic refractive indices (Aldhaif et al., 2018; Kassianov et al., 2014; Espinosa et al., 2017; Shingler et al., 2016), al-though some laboratory surrogate species and a few atmo-spheric organics can have a wider range,n≈1.47–1.65 (Di-nar et al., 2007; Dubovik et al., 2002; Hoffer et al., 2006; Rizzo et al., 2013; Schkolnik et al., 2007). Sulfuric acid, which is abundant in the stratosphere and sporadically in the troposphere, has a much lower refractive index ofn=1.44 at 532 nm (Luo et al., 1996). Sulfuric acid aerosol also retain water (n=1.33 at 532 nm; Daimon and Masumura, 2007) even at low RH, making it a predominant outlier to typical refractive indices. Kupc et al. (2018) investigated the poten-tial systematic error in prescribing the wrong refractive in-dex to a representative upper tropospheric aerosol popula-tion. The difference in aerosol volume assuming pure ammo-nium sulfate (n=1.54) versus sulfuric acid (n=1.44) was only 12 %, which is lower than a typical aggregate volume uncertainty.
Few atmospheric particle types are strongly absorbing, and the complex index of refraction (k) for an ambient popula-tion is assumed to be zero. Several exceppopula-tions follow. Par-ticles containing elemental carbon (EC), presumably in the form of black carbon (BC), typically account for < 1 % of accumulation-mode mass in the background atmosphere but up to ∼10 % inside wildfire plumes (Andreae and Mer-let, 2001). The refractive index of pure black carbon has
high variability, e.g., with n-ki =1.74–0.44i (Hess et al., 1998), 1.95–0.79i(Bond and Bergstrom, 2006), and 2.26– 1.26i(Moteki et al., 2010). Although their measured diame-ters can be erroneous by > 10 % (Kupc et al., 2018), the net error on total aerosol number and mass is typically much lower due to their small relative population. Hematite min-eral also has a unique refractive index (2.5–1.0iat 405 nm; Sokolik and Toon, 1999), but PALMS data indicate that pure hematite particles are extremely rare in the atmosphere.
Figure 4. Using Mie theory to translate the response of an opti-cal particle spectrometer between particles of different refractive index.(a)Calculated scatter intensities atλ=663 nm for PSL and effloresced ammonium sulfate (AS) particles in the LAS instru-ment. PSL diameters are translated into ammonium sulfate diam-eters of the same scatter intensity using the Mie response curves, shown conceptually with grey arrows. The diameter ratio is plot-ted on the right axis. Smoothing must be applied to the Mie curves (inset in a, dashed line) in order to yield unique diameter transla-tions.(b)A calibration curve derived from PSL particle standards (dashed black) is translated into an ammonium sulfate calibration curve (solid black) using Mie theory. Size-selected AS particles yield a directly measured AS calibration curve (solid red) to com-pare with the PSL-derived AS calibration curve.
Highly non-spherical particles such as some mineral dusts and black carbon aggregates have different scattering intensi-ties and phase functions compared to their volume-equivalent spheres. The effect on the angular scattering pattern is not consistent across different shapes and cannot be described by any simple measure of asphericity (Curtis et al., 2008; Mishchenko et al., 1997; Moteki et al., 2010; Peter and Michael, 1988). In general, the wide variety of atmospheric
mineral dust morphologies will produce a diverse scattering response for particles with the sameDve, with the princi-pal effect of increasing the uncertainty in optically measured diameters. The degree to which sizing accuracy is affected depends on the degree and distribution of particle aspheric-ity, surface roughness, the local steepness of the scattering intensity curve, and the angular collection geometry of the spectrometer. For particles that are freely rotating and not aligned with the instrument sample flow, as is the case near atmospheric pressure, optical mis-sizing may be minimized because the scattering response is an average of multiple par-ticle orientations. In the current treatment all parpar-ticles are as-sumed to be spheres for the purposes of optical sizing. 3.5 Particle densities and dynamic shape factors PALMS measures the aerodynamic diameter,Da, for > 90 % of the chemically analyzed particles. For each particleDais converted to a volume-equivalent diameter, Dve, using the particle densityρ, dynamic shape factorχ, and the Cunning-ham slip correction factor,Cc.
Dve=
χ ρ
0Cc(Da)
ρCc(Dve)
β
Da (1)
In the limit of continuum flowβ=0.5, and for free molecu-lar flowβ=1 (DeCarlo et al., 2004). Particles exit the aero-dynamic focusing lens at approximately 35 hPa and accel-erate into a vacuum region at∼0.25 hPa where their aero-dynamic size is measured by the time difference in scatter-ing events from two laser beams spaced 33.1 mm apart. Dur-ing acceleration, particles have Knudsen numbers of 1–20 and therefore experience flow that is near the free molec-ular regime. A comprehensive model that considers transi-tional flow is used to convert aerodynamic diameter mea-sured by PALMS toDve (Murphy et al., 2004a). For sub-micron particles the model predictsβ> 0.89, such that the measured aerodynamic diameter is near the free molecular limit (Da∼Dva). As size increases beyond ∼1 µm, parti-cle motion in the PALMS inlet becomes more transitional, e.g., β=0.75 for 3 µm. The dynamic shape factor under these conditions for most particles is close to the vacuum shape factorχv, which can deviate significantly from shape factors measured at atmospheric pressure (Alexander et al., 2016; Dahneke, 1973a, b). We further discuss free molecu-lar shape factors for mineral dust below. Dry particle densi-ties and shape factors for each composition class are listed in Table 1. Particle density for each measured particle is deter-mined using one of three methods: (1) prescribed based on literature values for the observed particle type, (2) calculated using prescribed values for pure particle sub-components and their relative component abundance, or (3) estimated here us-ing simultaneous optical and aerodynamic measurements.
reasons: (1) the particle stream is wider than the laser cross section so that particles experience inconsistent laser inten-sities, (2) Mie oscillations produce a relatively flat scattering intensity from 0.5 to 1.0 µm, and (3) the photomultiplier sig-nals begin to saturate at Dve> 0.6 µm. However, when av-eraged over hundreds of particles, the scattering response yields information about particle density, shape, and refrac-tive index for submicron sizes (Moffet and Prather, 2005; Murphy et al., 2004a). Figure 5 shows simultaneous PALMS measurements of optical scattering intensity (Iscat) and aero-dynamic diameter from one scattering laser for several differ-ent particle classes. For a givenDve, a higher particle density translates into larger Da values, yielding an Iscat–Da curve further toward the right side of the graph. A larger shape fac-tor will shift curves further to the left.
After converting each particle’sDatoDve, the scattering curves converge forDve< 0.5 µm (Fig. 5b). A single relation-ship is expected between physical diameter and optical scat-tering intensity for all spherical particle types with similar refractive index. TheIscat–Daanalysis in Fig. 5b helps vali-date prescribed densities and shape factors for known parti-cles and also provides guidance for unknown particle types. Particle types with known density and shape factors, such as pure sulfuric acid, ammonium sulfate, and known organic species, act as internal standards.
All particles in the non-refractory classes (SO, BB, MT, FO) are internal mixtures of sulfate, organic material, and other minor components. Density is calculated for each par-ticle in these classes as a weighted average of the pure com-ponent densities using the measured organic-to-sulfate mass fraction (see Sect. 3.7). Nitrate content is not considered in deriving density because nitrate is difficult to differentiate from ammonium and other nitrogen species in PALMS pos-itive ion spectra. In regions where ammonium nitrate is the dominant aerosol constituent, particle density and water con-tent can be similarly calculated (Clegg et al., 1998) using an estimated aerosol nitrate or total nitrogen calibration.
Density values for ammonium-sulfate–water and sulfuric-acid–water solutions are calculated at the temperature and RH of the instrument inlet (Clegg et al., 1998; Vehkamäki et al., 2002; Wexler, 2002). Sulfuric acid can retain ∼
10 %–20 % water even under very dry (RH1 %) sam-pling conditions, although additional water evaporation will take place in the PALMS low pressure inlet and vacuum region (Murphy, 2007; Zelenyuk et al., 2006a). The den-sity for pure organic material is prescribed as 1.30 g cm−3 for SEAC4RS (Fig. 5) and other continental sampling cam-paigns, approximately the middle of a range of typical val-ues observed in continental air, 1.2–1.45 g cm−3(Cross et al., 2007; Turpin and Lim, 2001; Vaden et al., 2011; Zelenyuk et al., 2010, 2015). Organic density increases with oxidation level (Kuwata et al., 2012) as particles age in the atmosphere. Consequently, for the ATom remote troposphere anIscat–Da analysis like Fig. 5 indicates higher average organic densi-ties of 1.35–1.45 g cm−3. The density of organic material in
biomass burning has a similar range, 1.2–1.45 g cm−3(Reid et al., 2005; Zelenyuk et al., 2015; Zhai et al., 2017), and 1.25 g cm−3 is prescribed here for continental US sampling and 1.35 g cm−3for the ATom campaigns.
Refractive index differences affect the vertical position of the curves and shift the size where the optical response flattens out. Mie scattering intensity curves are plotted to demonstrate the effect of refractive index in Fig. 5c. For the PALMS wavelength and collection geometry, increasing the real and decreasing the imaginary refractive index gives increased scatter intensity forD< 0.5 µm. Large deviations beyond the typical range of 1.44–1.54 for atmospheric con-stituents are required to shift the response curve beyond typ-ical variability. Elemental carbon stands out due to its large real refractive index and strong absorption. For most particle types, theIscat–Da curves are far more sensitive to density and shape parameters than the refractive index.
Elemental carbon (EC) particles are assumed to be com-posed of black carbon (BC), and particle density is prescribed at 1.8 g cm−3 based on the density for pure BC of 1.8– 2.1 g cm−3(Bond and Bergstrom, 2006; Lide, 2016; Park et al., 2004). Shape factors for EC particles in this size range will vary widely depending on the morphology of aggregates. Uncoated BC particles haveχtvalues that range from 1.0 to > 3.0 depending on size (Khalizov et al., 2012; Slowik et al., 2007).χv=2.0 is prescribed here, based on the assumption that relatively pure EC may exist as chain aggregates that have not fully collapsed into a quasi-spherical shape (Schnit-zler et al., 2014). The density and shape factors for EC are less well constrained than other particle classes since the unique refractive index renders theIscat–Daanalysis ineffec-tive (Fig. 5b), and uncertainties in derived concentrations are accordingly higher.
Figure 5.PALMS simultaneous optical and aerodynamic diameter measurements during the SEAC4RS airborne campaign.(a)Raw scatter intensities versus measured aerodynamic diameters for populations of different particle classes. Curves toward the right side represent particle with higher density/shape factor ratios, and a large real refractive index shifts curves upwards for these sizes. Sub-populations of the sulfate– organic–nitrate particle class are plotted for nearly pure (mass fraction > 0.9) organic (green) and sulfate (red) particles. Lines are the average of 100–72000 particle measurements.(b)Aerodynamic diameters are converted to volume-equivalent diameters by prescribing density and shape factors to each particle. Divergence atD> 0.5 µm is due to Mie resonances, which are highly sensitive to refractive index.(c)Calculated Mie scattering intensities atλ=405 nm are plotted for different refractive indices (n-ki) that correspond to composition classes.
analysis. TheIscat–Daanalysis indicates that the heated sea salt fully effloresced and, assuming a dynamic shape factor ofχv=1.08 (Beranek et al., 2012), had a density of 1.8 (see Fig. S3). We presume that efflorescence was complete during the 2–3 s residence time in the actively dried transfer tubing prior to sampling with optical particle spectrometers.
Mineral dust particle densities for the large majority of crustal minerals are typically 2.5–2.65 g cm−3(Davies, 1979; Kandler et al., 2009; Linke et al., 2006), with a few subtypes such as hematite having higher values. Shape factors are in-variablyχt> 1 with a typical range of 1.3–1.5 (Davies, 1979; Kulkarni et al., 2011; Linke et al., 2006).χt denotes the dy-namic shape factor measured at atmospheric pressure, which is in transitional flow but near the continuum flow limit, i.e.,
χt(1 atm)∼χc. Most ambient mineral dust is coated by sec-ondary organic and inorganic material, which reduces both particle density and shape factor. Preliminary PALMS labo-ratory studies indicate that typical organic coatings add 5 %– 10 % to the mass of ambient dust particles, which reduces the density of a 2.65 g cm−3dust particle to 2.4–2.5 g cm−3and will also reduce the shape factor slightly. However, prescrib-ing a density of 2.5 and shape factor of 1.4 yieldsIscat–Da curves for dust that are clearly not consistent with other par-ticle types (Fig. S3). To achieve internal consistency, dust must either be prescribed an implausibly low particle density of∼2.0 g cm−3or a larger shape factor. Based on theIscat–
Daanalysis a density of 2.5 g cm−3andχvof 1.6–1.8 is pre-scribed to all ambient dust particles. Large shape factors for ambient mineral dust are discussed in Appendix B.
Scattering intensities and sizes for additional particle types from Table 1 are shown in Fig. S3. Biomass burning par-ticles are ∼80 %–90 % organic material by mass soon af-ter emission (Cubison et al., 2011; Levin et al., 2010; May et al., 2014), and they acquire sulfate, ammonium, and
ni-trate upon further aging, whereby density increases to 1.4– 1.5 g cm−3. In the stratosphere meteoric particles are nearly pure sulfuric acid (∼1.7 g cm−3) with small meteoritic inclu-sions, and they acquire organic material upon mixing into the troposphere, whereby their density decreases. Particles from heavy fuel oil combustion are mostly composed of mixed sulfate and organic material with trace industrial metals and typically have a density of 1.3–1.6 g cm−3. As stated above, for the concentration analysis, individual particle densities for these three classes (BB, MT, FO), as well as sulfate– organic–nitrate particles (SO) are calculated from relative sulfate and organic mass (see Sect. 3.7). Alkali salts have a density/shape factor ratio of approximately 1.5, which, assuming spherical shape, is well below the 2.0–2.6 g cm−3 density typical of crystalline alkali sulfates, chlorides, car-bonates, or oxides. It is possible that like sea salt, these alkali salt mixtures have not fully effloresced during sampling, and the retained water lowers their particle density.
3.6 Detection efficiency
di-agnostic to assess SPMS performance over the dominant size modes in the aerosol distribution.
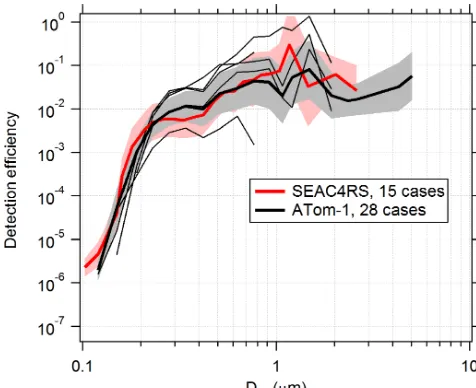
PALMS detection efficiencies are calculated for flight seg-ments with fairly constant and low concentration (about < 0.1 µm3cm−3), when the particle rate is not limited by hardware or software and therefore dead time is minimal. MeasuredDais converted toDvefor all particles, and the to-tal counts in each size bin are converted to an apparent con-centration using the PALMS flow rate and sampling time. The PALMS observed concentrations are divided by OPS concentrations to determine detection efficiency. Figure 6 shows detection efficiencies for two airborne campaigns. Al-though the curves show that average instrument performance is similar across different campaigns, variability within and between individual flights can be large. Within any given flight, the detection efficiency at a particular size routinely varies by ×2–×5, and variations of >×10 are not uncom-mon between flights. This variability is due to a variety of the factors listed above, many of which change with ambi-ent pressure. In particular, changes in the overlap between the particle beam and laser beams will dramatically affect the detection efficiency for all sizes or a range of sizes. This variability in detection efficiency affects all particle classes nearly equally for a given particle size. A reduced detection efficiency does not directly impact particle type concentra-tions, but it can increase the statistical uncertainties and sam-pling time required to generate concentration products.
A tempting alternative to the method presented here (com-bining SPMS data with coincident size distribution mea-surements) is to determine the SPMS particle detection ef-ficiency as a function of size under controlled conditions, and then multiply this curve by the airborne size-dependent data rate to yield a quantitative particle concentration, sim-ilar to SPMS scaling methods used at ground sites (Bein et al., 2006; Jeong et al., 2011; Pratt et al., 2009b; Shen et al., 2019). However, this approach is not recommended due to many possible pitfalls and large, unquantifiable errors. The key drawback is that the detection efficiency curve for PALMS and other SPMS instruments is extremely steep as it ascends several orders of magnitude across the accumulation mode fromD∼0.1 to 0.5 µm, where particle number con-centrations are also changing by orders of magnitude. The multiplication of these two strong functions, combined with the inherent variability over different ambient conditions and instrument alignment, will produce large and intractable un-certainties, e.g., >×10 in mass. Other problems include the following.
– Both the measurement of detection efficiency and its ap-plication to derive concentrations are only valid when the particle data rate is not artificially limited by soft-ware or hardsoft-ware or when instrument dead time can be accurately determined. In practice, aerosol concentra-tions in many lower tropospheric condiconcentra-tions and partic-ularly inside plumes are high enough that SPMS
sys-tems will far exceed their maximum acquisition rate and generate erroneously low concentrations.
– Small changes to the alignment of the particle beam with the detection lasers, ionization laser, and ion ex-traction optics, which are not uncommon on airborne platforms, have a large effect on particle detection effi-ciency. Detection efficiency must also be re-determined after any routine alignment adjustments. For PALMS the second detection laser beam is only∼150 µm wide. – The flow characteristics of pressure reduction orifices change with upstream (ambient) pressure, changing par-ticle trajectories downstream of the orifice in ways that are very sensitive to physical alignment and may not vary smoothly with pressure. One example is that pressure-controlled inlets can act as virtual impactors that enhance concentrations above a certain particle size that is both difficult to define and changes with pressure. – Upstream pressure reduction orifices routinely accu-mulate small amounts of aerosol material that subtly change particle trajectories with large impacts to detec-tion efficiency (Fig. 6).
The approach described in Sect. 3.1, mapping the PALMS composition measurements to independently measured size distributions without the need to determine size-dependent detection efficiencies, circumvents these complications. 3.7 Sulfate and organic mass concentrations
In addition to deriving concentrations for individual particle classes, the subcomponents of internally mixed particles can also be quantified. Signal intensity ratios in PALMS mass spectra for components of interest are calibrated to known mass fractions in laboratory-generated aerosol standards. By combining these calibrations with the particle class concen-trations described here, absolute mass fractions for aerosol subcomponents such as sulfate and organic material can be determined. For instance, the average sulfate mass fraction is first determined for all non-refractory particle classes us-ing mass spectral signal ratios, and then this mass fraction is multiplied by total mass concentration of those particle classes to yield an aerosol sulfate mass concentration. The resulting mass concentrations for sulfate, organic material, metals, or other components can be compared directly to bulk composition measurements from instruments such as the AMS, SAGA, or a variety of offline analytical methods (see Sect. 4.1).
solu-Figure 6.Detection efficiency curves for the PALMS instrument in flight. Detection efficiency was calculated for several cases, iden-tified as clean flight segments when the particle data rate was not actively limited by software or hardware. Thick lines and shading are geometric means and standard deviations over all cases. Higher efficiencies forDve> 3 µm during ATom are partly due to addition of a virtual impactor upstream of PALMS. Thin black lines are five individual cases during one ATom-1 flight. Variations in altitude, particle composition, inlet performance, and unknown factors re-sult in detection efficiencies that vary by >×10 within and between flights. The lowest thin line was a case where a buildup of aerosol material on the pressure reduction orifice altered particle trajecto-ries inside the inlet.
tions were nebulized to generate a submicron aerosol popula-tion that was dried to RH < 40 % and sampled with PALMS. Solutions were composed of ammonium sulfate mixed with varying amounts of sulfuric acid, sucrose, and mixed di-carboxylic acids (see Table S1 in the Supplement). Positive spectra were very similar to free tropospheric aerosol spectra in the SO particle class, confirming that the ionization en-vironment for calibration particles is representative. Another set of calibration solutions contained ∼1 % potassium and generated particle spectra that were very similar to biomass burning aerosol in the atmosphere. Relative intensities were summed for C+, CH+, CO+, and C+3 ions to represent the total organic signal. In PALMS, these ions comprise > 90 % of the total organic ion intensity in positive spectra for nearly all non-refractory particles in the atmosphere. This efficient conversion of organic material into a few simple ion species demonstrates a weak dependence of the principal mass spec-tra signatures on organic aerosol species and facilitates cal-ibration across different particle types. The C+2 ion was ex-cluded here due to interference with Mg+ in the meteoric class. The sulfate signal is the sum of S+, SO+, and SO+2 ion intensities, and it is similarly consistent across non-refractory particles.
Figure 7a shows the PALMS response as a function of aerosol organic mass fraction. The organic signal fraction, sforg, defined as the intensity ratio of organic peaks/(organic +sulfate peaks), is fit to the organic mass fraction mforg us-ing the followus-ing functional form.
mforg=
morg
morg+msulf
= sforg
α+sforg(1−α)
(2)
The single parameterαrepresents the relative ionization ef-ficiency (RIE) of organic material to sulfate. No systematic differences were found in the PALMS response to organic and sulfate mixtures with and without potassium, indicating that organic and sulfate ionization is fairly consistent across different ionization environments in non-refractory particles. The calibration fit is applied to the signal fractions in Fig. 7b. The organic mass fraction for individual particles can have large errors due to the inherent particle-to-particle variabil-ity in SPMS spectra. However, errors are quickly reduced when averaging over a population of particles. To estimate precision uncertainty, particles were arranged into groups of increasing size, and the average organic mass fraction for each population was compared to the solution mass fraction, Fig. 7c. The relative standard deviation converged to 8 % when averaging≥15 spectra, and errors exhibited no trend with mass fraction (not shown). Coincident with PALMS, an Aerodyne AMS using a quadrupole mass analyzer (Jayne et al., 2000) measured sulfate and organic mass of the generated aerosol. In Fig. 7b, average mass fractions from the AMS show similar deviations from the 1:1 line to the PALMS av-erages.
Figure 7.PALMS calibration of organic mass fraction for atmospheric aerosol surrogates composed of neutralized and acidic sulfate mixed with a variety of organic compounds (see Table S1). Blue points are ammonium sulfate–sucrose–adipic-acid solutions, and red points are ammonium-sulfate–sulfuric-acid–dicarboxylic-acid solutions.(a)Raw signal fractions (dashes) are fit to the solution organic mass fraction data (dotted line). Symbols are averages of 130–1900 spectra.(b)Calibrated organic mass fractions from PALMS (red and blue) confirm a linear response, with averages that exhibit similar deviations to a quadrupole AMS. The dotted line is a linear fit to PALMS data forced through zero.(c)Relative error (standard deviation/mean) for all calibration points as a function of the population size used to calculate the average.
Primary sulfate on sea salt or mineral dust, as well as sec-ondary sulfate accumulated on other particle types, is not in-cluded in the calibration because sulfate ionization on refrac-tory particles is complicated by interferences and stronger matrix effects. The analysis assumes that dry aerosol mass is composed entirely of organic and sulfate material. Con-stituents like ammonium, nitrate, chloride, and alkali met-als are disregarded. In most free tropospheric environments these components account for a small fraction of the aerosol mass. In the continental boundary layer or under polluted conditions, higher levels of ammonium and nitrate will intro-duce a high bias to the derived organic and sulfate mass con-centrations. Future calibration studies can address the aerosol total nitrogen content from positive spectra or nitrate content using negative spectra.
4 In-flight performance
4.1 Comparison to other aerosol composition measurements
Figure 8 compares PALMS mass concentrations for sulfate and mineral dust with other online and offline techniques dur-ing routine airborne measurements. PALMS sulfate mass is calculated as the sum of all non-refractory particle types (SO, BB, MT, and FO), accounting for the sulfate mass fraction of each particle type (Sect. 3.7). PALMS sulfate mass concen-tration shows excellent agreement with other airborne sulfate measurements over several orders of magnitude (Fig. 8a). For the AMS comparison the PALMS and LAS size ranges are truncated using the AMS size-dependent lens transmis-sion efficiency, which is similar to that reported in Hu et al. (2017).
qual-Figure 8.Comparison of PALMS with other speciated aerosol mass measurements.(a)PALMS derived sulfate mass at 3 min time resolution compared to co-located AMS and SAGA filter samples during the ATom-1 airborne campaign. Sea salt sulfate (0.25×Na+) is subtracted from SAGA data. SAGA filters taken over an altitude range > 3 km are excluded. Small points are 3 min averages (blue) or represent one SAGA filter measurement (orange). Large symbols are medians with interquartile error bars. The solid black line is 1:1, and grey dashed lines are 1:1.5 and 1:2. The inset graph is a histogram of PALMS ratio to AMS or SAGA for all individual samples. PALMS sulfate(b) and mineral dust(c)mass are compared to nearby IMPROVE ground station data for three airborne campaigns. Each point is the average of airborne data for non-targeted flight segments in the continental boundary layer within 0.5◦latitude and 1◦longitude of an IMPROVE site that reported data that day. IMPROVE data are 24 h averages, and airborne segments are typically∼3–30 min duration during daytime. Error bars are estimated statistical uncertainty calculated as described in Appendix A. Dashed lines are weighted linear fits.
itative agreement and positive correlation in Fig. 8c furthers confidence in the ability of PALMS to measure absolute min-eral dust mass concentrations.
4.2 Examples of mineral dust mass over the US
To demonstrate the utility of the new quantification method, we calculate the average mineral dust mass over the con-tinental US. Figure 9 compares PALMS mineral dust mass concentrations for four airborne campaigns that span differ-ent regions and seasons. In general, the large majority of dust mass was present in the coarse mode, Dve> 1 µm. For the summertime campaigns, concentrations decrease steadily with increasing altitude, suggesting that dust was emitted from regional sources and removed during vertical trans-port. For the DC3 campaign the dust maximum occurred in the mid-troposphere. This profile is consistent with Asian dust sources contributing significantly to springtime US dust loadings (Chin et al., 2007) and also to convective lofting of dust. The MACPEX campaign targeted large-scale convec-tive systems. The dust mass increase at 11–12 km is consis-tent with deep convective outflow. For the SEAC4RS, DC3, and NEAQS campaigns, the aircraft inlets and aerosol instru-mentation measured sizes up to 4 µm and captured nearly the entire coarse mode. An exception was a weak Saharan dust plume encountered over the Gulf of Mexico, where external cloud–aerosol probes showed particles up to 20 µm. Future publications will explore mineral dust abundance and geo-graphic distributions over continental and remote regions.
5 Summary and recommendations
We present a new method to measure composition-resolved aerosol size distributions and quantitative concentrations us-ing sus-ingle-particle mass spectrometry (SPMS) combined with absolute particle concentration measurements. Novel approaches include simplifying the size distribution into a few size bins guided by compositional transitions, applying density and shape factors that are validated using optical– aerodynamic sizing consistency to each particle, and avoid-ing the reliance on SPMS detection efficiency to gener-ate concentration products. Using this method PALMS can determine particle type concentrations for sample periods that are > 10 times shorter than previous studies, and under ambient aerosol loadings that are > 100 times lower. This method is successfully applied to background free tropo-spheric conditions with typical time resolutions of a few min-utes, thereby introducing a critical new capability for fast-response measurement of mineral dust aerosol concentration from aircraft platforms. Other common refractory and non-refractory particle concentrations are also determined, in-cluding sea salt, sulfate–organic internal mixtures, biomass burning, heavy fuel oil products, and aerosol chemical com-ponents distributed across many particle types such as sulfate and organic material.
The principal strengths of this approach are summarized below.
Figure 9.Vertical profiles of PALMS mineral dust mass(a)and mass fraction(b)over the continental US forDve> 0.1 µm. Lines are cam-paign average concentrations binned at 1 km intervals from products generated at native resolutions of 3 min (SEAC4RS, DC3, NEAQS) or 5 min (MACPEX). Biomass burning plumes and clouds are excluded. By truncating the size range using a typical cyclone impactor trans-mission curve withDa(50 %)=2.5 µm (http://www.urgcorp.com/, last access: 26 October 2019), these mass concentrations are equivalent to a PM2.5measurement. The MACPEX size range is limited by the optical particle spectrometer toDve< 1.5 µm. Positive error bars are one standard deviation.
– Particle types and sub-types can be defined flexibly to suit a particular science objective, e.g., particles of stratospheric versus tropospheric origin. Definitions can be refined to characterize newly discovered particle types.
– There is a fast time response on the order of 1–5 min for concentrations of∼10 ng m−3(see Appendix A). – Intermittent clouds, plumes, or other events within a
sample period can be excluded at high time resolution, e.g., 1 s.
– Concentration products can be derived for many histor-ical PALMS and other SPMS datasets that have coinci-dent particle size distribution measurements.
– The size distribution measurement can employ any of several standard sizing techniques (Dopt,Dmob,Da), for which many commercial units are available.
– Stable SPMS detection efficiency is not a prerequisite. Variations in size-dependent detection efficiency due to different sampling conditions or instrument configura-tions only affect the product time resolution and un-certainty, not the derived concentrations. The alterna-tive method that scales observed SPMS detection rates by fixed detection efficiencies results in large, unquan-tifiable uncertainties in integrated number, surface, and volume.
PALMS differentiates externally mixed particle types based on mass spectral signatures. Climate-relevant particle types
such as mineral dust, biomass burning, and sea salt are read-ily distinguished, giving PALMS and other SPMS instru-ments the unique capability to measure these important pri-mary aerosol species with high time and size resolution. Quantification of rare types from unique emission sources is also possible, such as industrial metallic particles and bioaerosol. In addition to concentrations for individual par-ticle classes, calibration of mass spectral signal ratios al-lows for quantification of sub-components within a particle class or across several classes. Aggregate sulfate and organic masses are determined here by summing the contributions over the non-refractory particle classes.
Time resolution and statistical accuracy for aircraft stud-ies are primarily limited by the data acquisition rate across the entire accumulation and coarse modes. Reducing native size resolution to 3 or 4 bins improves sampling statistics and allows for faster time resolution, while introducing modest systematic errors (typically 5 %–25 % in volume).