R E S E A R C H A R T I C L E
Open Access
Adaptation of the Grasha Riechman
Student Learning Style Survey and
Teaching Style Inventory to assess
individual teaching and learning styles in a
quality improvement collaborative
James H. Ford II
1*, James M. Robinson
1and Meg E. Wise
2Abstract
Background:NIATx200, a quality improvement collaborative, involved 201 substance abuse clinics. Each clinic was randomized to one of four implementation strategies: (a) interest circle calls, (b) learning sessions, (c) coach only or (d) a combination of all three. Each strategy was led by NIATx200 coaches who provided direct coaching or facilitated the interest circle and learning session interventions.
Methods:Eligibility was limited to NIATx200 coaches (N= 18), and the executive sponsor/change leader of
participating clinics (N= 389). Participants were invited to complete a modified Grasha Riechmann Student Learning Style Survey and Teaching Style Inventory. Principal components analysis determined participants’preferred
learning and teaching styles.
Results:Responses were received from 17 (94.4 %) of the coaches. Seventy-two individuals were excluded from the initial sample of change leaders and executive sponsors (N= 389). Responses were received from 80 persons (25.2 %) of the contactable individuals. Six learning profiles for the executive sponsors and change leaders were identified: Collaborative/Competitive (N= 28, 36.4 %); Collaborative/Participatory (N= 19, 24.7 %); Collaborative only (N= 17, 22. 1 %); Collaborative/Dependent (N= 6, 7.8 %); Independent (N= 3, 5.2 %); and Avoidant/Dependent (N= 3, 3.9 %). NIATx200 coaches relied primarily on one of four coaching profiles: Facilitator (N= 7, 41.2 %), Facilitator/ Delegator (N= 6, 35.3 %), Facilitator/Personal Model (N= 3, 17.6 %) and Delegator (N= 1, 5.9 %). Coaches also supported their primary coaching profiles with one of eight different secondary coaching profiles.
Conclusions: The study is one of the first to assess teaching and learning styles within a QIC. Results indicate that individual learners (change leaders and executive sponsors) and coaches utilize multiple approaches in the teaching and practice-based learning of quality improvement (QI) processes. Identification teaching profiles could be used to tailor the collaborative structure and content delivery. Efforts to accommodate learning styles would facilitate knowledge acquisition enhancing the effectiveness of a QI collaborative to improve organizational processes and outcomes.
Trial registration:ClinicalTrials.gov Identifier: NCT00934141 Registered July 6, 2009. Retrospectively registered.
Keywords:Quality improvement collaborative, Teaching style, Learning style, Coaches, Change leaders, Executive sponsors, Principal components analysis, NIATx
* Correspondence:jhfordii@wisc.edu
1Center for Health Systems Research and Analysis, University of Wisconsin-Madison, 610 Walnut Street, Madison, WI 53726, USA Full list of author information is available at the end of the article
Background
Quality improvement collaboratives (QIC) are widely used in healthcare organizations to improve organizational processes and client outcomes [1–5]. Such collaboratives include multiple approaches to teaching quality improve-ment to enhance participants’ knowledge, understanding and skills. A coach led QIC enlists a“coach”(teacher) to engage key people in an organization (the change team, or learners) to design, implement and sustain new processes that improve the delivery of their services [3, 5–14]. In that capacity, the coach employs multiple strategies (e.g., site visits or monthly calls) to help the change team build their skills in applying evidence-based QI tools and tech-niques to their unique circumstances. How the coach tea-ches and the change team learns—and how these work together—are the salient components in a QIC. Coaches like other teachers tailor the learning interchange to indi-vidual needs and goals and use active (e.g., a hands-on Plan-Do-Study-Act activity) vs. passive (e.g., a lecture on data collection and measurement) learning approaches to develop skills and build confidence [15–17]. The change team members must then learn to apply the skills taught. Successful learning is thus directly impacted by the quality of coaching. However, research has not assessed how a coaches’teaching style or the change leader’s learning style impacts the outcome in a QIC.
Applying both received and practice-based knowledge, versus simply acquiring knowledge, represents higher-order learning. Thus the educator’s task is to account for an individual’s learning style in a way that effectively motivates this higher-order learning process [18–21]. Medical education, where practicing physicians mentor residents, has long used this teaching and learning model [22–27]. The NIATx Change Leader Academy adapted this model by providing active learning oppor-tunities for clinical and administrative staff to become effective change leaders in their organizations [28, 29]. The change leader’s learning style and the coaches teaching style therefore are important considerations in a coach-facilitated QIC. Yet the research and practice of teaching and learning styles are focused on traditional educational settings.
The Grasha-Riechmann model integrates individual teaching and learning style and demonstrates how the stylistic qualities of teachers and students can enhance the nature and quality of the learning experience While most teachers have a preferred teaching style, they use a mix of styles to engage a wide array of learners who might prefer interactive, experiential or didactic teaching approaches [30–32]. The use of different approaches also accommodates individual preferences for different learn-ing modalities-visual, auditory, kinesthetic or tactile [33]. For example, material might be taught through a lecture using slides which is then supported by an interactive
exercise involving a small group discussion of a case study with questions or an experiential hands-on learn-ing opportunity to convey knowledge or skills. Educators who understand their preferred teaching style(s) are bet-ter able to identify and enlist a variety of teaching strat-egies, as needed [34]. Grasha-Reichmann identified five teaching (Delegator, Expert, Facilitator, Formal Authority and Personal Model) styles utilized within an educa-tional environment.
Coffield and colleagues [35] classified the Grasha Reichmann model as an approach that focused on how personal attributes (e.g., motivation) influence learning strategies, approaches and concepts associated with learning. The Grasha-Riechmann Student Learning Style Survey (GRSLSS) has been studied across a variety of educational settings [18, 21, 30, 36–43]. The survey identifies the degree to which an individual prefers each of six learning styles: (a) competitive, (b) collaborative, (c) avoidant, (d) participant, (e) dependent and (f ) inde-pendent [34]. The surveys utilized a five and seven point Likert scale respectively. Utilization of these integrated styles led to the clustering of different teaching profiles (e.g., Facilitator/Personal Model/Expert) and learning profiles (e.g., Collaborative/Participant/Independent) and the identification of particular teaching methods (e.g., guided readings, role play) could be utilized to increase knowledge transfer [34].
We utilized the Grasha-Riechmann integrated model because the learning delivery components of the NIATx200 QIC mirrored similar educational settings. The present study is nested within NIATx200, an 18-month cluster-randomized trial that was conducted in 201-addiction treatment clinics in five U.S. states [4]. Within the context of a quality improvement collabora-tive, participating clinics were assigned to one of four in-terventions facilitated by NIATx200 coaches: (a) interest circle calls, (b) learning sessions, (c) coach only or (d) a combination of all three.
The NIATx200 study involved three key players: process improvement coach, the change leader and the executive sponsor [44]. Each provider identified a change leader and executive sponsor. The change leader and executive sponsors represented the individual learners in the NIATx200 quality improvement collaborative. Within the context of the NIATx model, they fulfilled their roles and responsibilities [44] and more import-antly, they interacted with their coach and utilized their individual process of knowledge acquisition (i.e., their preferred learning profile) to translate knowledge into action.
facilitated by either one or two coaches involved a com-bination of peer to peer sharing and didactic learning opportunities. A core faculty of three coaches used a curriculum roadmap to plan and deliver content in three learning sessions per state. The coach-only intervention launched with a 1-day, in-person site visit and monthly 1-h coaching calls to support the change leader in the implementation of changes to improve the study outcomes.
The learning sessions involve multiple individuals from different organizations is similar to an educational lecture class who were taught content through didactic lectures and small group breakout sessions. Interest cir-cles divide the QIC participants into smaller groups. In these groups, content was delivered telephonically and the sessions were moderated by an assigned coach. One-on-one coaching is similar to a teacher having office hours for their students. Within the QIC, the coach worked directly with their assigned providers using in-person and monthly phone calls to deliver content. As compared to higher education’s focus on the student’s acquisition and analysis of information, coaches in QICs encourage learners to develop their capacity to lead teams that identify and solve real-life problems in com-plex organizations. The coaches’s teaching styles and the learning styles of the change leaders and executive spon-sors, thus, may be shed light on an organization’s quality improvement outcomes.
The NIATx200 implementation period lasted 18-months. Each 6 month period focused on the implemen-tation of Plan-Do-Study-Act rapid change cycles to im-prove one of the three primary outcomes: (a) decrease wait time from 1st contact to the 1st treatment session; (b) increase client retention, the percent of clients at-tending the 1st treatment session that reached the 4th session; and (c) improve the number of admis-sions. Results from the NIATx200 study found that the learning sessions, coaching and combined inter-ventions resulted in significant wait time improve-ments; coach only or combination arms increased admissions and none of the interventions improved client retention [45].
How a coach teaches and the recipient learns are crit-ical to the teaching and learning relationship in a QIC, but have not been studied or mapped to QIC outcomes. Within the context of the NIATx200 study setting, the present study adapted the Grasha-Riechmann Student Learning Style Survey (GRSLSS) and the Teaching Style Inventory (TSI) and administered these modified scales to identify retrospectively the learning styles of the change team (change leaders and executive sponsors) and the teaching styles of coaches who participated in NIATx200, a QIC involving 201 substance abuse treat-ment clinics. This paper answers the following research
question: What is the learning and teaching styles typ-ology in a quality improvement collaborative?
Methods and design
Survey modification and validation
Questions in the Grasha-Riechmann Student Learning Style Survey (GRSLSS) and the Teaching Style Inventory (TSI) were reviewed and the language modified for ap-plicability and use within QIC (see Additional file 1 for original style definitions). Modifications to the teaching style inventory included replacing words like teaching with coaching; adding modifiers like quality improve-ment or using providers or change leaders instead of students. For example, one question in the original teaching style inventory read “Sharing my knowledge and expertise with students is very important to me”and in the modified inventory, it reads,“It is very important to share my quality improvement knowledge and expert-ise with the change leader/team.” Similar changes were made for the GRSLSS. For example, an original question read,“Working with other students on class activities is something I enjoy doing” and in the modified survey, it now reads, “I enjoy working with other change team members to implement quality improvement in our organization.”The modified instruments utilized the same five point ((1 = Strongly Disagree to 5 = Strongly Agree) and seven point (1 = Strongly Disagree to 7 = Strongly Agree) Likert scales as the original Learning Style Survey and Teaching Inventory respectively.
Prior to implementation, we pilot tested the revised QICTSI and QILSS with a convenience sample of 20 change leaders and 4 coaches who did not participate in NIATx200. We also consulted with Dr. Sher (Riechmann) Hruska, a developer of the GRSLSS and TSI instruments about our modified scales. Instruments were then revised based on their input.
Measures Teaching style
The Quality Improvement Coach Teaching Style Inventory (QICTSI) consists of 40 questions, eight questions for each of the five teaching styles. Coach responses to the QICTSI assessed their attitudes and behaviors about coaching in a QIC. The QICTSI included demographic questions related to education; years of experience providing quality im-provement coaching and the number of organizations coa-ched in the past 5 years. Coaches also provided suggestions for improvements to the language or wording within the QICTSI.
Learning style
(change leaders and executive sponsors) utilized the QILSS to their rate attitudes, behaviors and preferences regarding learning styles within a QIC. Respondents also answered demographic questions and could provide sug-gestions on how to improve the language or wording of the QILSS.
Additional file 2 contains the Quality Improvement Coach Teaching Style Inventory and the Quality Improvement Learning Style Survey.
Sample size
The executive sponsor and change leader from each of the 201 participating clinics coach were invited to par-ticipate. Executive sponsors and change leaders who ful-filled the role for more than one NIATx200 clinic received only one invitation. Eighteen NIATx coaches provided direct coaching or facilitated interest circle and learning sessions.
Sampling strategy and survey administration
Each participating provider in NIATx200 identified a change leader and executive sponsor. Randomization oc-curred at the organizational level and did not involve randomization of these individuals. The coaches who served as a NIATx coach or change leader in the initial NIATx provider cohort were selected and recruited to participate in NIATx200 study and then assigned to coach organizations based on geographic proximity and within one of the two intervention arms with a direct one on one coaching component. As such, the study only bias was in which of these individuals chose to re-spond to the surveys related to learning and teaching styles.
NIATx 200 change leaders, executive sponsors and coaches constituted the sample frame for this study. Paper and electronic versions of the survey instruments were developed. Each individual participant was invited to complete either the learning style (change leader and executive sponsor) or teaching style (coach) survey. The study used a variety of approaches to contact the coa-ches, executive sponsors and change leaders including e-mails, phone calls and direct mailings.
Analytic plan
A principle components analysis (PCA) was used to examine the appropriate weighting of questions within each of the style categories. We assume that the re-sponse to each question in a style category is correlated with the subject’s preference for some aspect of that style. PCA aims to uncover the number of underlying aspects of style suggested by the responses and the strength of each question’s correlation with each of those aspects. The usual approach assumes each question is equally correlated with a single underlying preference
and, therefore, each question should be given equal weight when scoring responses. The PCA can suggest, alternatively, that the set of questions should be split into two (or more) sub-groupings, that some questions should be dropped (i.e., the weights should be zero), or (with enough observations) how the weights should vary by question within each sub-grouping. In the absence of other research suggesting the presence of different teaching and learning styles, we retained the original groupings of the 60 learning-style questions and the 40 teaching-style questions and applied PCA models to each of the resulting eleven learning/teaching style ques-tion groupings. To address small sample size issues, we simulated the PCA results for similarly sized samples where the number of underlying style aspects and cor-relation of questions to those aspects were known. The simulated PCA results were compared to the actual PCA results to assess whether the observed results were consistent with a simple hypothesis about the underlying correlation structure for the questions. This approach created two graphs for each teaching and learning style component. The first graph calculated the estimated ei-genvalues for each eigenvector in principal components analysis (PCA). For the teaching style data, the black lines are eigenvalues from ten simulated sets of 16 sub-jects and k = 8 questions under the null hypothesis, H0:
Q(i) = w X + (1-w) Z(i), where w = 30 %, X is a standard normal random variable and Z(i) is an independent standard normal random variable across i = 1,…,k. That is, all questions depend equally on a common lurking value, X, and an independent noise term, Z(i). Under H0,
the primary eigenvector should place equal weight on each question (i.e., 1/81/2= 0.354) with a corresponding eigenvalue equal to [kw2+ (1-w)2]/[w2+ (1-w)2] = 2.09. The theoretical values for the remaining eigenvalues are each equal to (k-2.09)/(k-1) = 0.85. The second graph shows the question weights associated with the primary eigenvector for each of the ten simulated samples, along with the primary eigenvector for the observed results.
Results
Respondent demographics
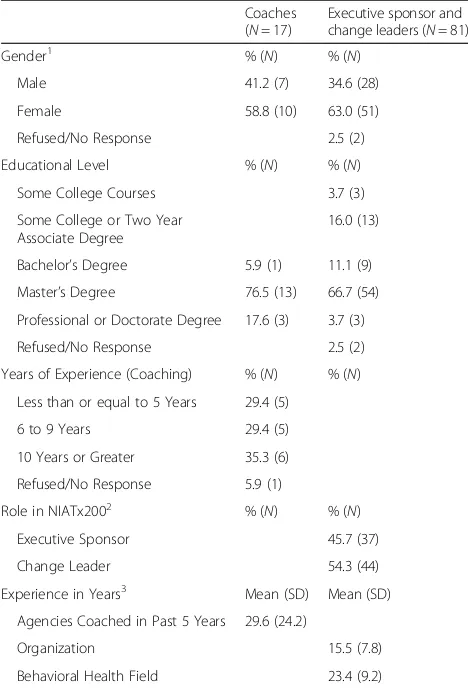
Responses were received from 17 of the eighteen (94.4 %) coaches in the NIATx200 study. Table 1 shows respondent demographics. Efforts to reach executive sponsors and change leaders were not as successful (Fig. 1 Survey Consort by Provider and Respondents). The final eligible sample size included 191 agencies and 389 respondents. Despite repeated attempts via direct solicitation, e-mail, and phone calls, responses were received from 66 providers (34.6 % of eligible providers). For the individual respondents, 14 change leaders/executive sponsors worked for agencies that had closed or dropped out of the NIATx200 study prior to implementation. 72 individuals were excluded because they represented multiple agencies or had no valid contact information. For the remaining contactable sam-ple (n= 317), 80 (25.2 %) change leaders or executive
sponsors responded. Three surveys were returned blank and excluded from the final analysis. The difference be-tween the numbers of agencies and respondents in Fig. 1 indicates that two surveys were received (change leader and executive sponsor) from 15 agencies. Table 1 shows the demographics of the coaches’as well executive spon-sors and change leaders. The majorities of respondents were female and had a master’s degree or professional de-gree. At the time of the study, coach experience was equally distributed and the coaches had worked with an average of 30 providers over the past 5 years. Approxi-mately 55 % of the respondents were change leaders in their organization. The average tenure for the change leaders and executive sponsors was 16 years with their organization and 23 years in the behavioral health field.
Principal components analysis
The results from the principal components versus simu-lated results confirmed the teaching or learning style components to explain the results, we will use the ques-tions related to theExpert Teaching Styleas an example. The first graph (see Additional file 3) indicates that the primary eigenvectors of the ten simulated samples are somewhat greater 2.09 and the remaining eigenvalues do not appear constant at 0.85. This is because the sample covariances among the simulated questions are subject to estimation error. The simulated non-primary eigen-values are distributed about 0.85. The PCA routine al-ways sorts the estimated eigenvalues from high to low, giving the appearance of a systematic decrease in ex-plained variance with each additional component. When we anticipate the is sorting effect (i.e., using the ten sim-ulated samples), we see that the pattern of eigenvalues for the actual data (related in this case to the “Expert” domain of questions) is consistent with the null hypoth-esis that equal weights are appropriate on each question in the domain. In the second graph for the“Expert” do-main, the simulated weights are distributed loosely about 0.354 and values for the observed data’s primary eigen-vector are not unusual. With only 16 subjects, the ob-served pattern of Expert question responses is not inconsistent with the assumption that equal weights are appropriate on all questions, i.e., that there is a single lurking effects shared by all of the questions. The con-clusion from the analysis for the Expert Teaching style was the presences of a single lurking shared effect, representing 30 % of the observed variation. Additional file 3 contains the complete results of the principal com-ponents versus simulated results for the Teaching and Learning styles.
Coaching styles in NIATx200
Analysis of the Quality Improvement Coach Teaching Style Inventory responses identified the presence of five
Table 1Response rate and respondent demographics
Coaches (N= 17)
Executive sponsor and change leaders (N= 81)
Gender1 % (N) % (N)
Male 41.2 (7) 34.6 (28)
Female 58.8 (10) 63.0 (51)
Refused/No Response 2.5 (2)
Educational Level % (N) % (N) Some College Courses 3.7 (3)
Some College or Two Year Associate Degree
16.0 (13)
Bachelor’s Degree 5.9 (1) 11.1 (9) Master’s Degree 76.5 (13) 66.7 (54) Professional or Doctorate Degree 17.6 (3) 3.7 (3)
Refused/No Response 2.5 (2)
Years of Experience (Coaching) % (N) % (N) Less than or equal to 5 Years 29.4 (5)
6 to 9 Years 29.4 (5)
10 Years or Greater 35.3 (6)
Refused/No Response 5.9 (1)
Role in NIATx2002 % (N) % (N)
Executive Sponsor 45.7 (37)
Change Leader 54.3 (44)
Experience in Years3 Mean (SD) Mean (SD)
Agencies Coached in Past 5 Years 29.6 (24.2)
Organization 15.5 (7.8)
Behavioral Health Field 23.4 (9.2)
1. The majority of the coaches (82.4 %) and of the executive sponsors/change leader (92.6 %) were Caucasian
2. Four respondents had dual roles (executive director or change leader) for the same provider
teaching styles within a QIC. The principal components analysis suggested the exclusion of Question 6 in both the Facilitator and Delegator coaching style (see Additional file 3, pages 4 and 5 respectively). These questions read as follows:“My coaching style encourages a change leader/team to take initiative and responsibility for their learning.” (Facilitator) and “My approach to coaching is similar to a manager of a work group who delegates tasks and responsibilities to subordinates.” (Delegator).
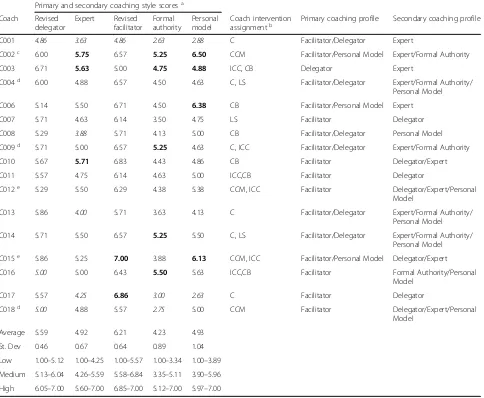
Descriptive statistics for the five coaching (i.e., teaching) styles and categories are shown in Table 2. The score distribution varied within coaching styles and across coaches. For example, the twelve of the seventeen coaches had an above average facilitator score suggesting that coaches in a QIC may prefer to use a facilitation based coaching style. The categorization of high versus low scores was distributed across the coaches with 76.5 % (13 out of 17) being in one of these categories. For example, scores for one coach (C002) placed them in the low range across all five coaching styles. However, the scores for that coach were higher for the facilitator
and delegator coaching styles perhaps indicating a pref-erence for using these two styles when coaching in a QIC. Building on the original teaching style definitions, the description and definitions of the resulting coaching styles within a QIC have been expanded and tailored to this setting (see Additional file 4).
Learning styles in a quality improvement collaborative Analysis of the Quality Improvement Learning Style Survey found that the NIATx200 change leaders and ex-ecutive sponsors preferred one of ten learning styles (Table 3). Questions related to the Independent and Avoidant learning styles as first identified by Grasha loaded onto the same two respective factors as for the NIATx 200 (QIC). For the remaining original four edu-cational based learning styles (Collaborative, Competitive, Dependent and Participatory), the PCA suggests that two learning styles existed within the NIATx 200 QIC for each of these four styles. For example, learners exhibit one of two participatory learning styles reflect-ing actively participatreflect-ing in learnreflect-ing versus participat-ing “in learning” to acquire knowledge. Table 3 also
contains the “cut-points” within each learning style. Figure 2 (Distribution of QILSS by Category) shows the percent of respondents whose score for a particu-lar learning style fell within each “cut-point” category. The average score for three of the ten learning styles, Avoidant Learner, Proximal Dependent Learner and Competitive Leader, were less than 2.50 (one-half of the maximum Likert scale value).
Table 4 compares the average Quality Improvement Learning Style Survey Learning Style score by respond-ent role, change leader (n= 42) versus executive sponsor
(n= 35), in NIATx200. Compared to executive sponsors, change leaders’ scores were significantly higher for Active Participant in Learning score, and lower for Avoidant Learner. While not significant, executive spon-sors scored higher on Competitive Leader in Learning and Proximal Dependent Learner, and change leaders scored higher on the remaining eight learning styles identified in this study. Similar to the teaching styles, we utilized the original learning style definitions to expand and tailor the description of the resulting learning styles within a QIC (see Additional file 5).
Table 2Coaching style statistics within a quality improvement collaborative
Primary and secondary coaching style scoresa
Coach Revised delegator
Expert Revised facilitator
Formal authority
Personal model
Coach intervention
assignmentb Primary coaching profile Secondary coaching profile
C001 4.86 3.63 4.86 2.63 2.88 C Facilitator/Delegator Expert
C002c 6.00 5.75 6.57 5.25 6.50 CCM Facilitator/Personal Model Expert/Formal Authority
C003 6.71 5.63 5.00 4.75 4.88 ICC, CB Delegator Expert
C004d 6.00 4.88 6.57 4.50 4.63 C, LS Facilitator/Delegator Expert/Formal Authority/ Personal Model
C006 5.14 5.50 6.71 4.50 6.38 CB Facilitator/Personal Model Expert
C007 5.71 4.63 6.14 3.50 4.75 LS Facilitator Delegator
C008 5.29 3.88 5.71 4.13 5.00 CB Facilitator/Delegator Personal Model C009d 5.71 5.00 6.57 5.25 4.63 C, ICC Facilitator/Delegator Expert/Formal Authority
C010 5.67 5.71 6.83 4.43 4.86 CB Facilitator Delegator/Expert
C011 5.57 4.75 6.14 4.63 5.00 ICC,CB Facilitator Delegator
C012e 5.29 5.50 6.29 4.38 5.38 CCM, ICC Facilitator Delegator/Expert/Personal Model
C013 5.86 4.00 5.71 3.63 4.13 C Facilitator/Delegator Expert/Formal Authority/ Personal Model
C014 5.71 5.50 6.57 5.25 5.50 C, LS Facilitator/Delegator Expert/Formal Authority/ Personal Model
C015e 5.86 5.25 7.00 3.88 6.13 CCM, ICC Facilitator/Personal Model Delegator/Expert
C016 5.00 5.00 6.43 5.50 5.63 ICC,CB Facilitator Formal Authority/Personal Model
C017 5.57 4.25 6.86 3.00 2.63 C Facilitator Delegator
C018d 5.00 4.88 5.57 2.75 5.00 CCM Facilitator Delegator/Expert/Personal
Model
Average 5.59 4.92 6.21 4.23 4.93
St. Dev 0.46 0.67 0.64 0.89 1.04
Low 1.00–5.12 1.00–4.25 1.00–5.57 1.00–3.34 1.00–3.89
Medium 5.13–6.04 4.26–5.59 5.58–6.84 3.35–5.11 3.90–5.96
High 6.05–7.00 5.60–7.00 6.85–7.00 5.12–7.00 5.97–7.00
a
Scores in bold represent coaches in the high range for the associated style while italic scores represent those coaches with a score in the low range
b
Intervention Assignment: Coaching (C), Interest Circle (ICC), Learning Session (LS), Combination (CB) and Coaching only but in both the coach and combination interventions (CCM)
c
More providers in Washington State were randomized to the combination intervention resulting in one coach providing services to three providers in the coaching and four providers in the combination intervention arms
d
Due to the randomization of providers in Oregon and geographic proximity of the providers, coach (C004) provided services primarily to sites in the coaching intervention and one additional provider in the combination intervention. Coach (C009) worked primarily with providers in the combination intervention but provided services to one provider in the coaching intervention
e
We received responses to the Quality Improvement Learning Style Survey from the change leader and ex-ecutive sponsor from 15 different providers. An explora-tory analysis (Table 5) suggests that the learning profiles for individuals within an organization may be identical or may differ yet have some of the same learning styles. In seven out of eight instances when the learning profiles are the same, it indicates that the change leader and ex-ecutive sponsor prefer either a Collaborative/Competitive or Collaborative/Participatory approach to learning and knowledge acquisition. In the final case, both individuals have an Independent Learning profile. In the instances when the profiles differ, a similarity still exists in that the learning profile for each individual (change leader or ex-ecutive sponsor) has a collaborative component. It may be an indication that the individuals prefer to learn new knowledge when they are able to actively participate with other individuals in the overall learning experience.
Determination of learning and teaching profiles
The educational research suggests that individuals ex-hibit a preferred combination or group of teaching or learning styles. The PCA results were analyzed to deter-mine if similar combinations exists within a QIC. We visually examined individual learning style score distri-bution as compared to the average across all change leaders and executive sponsors to determine if a pre-ferred learning style existed for each of these individuals. The results suggested the presence of six learning pro-files for the executive sponsors and change leaders within a QIC: Collaborative/Competitive (N= 28, 36.4 %); Collaborative/Participatory (N= 19, 24.7 %); Collaborative only (N= 17, 22.1 %); Collaborative/Dependent (N= 6, 7.8 %); Independent (N= 3, 5.2 %); and Avoidant/ Dependent (N= 3, 3.9 %).
A similar approach was utilized to determine if a pre-ferred coaching profile existed for each coach. The
Table 3Learning styles scores within a quality improvement collaborative
QILSS learning style category Avg. StDev Low Medium High
Independent Learner (IL) 3.20 0.42 1.00 to 2.78 2.79 to 3.61 3.62 to 5.00
Avoidant Learner (AL) 2.13 0.64 1.00 to 1.49 1.50 to 2.76 2.77 to 5.00
Collaborative Relationship to Learning (CR2L) 4.16 0.70 1.00 to 3.46 3.47 to 4.85 4.86 to 5.00
Collaborative Learning from Others (CLO) 4.18 0.50 1.00 to 3.68 3.69 to 4.67 4.68 to 5.00
Guided Dependent Learner (GDL) 3.43 0.46 1.00 to 2.97 2.98 to 3.88 3.89 to 5.00
Proximal Dependent Learner (PDL) 1.99 0.91 1.00 to 1.08 1.09 to 2.89 2.91 to 5.00
Competitive Leader in Learning (CML) 2.38 0.57 1.00 to 1.81 1.82 to 2.94 2.95 to 5.00
Competitive Approach to Learning (CMA2L) 3.91 0.58 1.00 to 3.33 3.34 to 4.48 4.49 to 5.00
Active Participant in Learning (APL) 3.87 0.55 1.00 to 3.32 3.33 to 4.40 4.41 to 5.00
Participate to Acquire Knowledge (PAK) 3.85 0.47 1.00 to 3.38 3.39 to 4.31 4.32 to 5.00
results suggested the presence of four primary coaching profiles: Facilitator (N= 7, 41.2 %), Facilitator/Delegator (N= 6, 35.3 %), Facilitator/Personal Model (N= 3, 17.6 %) and Delegator (N= 1, 5.9 %). The review of the coaching styles also indicated the presence of secondary coaching profiles. Three coaches (C004, C013 and C014) had a secondary coaching profile of Expert/Formal Authority/Personal Model; another three coaches (C007, C011, and C017) also relied on the Delegator coaching style; and three other coaches (C001, C003 and C006) supported their primary coaching profile through the use of an Expert secondary coaching profile. Six other coaches relied on either the Delegator/Expert (C010, C015);
Delegator/Expert/Personal Model (C012, C018) or the Expert/Formal Authority (C009, C002) as their secondary coaching style. The final two coaches (C008, C016) uti-lized a Personal Model or Formal Authority/Personal Model as their secondary profile. The education lit-erature which our results supported did not suggest that individual learners utilize a secondary approach to learning.
In assigning coaches within the NIATx200 interven-tion, they either provided only coaching services (N= 8) or served as faculty for the interest circle calls or the learning session in addition to their coaching responsi-bilities (N= 8). One coach was faculty for the learning sessions and did not provide direct coaching to pro-viders. Table 2 provides details of these assignments. Using this assignment, we examined the distribution of coaching profiles by intervention arm. The results (not shown) indicated that coaches who provided only coach-ing services versus fulfilled other roles in the study (i.e., faculty) were equally likely to have either a Facilitator (N= 3 per group) or a Facilitator/Delegator (N= 3 per group) primary coaching profile. The other coach with a Facilitator profile served as faculty for the learning session. For the three coaches with a primary coaching profile of Facilitator/Personal Model, two provided only coaching services. Only one coach had a Delegator primary profile and they provided coach-ing services as well as served as a faculty member for the interest circle calls.
Discussion
Our research was one of the first to our knowledge to assess individual teaching and learning styles within a QIC. We found that the Grasha-Riechmann Student Learning Style Survey and Teaching Style Inventory could successfully be adapted to assess coach teaching style and individual learning styles within a QIC.
Table 4Change leader versus executive sponsor learning styles
QILSS learning style category Change leader Executive sponsor P-Value
Avg. SD Avg. SD
Independent Learner (IL) 3.26 0.38 3.13 0.47 0.18
Avoidant Learner (AL) 1.99 0.51 2.30 0.74 0.04
Collaborative Relationship to Learning (CR2L) 4.24 0.65 4.07 0.75 0.30
Collaborative Learning from Others (CLO) 4.28 0.44 4.06 0.54 0.06
Guided Dependent Learner (GDL) 3.52 0.48 3.33 0.42 0.07
Proximal Dependent Learner (PDL) 1.95 0.85 2.03 0.98 0.72
Competitive Leader in Learning (CML) 2.38 0.59 2.38 0.56 0.96
Competitive Approach to Learning (CMA2L) 3.98 0.60 3.83 0.54 0.27
Active Participant in Learning (APL) 3.98 0.50 3.73 0.57 0.04
Participate to Acquire Knowledge (PAK) 3.94 0.38 3.73 0.55 0.05
Table 5Comparison of learning profiles within the same organization
Learning profile
Organization Change leader Executive sponsor
Org001 Collaborative/Competitive Collaborative/Participatory
Org002 Collaborative/Competitive Collaborative/Competitive
Org 003 Collaborative/Competitive Collaborative/Competitive
Org004 Collaborative/Participatory Collaborative
Org005 Collaborative/Competitive Collaborative/Competitive
Org006 Collaborative/Participatory Collaborative/Participatory
Org007 Collaborative/Competitive Collaborative/Competitive
Org008 Collaborative/Participatory Collaborative/Participatory
Org009 Collaborative/Participatory Collaborative/Competitive
Org010 Collaborative/Participatory Collaborative/Participatory
Org011 Collaborative/Participatory Collaborative
Org012 Collaborative/Dependent Collaborative/Competitive
Org013 Collaborative/Participatory Collaborative
Org014 Collaborative/Participatory Collaborative
Org015 Independent Independent
The Grasha Riechmann model addressed individual teaching and learning styles and provided evidence for how teachers could leverage and match their teaching approach with different individual learning styles [34]. The structure of the model allows researchers to account for how individual preferences, prior experiences, cur-riculum design or the learning environment may create learning preferences, approaches or styles that vary from situation to situation [35]. Our study supports this notion.
Findings suggest that learners in a quality improve-ment collaborative (QIC) utilize multiple learning styles within a broader learning profile. The use of multiple learning styles differs from a recent study indicating a preference for a single learning style [46]. Nine out of 10 learners in NIATx200 preferred one of four learning pro-files that included a collaborative learning style. As such, they expect that the structure of the QIC will foster and create co-learning or other opportunities that promote team participation [46–48]. Collaborative learning is only one component of the learning profiles identified in this study. Other profiles include either a dependent or an independent learning style. A profile for a dependent learner appears to indicate a preference to rely more on the coach to guide them through their knowledge acqui-sition similar to how a tutor would work one-on-one with their student. In contrast, a profile with an inde-pendent approach to learning in a QIC appears to represent a combination of learning styles that have been identified as reflective observation, abstract conceptualization and active participation [49] or as one who prefers to reflect on the information they are learning as a part of the process to independent learning [50]. Only three individuals had an independ-ent learning profile in our study. For these persons, they are engaged in a learning process by which they are taking the information learned within the quality improve-ment collaborative (i.e., the environimprove-ment) to create their own knowledge about how to best implement change in their organization [49]. Approximately, 35 % of the learn-ing profiles included a competitive learnlearn-ing style. How-ever, NIATx200 did not promote active “competition” among the participating providers and it is unclear why these individuals felt a need to be competitive within the learning collaborative. The idea of profile that includes an avoidant learning style within a QIC setting is perplexing especially when coupled with a perceived dependency on the “collaborative” to support an individuals’ knowledge acquisition. Further understanding of learning styles of in-dividuals who have participated in a QIC is needed to bet-ter understand the nature of both the independent and avoidant learner.
Although the sample is small, individuals from the same organization may have similar or different learning
profiles. In an education setting, a teacher may have some students who prefer to learn didactically and others who are visual or hands-on learners. In these in-stances, a good teacher will modify their approach to help all students learn the content. Given that individ-uals from the same organization learn differently, the in-herent challenge for developers of a QIC is to determine how to integrate the different learning profiles to pro-mote active learning and knowledge acquisition. Further research is needed to better understand how this phenomenon plays out in a QIC.
This study is the first, to our knowledge, to assess the preferred teaching style of external coaches in a QIC. The results, based on the available sample, indicated that only the structure of the Delegator and Facilitator styles of NIATx 200 coaches differed significantly from other research on teaching styles (Grasha). The findings sug-gest seven of the seventeen the coaches had a primary teaching profile that comprised only of facilitation teach-ing style (N= 7). In the educational environment, Grasha defined that facilitation focused on the personal nature of the teacher and student interactions in order to estab-lish the students as independent learners [34]. Within the NIATx200 study, these facilitation skills often re-sulted in the coaches offering guidance and direction to the change leader/change team to help develop the cap-acity for independent action, initiative and responsibility. Godfrey and colleagues [51] identified this “helping” ap-proach to coaching to be an essential component in a QIC. For the remaining nine coaches, all except for one had a coaching profile that included the facilitator teach-ing style. These coaches integrated this style with skills from either the Personal Model (N= 3) or the Delegator (N= 6) teaching styles. These profiles support the con-cept that“teachers” utilize multiple styles when deliver-ing content within a learndeliver-ing environment [34]. Only one coach did not use the facilitation in their interac-tions and instead relied more on the Delegator teaching style when working with their providers.
Response rate is the primary study limitation. The small sample of coaches (n= 17) as compared to the educational sample (n= 760) may have contributed to the absence of distinguishable different teaching styles in a QIC versus educational setting. Further research is needed to gather more coach responses and re-evaluate teaching styles as well as profiles in a QIC environment. The usable sample of Quality Improvement Learning Style Survey (QILSS) results was limited to 78 executive sponsor or change leader surveys. An increase in the overall response rate (25.2 %) might have resulted in the identification of the use of different learning styles within a QIC. In turn, staff turnover, closed agency and the elapsed time between this research and the NIATx200 study may have also contributed to the low response rate. Conversely, most, if not all, of the coaches are still actively involved in NIATx related projects and as such, their response rate was much higher (94.4 %). The survey structure and question interpretation are two additional study limitations. How a questions’ wording was presented and interpreted by respon-dents might have changed the findings if a majority read the question in a similar way. Finally, the retro-spective assessment of teaching and learning styles may not have captured the preferred styles at the start of NIATx200 and it is possible that the coaches, change leaders and executive sponsors preferred styles may have changed over time.
Conclusion
The process of engagement in implementation re-search suggests that the external coach and change leader relationship is important to QIC success. Often, a collaborative includes multiple approaches to teaching skills and tools to participants in efforts to enhance their learning and knowledge acquisition. Adult learning theory suggests that the match be-tween teaching and learning styles is critical for ef-fective practice-based learning outcomes. With the wide spread use of QICs in healthcare, the identifica-tion of individual teaching styles prior to the develop-ment of a collaborative provides an opportunity to tailor the coaching intervention or the structure and content delivery mechanism to address the match be-tween the coaching and learning profiles of the par-ticipants. Efforts to accommodate learning styles of organizational change leaders or change team mem-bers could facilitate knowledge acquisition by deliver-ing content through approaches preferred by individuals with a specific learning profile. Given the time and re-source investment required to select and train coaches and change leaders, a more tailored QIC might result in greater improvement in patient and organizational outcomes.
Additional files
Additional file 1:Original Grasha-Riechmann Styles. (DOCX 14 kb)
Additional file 2:Teaching and Learning Styles for QI. (PDF 141 kb)
Additional file 3:Principal Component Analysis (PCA) Results. (DOCX 173 kb)
Additional file 4:QICTS Definitions. (DOCX 15 kb)
Additional file 5:QICLS Definitions. (DOCX 14 kb)
Abbreviations
GRSLSS:Grasha-Riechmann Student Learning Style Survey; NIATx: Network for the Improvement of Addiction Treatment; PCA: Principal Components Analysis; QIC: Quality Improvement Collaborative; QICTSI: Quality Improvement Coach Teaching Style Inventory; QILSS: Quality Improvement Learning Style Survey; TSI: Teaching Style Inventory
Acknowledgements
We would like to thank NIATx200 coaches, change leaders and executive sponsors who participated in this study through the completion of the teaching and learning style surveys.
Funding
This research was supported through funding from the National Institute of Drug Abuse (R03 DA034956).
Availability of data and materials
Data from the project will not be shared because participants were assured anonymity with the completion of the survey related to their learning or teaching style and obtaining a new consent for the individuals would not be feasible.
Authors’contributions
JF contributed to the conceptualization and design of the study, provided expertise in organizational coaching and the NIATx implementation model, participated in efforts to implement the study, analyzed the data, and helped draft the manuscript. JR contributed to the conceptualization, design and performed the statistical analysis and helped draft the manuscript. MW contributed to the development of the qualitative interviews, conducted change leader, executive sponsor and coach interviews, designed and implemented the qualitative analysis and helped draft the manuscript. All authors read and approved the final manuscript.
Competing interests
While there are no financial conflicts, Dr. Ford is affiliated with the NIATx Foundation that offers consulting and training in process improvement and organizational change to behavioral health organizations.
Consent for publication Not applicable.
Ethics approval and consent to participate
Participants received a study information sheet about the study. The study with a waiver of signed consent was approved by the University of Wisconsin Social Sciences Institutional Review Board (2013–1123).
Author details
1
Center for Health Systems Research and Analysis, University of Wisconsin-Madison, 610 Walnut Street, Madison, WI 53726, USA. 2
Sonderegger Research Center, School of Pharmacy, University of Wisconsin-Madison, Madison, WI 53705, USA.
Received: 17 May 2016 Accepted: 20 September 2016
References
2. Franco LM, Marquez L. Effectiveness of collaborative improvement: evidence from 27 applications in 12 less-developed and middle-income countries. BMJ Qual Saf. 2011;20:658–65.
3. Maclaurin A, McConnell H. Utilizing quality improvement methods to prevent falls and injury from falls: Enhancing resident safety in long-term care. Elderly Falls. 2011;42:525–35.
4. Quanbeck AR, Gustafson DH, Ford 2nd JH, Pulvermacher A, French MT, McConnell KJ, McCarty D. Disseminating quality improvement: study protocol for a large cluster-randomized trial. Implement Sci. 2011;6:44. 5. Sales AE, Bostrom A-M, Bucknall T, Draper K, Fraser K, Schalm C, Warren S.
The Use of Data for Process and Quality Improvement in Long Term Care and Home Care: A Systematic Review of the Literature. J Am Med Dir Assoc. 2012;13:103–13.
6. Anderson JB, Iyer SB, Beekman Iii RH, Jenkins KJ, Klitzner TS, Kugler JD, Martin GR, Neish SR, Rosenthal GL, Lannon CM. National pediatric cardiology quality improvement collaborative: Lessons from development and early years. Futur Pediatr Congenital Card Care. 2011;32:103–9. 7. Chow W, Hirschhorn LR, Ng DW, Wells CG, Schneider KL, Agins BD.
Improved Quality of HIV Care over Time among Participants in a National Quality Improvement Initiative. J Health Care Poor Underserved. 2012;23:67–80. 8. Crandall WV, Margolis PA, Kappelman MD, King EC, Pratt JM, Boyle BM,
Duffy LF, Grunow JE, Kim SC, Leibowitz I, et al. Improved Outcomes in a Quality Improvement Collaborative for Pediatric Inflammatory Bowel Disease. Pediatrics. 2012;129:e1030–41.
9. Daudelin DH, Kulick ER, D’Amore K, Lutz JS, Barrientos MT, Foell K. The Massachusetts Emergency Medical Service Stroke Quality Improvement Collaborative, 2009–2012. Prev Chronic Dis. 2013;10:130126. doi:10.5888/ pcd10.130126.
10. Peek ME, Wilkes AE, Roberson TS, Goddu AP, Nocon RS, Tang H, Quinn MT, Bordenave KK, Huang ES, Chin MH. Early lessons from an initiative on Chicago’s South Side to reduce disparities in diabetes care and outcomes. Health Aff (Millwood). 2012;31:177–86.
11. Schneider KL, Agins BD, Ng DW, Monserrate JM, Hirschhorn LR. Evaluation of Regional HIV Provider Quality Groups to Improve Care for People Living with HIV Served in the United States. J Health Care Poor Underserved. 2012;23:174–92. 12. Speroff T, Ely EW, Greevy R, Weinger MB, Talbot TR, Wall RJ, Deshpande JK,
France DJ, Nwosu S, Burgess H, et al. Quality improvement projects targeting health care?associated infections: Comparing virtual collaborative and toolkit approaches. J Hosp Med. 2011;6:271–8.
13. Tham E, Calmes HM, Poppy A, Eliades AB, Schlafly SM, Namtu KC, Smith DM, Vitaska MC, McConnell C, Potts AL, et al. Sustaining and Spreading the Reduction of Adverse Drug Events in a Multicenter Collaborative. Pediatrics. 2011;128:e438–45.
14. Weaver SJ, Lofthus J, Sawyer M, Greer L, Opett K, Reynolds C, Wyskiel R, Peditto S, Pronovost PJ. A collaborative learning network approach to improvement: The CUSP Learning Network. Jt Comm J Qual Patient Saf. 2015;41:147–59. 15. Brandrud AS, Schreiner A, Hjortdahl P, Helljesen GS, Nyen B, Nelson EC.
Three success factors for continual improvement in healthcare: an analysis of the reports of improvement team members. BMJ Qual Saf. 2011;20:251–9. 16. Donaldson N, Rutledge D, Geiser K: Role of the external coach in advancing
research translation in hospital-based performance improvement. In Advances in patient safety: new directions and alternative approaches. Volume 2. Edited by Henriksen K, Battles JB, Keyes MA, Grady ML. Rockville, MD: Agency for Healthcare Research and Quality (US); 2008
17. Isner T, Tout K, Zaslow M, Soli M, Quinn K, Rothenberg L, Burkhauser M: Coaching in Early Care and Education Programs and Quality Rating and Improvement Systems (QRIS): Identifying Promising Features. pp. 1-2-83. Wasington, DC: Child Trends; 2011:1-2-83.
18. Baykul Y, Gursel M, Sulak H, Ertekin E, Yazici E, Dulger O, Aslan Y, Buyukkarci K. A Validity and Reliability Study of Grasha-Riechmann Student Learning Style Scale. Int J Hum Soc Sci. 2010;5:177–84.
19. Cassidy* S. Learning styles: An overview of theories, models, and measures. Educ psychol. 2004;24:419–44.
20. Medland J, Stern M. Coaching as a successful strategy for advancing new manager competency and performance. J Nurses Staff Dev. 2009;25:141. 21. Novak S, Shah S, Wilson JP, Lawson KA, Salzman RD. Pharmacy students’
learning styles before and after a problem-based learning experience. Am J Pharm Educ. 2006;70(4):74.
22. Boonyasai RT, Windish DM, Chakraborti C, Feldman LS, Rubin HR, Bass EB. Effectiveness of teaching quality improvement to clinicians. JAMA. 2007;298:1023.
23. Davidoff F. Music Lessons: What Musicians Can Teach Doctors (and Other Health Professionals). Ann Intern Med. 2011;154:426.
24. Grumbach K, Bainbridge E, Bodenheimer T: Facilitating improvement in primary care: the promise of practice coaching. vol. 15. pp. 1–14: Commonwealth Fund Issue Brief; 2012:1–14.
25. Hayes E, Kalmakis KA. From the sidelines: Coaching as a nurse practitioner strategy for improving health outcomes. J Am Acad Nurse Pract. 2007;19:555–62.
26. Nagykaldi Z, Mold JW, Aspy CB. Practice facilitators: a review of the literature. FAM MED KANS CITY. 2005;37:581.
27. Ogrinc G, Nierenberg DW, Batalden PB. Building Experiential Learning About Quality Improvement Into A Medical School Curriculum: The Dartmouth Experience. Health Aff. 2011;30:716–22.
28. Evans AC, Rieckmann T, Fitzgerald MM, Gustafson DH. Teaching the NIATx Model of Process Improvement as an Evidence-Based Process. J Teach Addict. 2008;6:21–37.
29. Fitzgerald M, Evans A. Inspiring change leaders: NIATx’s Change Leader Academy aims to help develop leaders to promote process improvements. Behav Healthc. 2006;26:14–6.
30. Vaughn L, Baker R. Teaching in the medical setting: balancing teaching styles, learning styles and teaching methods. Med Teach. 2001;23:610–2. 31. Grasha AF. The dynamics of one-on-one teaching. Coll Teach.
2002;50:139–46.
32. Grasha AF. A matter of style: The teacher as expert, formal authority, personal model, facilitator, and delegator. Coll Teach. 1994;42:142–9. 33. Gardner H: Multiple intelligences: New horizons. New York: Basic books;
2006.
34. Grasha AF: Teaching with style: A practical guide to enhancing learning by understanding teaching and learning styles. San Bernadino: Alliance Publishers; 1996.
35. Coffield F, Moseley D, Hall E, Ecclestone K: Learning styles and pedagogy in post 16 learning: a systematic and critical review. The Learning and Skills Research Centre; 2004.
36. Charkins RJ, O’Toole DM, Wetzel JN: Linking teacher and student learning styles with student achievement and attitudes. J Econ Educ. 2014;16(2): 11–120.
37. Diaz DP, Cartnal RB. Students’learning styles in two classes: Online distance learning and equivalent on-campus. Coll teach. 1999;47:130–5.
38. Grasha AF, Yangarber-Hicks N. Integrating teaching styles and learning styles with instructional technology. Coll Teach. 2000;48:2–10.
39. Hubble MW, Richards ME. Paramedic student performance: comparison of online with on-campus lecture delivery methods. Prehosp Disaster Med. 2006;21:261–7. 40. Jones NB, Golann B, Vollmers G. Exploring the Challenges of a Hybrid
Distance Course. J Inf Educ Res. 2006;8:59–80.
41. Kumar P, Kumar A, Smart K. Assessing the impact of instructional methods and information technology on student learning styles. Issues Informing Sci Inf Technol. 2004;1:533–44.
42. McCaskey SJ. Social interaction learning styles in on and off campus environments. Online J Workforce Educ Develop. 2010;2:5. 43. Yazici HJ. A study of collaborative learning style and team learning
performance. Educ Train. 2005;47:216–29.
44. Gustafson D, Johnson K, Capoccia V, Cotter F, Ford I, Holloway D, Lea D, McCarty D, Molfenter T, Owens B: The NIATx model: Process improvement in behavioral health. Madison, WI: University of Wisconsin; 2011. 45. Gustafson DH, Quanbeck AR, Robinson JM, Ford 2nd JH, Pulvermacher A,
French MT, McConnell KJ, Batalden PB, Hoffman KA, McCarty D. Which elements of improvement collaboratives are most effective? A cluster-randomized trial. Addiction. 2013;108:1145–57.
46. Weggelaar-Jansen AM, Wijngaarden J, Slaghuis S-S. Do quality improvement collaboratives’educational components match the dominant learning style preferences of the participants? BMC Health Serv Res. 2015;15:1. 47. Bunniss S, Gray F, Kelly D. Collective learning, change and improvement in
health care: trialling a facilitated learning initiative with general practice teams. J Eval Clin Pract. 2012;18:630–6.
48. Worswick L, Little C, Ryan K, Carr E. Interprofessional learning in primary care: An exploration of the service user experience leads to a new model for co-learning. Nurse Educ Today. 2015;35:283–7.
49. Kolb DA: Experiential learning: Experience as the source of learning and development. FT press; 2014.
51. Godfrey MM, Andersson‐Gare B, Nelson EC, Nilsson M, Ahlstrom G. Coaching interprofessional health care improvement teams: the coachee, the coach and the leader perspectives. J Nurs Manag. 2014;22:452–64. 52. Bidassie B, Williams LS, Woodward-Hagg H, Matthias MS, Damush TM. Key
components of external facilitation in an acute stroke quality improvement collaborative in the Veterans Health Administration. Implement Sci. 2015;10:69.
53. Waterman H, Boaden R, Burey L, Howells B, Harvey G, Humphreys J, Rothwell K, Spence M. Facilitating large-scale implementation of evidence based health care: insider accounts from a co-operative inquiry. BMC Health Serv Res. 2015;15:1.
• We accept pre-submission inquiries
• Our selector tool helps you to find the most relevant journal
• We provide round the clock customer support
• Convenient online submission
• Thorough peer review
• Inclusion in PubMed and all major indexing services
• Maximum visibility for your research
Submit your manuscript at www.biomedcentral.com/submit