Multivariate analysis of experimental marine ecosystems
C. A.
O V I A T T 1,K,. T. PERF, Z 2 & S. W. N I x o N 1
1 Graduate School of Oceanography,
University of Rhode Island; Kingston, Rhode Island, USA,
and
Environmental Research Laboratory,
U.S. Environmental Protection Agency; Narragansett, Rhode Island, USA
ABSTRACT: Twelve replicate 150-1 laboratory microcosms were developed using whole water samples and natural benthic communities from Narragansett Bay, Rhode Island (USA). The microcosms were scaled to the bay in terms of salinity, temperature, light input, volume pelagic community to area of benthic community, density of macrofauna, turbulent mixing, and flushing time. The microcosms were self maintaining during a six month study period with over 35 species of phytoplankton and 30 species of macro-invertebrates. Some 25 species of meroplankton entered tahe microcosms and successfully colonized the benthic communities. Zooplankton were present in all life stages. Atter an initial study of replication among the 12 ranks, the microcosms were perturbed with 3 levels of treated urban sewage for a three month period. Three microcosms were maintained at each level with 3 tanks remaining as controls. At the end of 3 months, the sewage input was terminated and the response of the systems was fol- lowed for an additional 2 months. Both time series data and multivariate statistical analysis of over 10 different parameters indicated that the replication of the microcosms was adequate to show the effects o f experimental treatments. Control microcosms were generally Within the range of variation expected in Narragansett Bay. Moreover, ttle results suggested that the microcosms responded to the gradient of sewage input in a manner similar to that of the bay. During the two month period aider the sewage was discontinued, all of the microcosms became increasingly similar, though the tanks that had been subjected to higher levels of sewage re- mained distinct. It was apparent throughout the study that comparisons of microcosms and natural systems must account for the large variation characteristic of each. For this, and other reasons, multivariate statistical techniques appear to provide a powerful tool for experimental ecosystem analysis.
I N T R O D U C T I O N
E c o s y s t e m a n a l y s i s - h o l i s m a n d r e d u c t i o n i s m
Analysis of marine ecosystems 31
gathered by traditional reductionist methods may not be very helpful in making predictive statements about the behavior of complex marine ecosystem or their proba- ble response to perturbations of various kinds. On the other hand, natural ecosystems are usually large, unreplicated, without environmental control, and therefore pro- tected to some degree from tampering by well meaning researchers. While it has occasionally been possible to overcome these problems in doing experimental ecosystem work on land (e. g. Likens et at., 1970; Odum, 1970), it has seldom been practical with natural marine ecosystems. As a result, our knowledge of marine ecology has devel- oped in bits and pieces from many individual studies of the behavior and dynamics of phytoplankton, zooplankton, etc. We can only hope that the best data base that has evolved under this reductionist approach can be synthesized in some useful way through the mechanistic modeling projects now underway (Steele, 1974; Walsh, 1975; Kremer & Nixon, 1975; and numerous others).
T h e m i c r o c o s m m e t h o d
In seeking a way to carry out practical yet holistic ecosystem research, a number of workers have used small-scale living models or microcosms of larger natural systems that can be maintained and manipulated in the laboratory. The rationale and potential of the microcosm approach in general have been described by Beyers (1963) and Cooke (1971), and with specific reference to coastal marine waters by Abbott (1966). A review of the use of multi-species cultures and microcosms, especially in the marine environment, has been prepared by Levandowsky (in press). At the present time, at least five major marine microcosm studies are underway, including projects at Kiel Bay, Germany (yon Bodungen et al., 1976; Smetacek et al., 1976), at Loch Ewe, Scotland (Davies et al., 1973), at Narragansett Bay, Rhode Island (Knauss et al., 1976), at Sanich Inlet, British Columbia (Takahashi et al., 1975), and at Kaneoke Bay, Hawaii (S. V. Smith, personal communication). In spite of the impressive efforts involved in these, and other microcosm studies, the methodology of microcosms (or, in some cases, mesocosms) is still evolving. For example, it is far from clear how mi- crocosms may best be scaled to the "real world" in terms of energy inputs for biological production and physical mixing or what the effects of larger animal ex- clusion may be. There is also the possibility of serious artifacts from the lack of spatial heterogeneity and small size in microcosms, as well as from the "wall effects" of high surface to volume ratios characteristic of enclosed communities. As with numerical simulation models, there appears to be no generally agreed upon criteria for evaluating the credibility of living models or for comparing the behavior of microcosms with the "real" systems they represent. In a sense, microcosm research is still an iterative process in which methodological and conceptual problems of experimental design are as much a part of the study as data collection and analysis.
The experiments were designed to examine the replicability of marine microcosms, to compare the behavior of the microcosms with that of a natural marine bay, and to evaluate the use of the microcosms as a tool for studying the larger system.
M E T H O D S
D e s i g n o f t h e m i c r o c o s m s
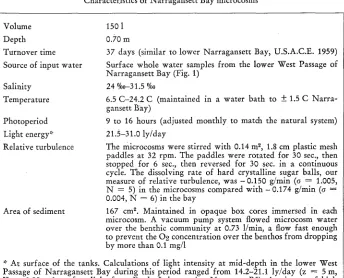
A l a b o r a t o r y microcosm facility was designed to accommodate 12 plastic tanks in a flow through water b a t h under controlled conditions of temperature, salinity, light, flushing, physical mixing, and material input (Perez et al., 1976). During the experi- ment described here, an a t t e m p t was made to a p p r o x i m a t e the environmental con- ditions of N a r r a g a n s e t t Bay (Table 1).
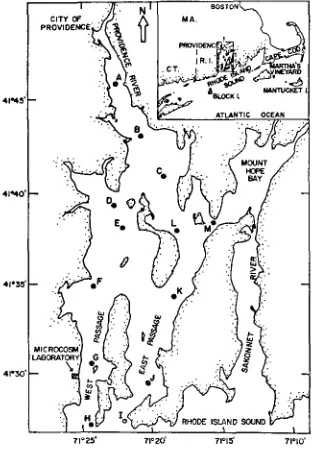
N a r r a g a n s e t t Bay is a p l a n k t o n based temperate estuary in southern N e w Eng- land (Fig. 1). I t a well mixed system with relatively small fresh water inflow,
Table 1
Characteristics of Narragansett Bay microcosms
Volume 150 1
Depth 0.)0 m
Turnover time 37 days (similar to lower Narragansett Bay, U.S.A.C.E. 1959) Source of input water Surface whole water samples from the lower West Passage of
Narragansett Bay (Fig. 1)
Salinity 24 %o-31.5 %0
Temperature 6.5 C-24.2 C (maintained in a water bath to + 1.5 C Narra- gansett Bay)
Photoperiod 9 to 16 hours (adjusted monthly to mat& the natural system) Light energy::" 21.5-31.0 ly/day
Relative turbulence The microcosms were stirred with 0.14 m =, 1.8 cm plastic mesh paddles at 32 rpm. The paddles were rotated for 30 see., then stopped for 6 sec., then reversed for 30 sec. in a continuous cycle. The dissolving rate of hard crystalline sugar bails, our measure of relative turbulence, was -0.150 g/rain (o = 1.005, N = 5) in the microcosms compared with -0.174 g/rain (o = 0.004, N = 6) in the bay
Area of sediment 167 cm ~. Maintained in opaque box cores immersed in each microcosm. A vacuum pump system flowed microcosm water over the benthic community at 0.73 l/rain, a flow fast enough to prevent the Og concentration over the benthos from dropping by more than 0.1 mg/1
Analysi.s of marine ecosystems 33
generally high salinity ( > 20
~
and little vertical stratification. The average depth is about 10 m. While there is little organic input to the bay from marshes or macro- phytes, there is a clear eutrophication gradient from north to south that results from large inputs of primary and secondary sewage in the upper bay (Fig. 1). In general, however, the water quality at the location of the laboratory in the lower bay is excellent.E x p e r i m e n t a l d e s i g n
The 12 microcosms were filled in mid March, 1975, using hand bucketed water samples (to prevent damage to plankton) collected over a 6 hour flood tide from the surface of the lower West Passage of the bay (Fig. 1). For the next 7 days, the microcosms were throughly intermixed to insure a uniform distribution among the tanks. A heterotrophic benthic community was included in each microcosm in a flow
71 =2-5' 7 1 = 2 0 ' 71015 ' 7 1 % 0 '
Fig. 1 : Location of the microcosm laboratory on the lower West Passage of Narragansett Bay, Rhode Island (USA). The lettered stations were used to collect field data on the spatial varia-
Aflcer the intermixing period, all 12 of the microcosms were monitored for 15 days to determine the replication of the systems. The parameters measured and methods used during this period and throughout the study are summarized in Table 2. At the end of this period, 9 of the microcosms were perturbed with 3 different levels of treated urban sewage collected from the largest treatment plant on the Providence River (Fig. 1).
S e w a g e i n p u t s
Since one of the objectives of this study was to see if the behavior of the micro- cosms approximated that of the larger natural system, it seemed appropriate to find
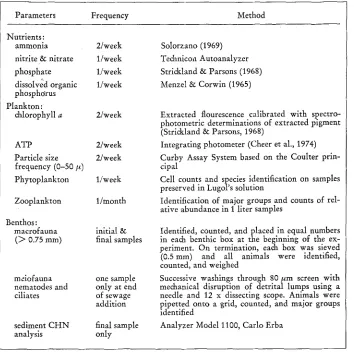
Table 2
Summary of the analytical methods and sampling procedures used in this study to characterize the Narragansett Bay microcosms
Parameters Frequency Method
Nutrients:
ammonia 2/week
nitrite & nitrate 1/week
phosphate 1/week
dissolved organic 1/week phosphorus
Plankton:
chlorophyll a 2/week
ATP 2/week
Particle size 2/week frequency (0-50 ~)
Phytoplankton 1/week Zooplankton l/month Benthos:
macrofauna initial & ( > 0.75 mm) final samples
meiofauna one sample
nematodes and only at end
ciliates of sewage
addition sediment CHN final sample
analysis only
Solorzano (1969) Technicon Autoanalyzer Strickland & Parsons (1968) MenzeI & Corwin (1965)
Extracted flourescence calibrated with spectro- photometric determinations of extracted pigment (Strickland & Parsons, 1968)
Integrating photometer (Cheer et al., 1974) Curby Assay System based on the Coulter prin- cipal
Cell counts and species identification on samples preserved in Lugol's solution
Identification of major groups and counts of rel- ative abundance in 1 liter samples
Identified, counted, and placed in equal numbers in each benthic box at the beginning of the ex- periment. On termination, each box was sieved (0.5mm) and all animals were identified, counted, and weighed
Successive washings through 80/~m screen with mechanical disruption of detrital lumps using a needle and 12 x dissecting scope. Animals were pipetted onto a grid, counted, and major groups identified
Analysis of marine ecosystems 35
out if the microcosms which resembled the "clean" lower West Passage of the bay would develop the characteristics of the more eutrophic upper regions of Narragansett Bay when they were exposed to a sewage gradient similar to that found in the n a t u r a l system. Initially large quantities (4 1, 10 1 and 20 1) of sewage were added to tripli-
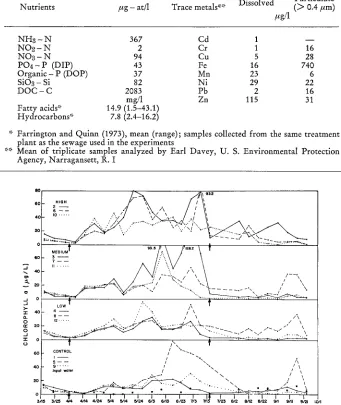
Table 3
Composition of the treated urban sewage added to the Narragansett Bay microcosms
Particulate
Nutrients #g - at/1 Trace metals** Dissolved ( > 0.4 #m)
fig/1
NI-I8 - N 367 Cd 1 -
-NO-2 - N 2 Cr 1 16
NO8 - N 94 Cu 5 28
P O a - P (DIP) 43 Fe 16 740
Organic - P (DOP) 37 Mn 23 6
SiO3 - Si 82 Ni 29 22
DOC - C 2083 Pb 2 16
rag/1 Zn 115 31
Fatty acids* 14.9 (1.5--43.1)
Hydrocarbons* 7.8 (2.4-16.2)
* Farrington and Quinn (1973), mean (range); samples collected from the same treatment
plant as the sewage used in the experiments
** Mean of triplicate samples analyzed by Earl Davey, U. S. Environmental Protection Agency, Narragansett, R. I
8O . - - ~ 93.Z
60 HIGH ~ 11
! o [ ~ ' . ~ .~ / ",, / / ' , . \ I I
0 0 , ." "./ ',,/ . .~..~
9 -,. 9 ./. , . . . . . ~*
20 " " / '- ." 9 ...' . ~ . . . l . \ \
~ / ... t .... /,...\ / .... \ )
- - II . . . f" ' ' . V 9
2O ~ , , ~ " " : I " " , " " ~ I \
o " . . . " " : ~ ' ~ ~ I " " . . . - . . . ~ ' \ I \
o | . . . . .... 9 ... ~ ...
40 4 - - ," -. ii\\
8 - - - - " "" / \ / \
20
,T, ~ -:"qz>-- --,==--- X ~ ... 7 . . . . . . ~ . . . -.-. ... \.
,.,~ o ~ , . , ~, . . . . . ~
00 CONTROL i I % ~ . ~
1 - -
40 9 . . . /t \ . t/ \
lnpul woter \ /
2o . / , > .. / - ~ , 9 ' . . . . \ / / '~
3/]5 3/25 4/4 4/T4 4/24 ,5/4 5/14 5/24 6/3 6/13 6/~.3 7/3 7/I 7/23 8/2 8/12 8/22 9/I G/11 9/21 loll
care microcosms to simulate an ammonia gradient from a sewage outfall of 10, 25 and 50/~g at N/1. The Providence River which has ammonia concentrations as high as 31 #g at N/1 (~ = 14, N = 52) and which receives 0.3 ~/0 sewage by volume per day provided the basis for choosing this gradient and a logarithmic series (0, 0.01, 0.1 and 1.0 ~ of sewage by volume for new input water added three times a week. Even though the sewage addition caused only a small decrease in salinity (4.0 ~ fresh water was added proportionally to the lower sewage dose tanks to make the change constant for all treatments. The sewage for the entire experiment was collected at one time, analyzed (Table 3), separated into aliquots of the volume necessary to add to the bay water that was added to the tanks on three days each week (Table 1) and frozen. Later~analysis of the frozen sewage showed no appreciable change in its composition over time. The sewage input was maintained for 102 days (4 April-15 July) before it was terminated and the recovery of the systems ~ollowed for the next 69 d a y s (16 July-23 Sept.).
RESULTS A N D D I S C U S S I O N R e p l i c a t i o n o f t h e m i c r o c o s m s
For 15 days a~er the initial intermixing, the 12 tanks remained similar with respect to all of the parameters measured (Figs 2, 3; Table 4). Once the systems were perturbed with sewage, the tanks began to diverge and show the effect of the experimenta! treatment. However, replication within each treatment remained strong for another 15-20 days. A t that point, one replicate in each of the treatments and in the control set began to diverge markedly with respect to ammonia (Fig. 3). The same tanks later developed extremely high nitrate and nitrite levels. It is difficult to account for this anomalous behavior with respect to nitrogen. It apparently had nothing to do
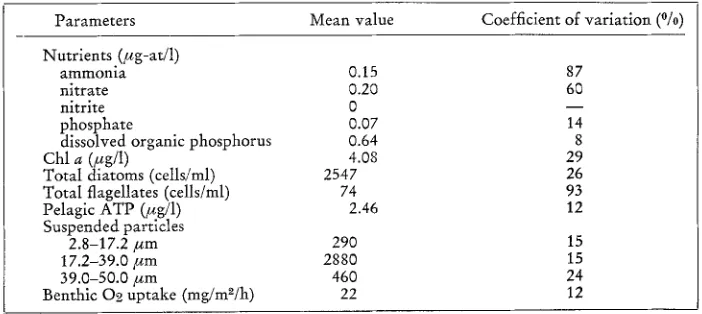
Table 4
Replication of the 12 marine microcosms just prior to the addition of urban sewage. Samples were collected 14 days atter intermixing of the microcosm tanks
Parameters Mean value Coefficient of variation (~
Nutrients (/~g-at/1)
ammonia 0.15 87
nitrate 0.20 60
nitrite 0 - -
phosphate 0.07 14
dissolved organic phosphorus 0.64 8
Chl a (~eg/1) 4.08 29
Total diatoms (cells/ml) 2547 26
Total flagellates (cells/ml) 74 93
Pelagic ATP (#g/l) 2.46 12
Suspended particles
2.8-17.2/zm 290 15
17.2-39.0/~m 2880 15
39.0-50.0 #m 460 24
Analysis Of marine ecosystems 37
with the sewage input, since one of the control tanks had the highest nitrogen level. Measurements of the nitrogen fluxes from the benthic boxes were not significantly higher in these tanks. Moreover, the total biomass of infauna present in the sediment (,-" 250 mg dry weight) could not have provided enough nitrogen to produce the measured increases even if it had completely decomposed9 The same is true of the amount of nitrogen in the pore waters of the sediments. The C / N ratio and nitrogen content of the sediments in the anomalous tanks were not significantly different from the other tanks at the end of the experiment9 At this point, the source of the additional nitrogen remains unknown 9 Replication within treatments of the other parameters continued to be adequate to separate the effects of the various sewage levels9
M u l t i v a r i a t e a n a l y s i s o f m i c r o c o s m r e p l i c a t i o n
a n d r e s p o n s e
The long, 170 day time series plots of individual parameters in the microcosms are useful in documenting the behavior of one part of the system and in analyzing the mechanisms that may operate in regulating the structure and function of the commu- nity. They also give a simple visual impression of the variation of each parameter within each treatment over time. However, one of the main reasons for using micro- cosms is to study the response of whole ecosystems rather than their parts. Even with the best reasonably attainable replication, the noise of measurement and sampling errors and the day to day variation of the systems themselves make it almost im- possible to use the time series data alone to separate one system or microcosm from
6 0 6 4 . 0 61.7
I 0 . . . 2 0 ~
\ ,: p \
t 9 / \
- - § - . . . . .
~ -
i i . . .
- t t "
L O W 2 0 4 - -
8 - - - " ' . Jt
i ~ 9 . \
9 9 - ~ / . ' \
F i g . 3 : C o n c e n t r a t i o n s o f a m m o n i a i n t h e e x p e r i m e n t a l m i c r o c o s m ~ . J
o
a 2 0
2o
Z
0
2 C
88.4% VARIATION EXPLAINED
I
CONTRO
- 7 MEDfUM
-3 I ,,, I I I I I I I
I 2 3 4 5 6 7 8
A X I S I
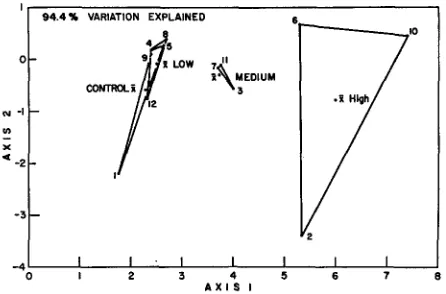
Fig. 4: Canonical variates analysis of pelagic chlorophyll a, diatoms, flagellates, pelagic ATP, suspended particles (2.8 ~m, 13.2/~m, 39 #m) and ammonia in the experimental microcosms during the first month with sewage input. The lines connect replicates within each treatment.
The numbers refer to individual microcosms
u)
x
< - 2
- 4
9 4 . 4 % VARIATION EXPLAINED
4 S ~ L O W
CO.T~i/f
- - 3I I I I
I 2 3 4 8
A X I S I
6
I0
2
I I I
5 6 7
Fig. 5: Canonical variates analysis of chlorophyll a and nutrients in the experimental micro- cosms during the three month sewage addition. The mean position of each treatment level is
shown along with the individual means of each treatment
another or to separate one system in its present state from itself at some other state. Analyses are needed which incorporate a number of parameters simultaneously in arriving at an objective statistical description of ecosystem state or conditions. Our feeling is that a number of multivariate statistical techniques, including canonical variate analysis (Blackith & Reyment, 1971) and correspondence analysis (David et al., 1973) are especially appropriate for use with experimental ecosystem studies that produce large amounts of data on a large number of parameters. The application of these techniques to ecological data from natural systems has already been described (Chardy et al., 1976).
Analysis of marine ecosystems 39
1 4
1 2
I 0
0.8
0.6
0 . 4
0 2
0
- 0 2
- 04
- - 0 6
--0~8
- - ; . 0
- I . 2
- ; 4
-0,8
J, to,~,
z z z
4 0 % V A R I A T I O N E X P L A I N E D
Proroceofrum $p
93 ~2e2
33
]EGINNING OF E X P E R I M E N T -- N O SEWAGE
~[~Cosclno#iscus S~
,2 ,z ,Z ,z
Lepfocy//ndru$ # r
~4
3 %
g IZ
4 e
I I I I I I I I ,
- 0 . 4 0 0.4 0 . 8 1.2 1.6 Z.O 2 . 4 2 9 A X I S t
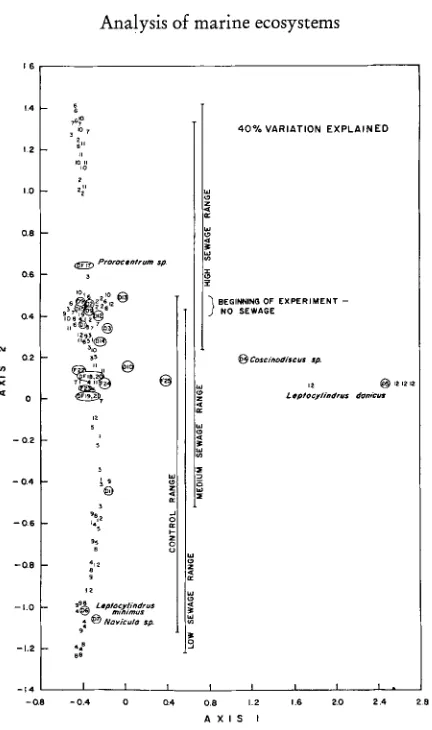
Fig. 6: Correspondence analysis of data on the species composition and abundance of the
phytoplankton in the experimental microcosms during the three month addition. Numbers represent samples in individual microcosms while the letters represent particular species of diatoms (D) or dinoflagellates (DF) or flagellates (F) that were associated with the various samples. All of the tanks were similar at the beginning of the experiment before sewage was
added (see Fig. 4 for numbers of individual microcosms)
size ranges (Fig. 4). The outlying point in each of the replication triangles represents the individual microcosm in each treatment that developed the anomalous ammonia values discussed earlier. Since the tanks with high nitrogen levels did not appear to differ with respect to any of the other parameters (Fig. 2), it is evident that the multivariate analysis will reflect the extreme behavior of any one parameter. A similar canonical variates analysis on a data set that included all of the nutrients and chlorophyll a from the entire three month period during which the sewage inputs were maintained again showed that the replication remained adequate to show treatment effects along axis one and anomalous ammonia values along axis 2 (Fig. 5).
at this level, it was somewhat surprising to find that variations in the more detailed measurements of phytoplankton species abundance prevented a clear separation of treatment on the basis of the total phytoplankton community structure or on the basis
IO0
5 0
o
~ I 0 0 u J F-- , < 5O
. J - I o w
J u .
5 0
o
I o o
~ o
o
H I G H 2 - -
I 0 ... ~ / , " ~". /
t t
M E D I U M 3 "
.,' .~ . .
I !
L O W 4 - - R - - ~ 12 . . .
f ' .
t t
C O N T R O L I
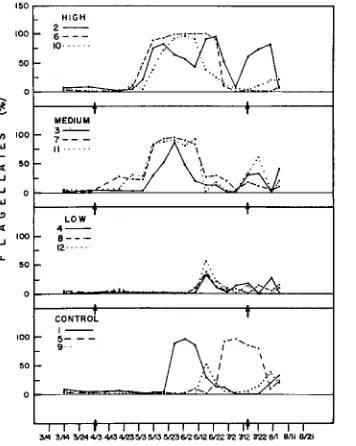
Fig. 7: Contribution of flagellates to the total phytoplankton in the experimental microcosms. Narragansett Bay typically shows a shiR from diatoms to flagellates in the summer flora
of "characteristic species" (Fig. 6). The correspondence analysis of taxonomic data did clearly show initial similarity of all of the microcosms. It also reflected some tendency
for flagellate groups, especially
Prorocentrurn,
to be more abundant in the highersewage treatments (Figs. 6 and 7). However, the results suggest that the large amount of effort involved in the taxonomic analysis at lower trophic levels did not provide data that were particularly sensitive to perturbations of this kind. It is not clear whether this result comes about because individual species are relativelyinsensitive to the perturbation or because the large amount of variation inherent in less aggregated ,data, including the seasonal change from diatoms to flagellates, makes it more difficult to measure the response of individual species in the context of a total plankton community.
C o m p a r i s o n w i t h t h e n a t u r a l s y s t e m
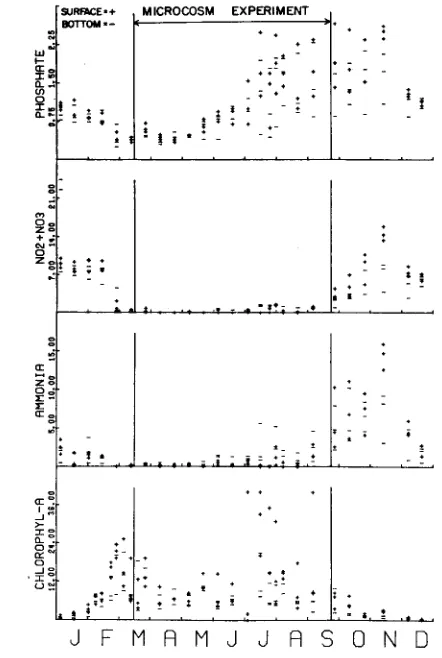
Analysis of marine ecosystems 41 community should also be self-maintaining over a time span that is appropriate for the processes being studied. It is probable that neither the microcosms described here nor those of any other study yet reported have fulfilled all of these criteria. It is hard to know this for sure since, as mentioned earlier, there is no generally agreed upon
S I , I ~ E 9 § J O T T O I k l 9 -
!.
z : ! i 9
,:! -
g:
1:12,
e
T:
d F M R
M I C R O C O S M E X P E R I M E N T
+ :t
_ - • +
. 7 , * . +
1 t t _*
" ! i 9 : - - ' -
o 9
" i
I
* * . . . . ~ . . . T ~ t ~ ; , * - ,
+
~ _
o
- _t
- 2 - +
N J d R S 0 N D
to find in different parts of the bay at different times of the year (Fig. 8), and it is against this background of natural variation that the behavior of the microcosm should be evaluated. With the exception of the anomalously high nitrogen levels in one tank, the control microcosms generally fell within the range of values characteristic of the lower West Passage of Narragansett Bay. A canonical variates analysis of nutrient and chlorophyll data from the microcosms and from 13 stations located throughout the bay confirmed this intuitive analysis and indicated that the microcosms responded to sewage inputs by developing characteristics similar to those found along a gradient from the Providence River to the mouth of Narragansett Bay (Fig. 9).
The microcosms remained throughout the study as plankton based systems with grazing food chains containing over 30 forms of phytoplankton and zooplankton. The benthic communities contained a healthy assemblage of macrofauna similar to that
-2 (n
x
< -3
-4
-5
o Microcosms t CONTROL
No.oooo..
80, ~
x
i~.
9 $totions j 9 ~
12 9 gGeHK
LOW 4 L Mid-Boy
9 ~~149
~
n ~ e d ~ ~ l O B A _Prov.
River
80.2% Voriotion exploi
I I I I I I I I I
-6 -5 -4 -3 -Z - I 0 I 2
A X I S 1
Fig. 9: Canonical variates analysis of chlorophyll and nutrient data from the experimental microcosms and for the same parameters from an annual field study of surface and bottom water at 13 stations in Narragansett Bay. Location of the field stations is shown in Figure 1. Axis 1 portrays the anomalous microcosms, whereas axis 2 gives the eutrophication gradient in the bay and in the microcosms. Over 90 % of all the sewage input to the bay enters in the Providence River. The resulting marked gradient down the bay resembles the gradient deve-
loped among the microcosms as a function of sewage input
found in Narragansett Bay. While the benthos was composed of 10 species of macro invertebrates at the beginning of the experiment, the diversity increased through the natural seeding of meroplankton in the input water to 35 species by the end of the study. Benthic biomass increased from 2-4 fold and measurements of oxygen uptake and ammonia flux from the sediment indicated that total benthic metabolism was similar to that found in the bay (Nixon eta]., 1976).
E f f e c t o f s e w a g e i n p u t s
Table 5 Composition and metabolism of the benthic community in the experimental microcosms from mid - March to mid - September. Sewage inputs were maintained from April through mid - July Treatment (volume of sewage) Components Control Low Medium High Macrofauna (total community) number of species (initial)*
(final)** biomass
increase (rag dry) Meiofauna (8 mm core) number of ciliates number of nematodes*'."* (at the end of sewage additions) Total benthic oxygen uptake during the experiment (gm) Sediment carbon in the top 1 cm at the end of sewage addition (rag/gin) Sediment nitrogen in the top 1 cm at the end of sewage addition (rag/gin) Sediment C/N ratio 10 10 10 10 16 14 16 13 956 • 216 817 • 383 559 • 158 724 • 428 9.0 + 4.4 12.7 • 11.6 16.0 • 10.6 105 • 137 21.3 • 8.6 69.3 • 28.7 80.3 • 34.3 43.7 • 20.5 3.62 + 0.84 2.67 + 0.34 3.71 + 0.29 4.39 + 0.43 24.86 + 10.37 21.84 + 3.63 22.73 + 6.63 36.87 + 12.86 3.03 +_ 1.46 2.82 + 0.58 2.94 + 0.94 5.23 + 1.9 8.20 7.74 7.73 7.05 * Most abundant species were Arnpelisca abdita, NucuIa annulata and Mulinia lateralis ** Most abundant species in all treatments were Nucula annulata, Tharyx acutus, and Polydora ligni *** Major genera were Terschellingia, Odontophora, and Sabatieria
parameters in the microcosms with higher sewage input. There was also a tendency for the phytoplankton in the sewage tanks to contain a larger percentage of flagellates (Fig. 7). However, as shown in Figure 6, changes in the specific taxonomic composition and relative abundance of the plankton as a result of the sewage addition could not be demonstrated with correspondence analysis. The same was true for the taxonomic composition, growth and metabolism of the benthos, where the only statistically significant change appeared to be an increase in the carbon and nitrogen content of the surface sediments in the high sewage microcosms (Table 5).
a
X <C
AFTER
- TREATMENT
82.6% variation 73.8% u explained
HIGH TREATMENT 3
2 le
LOW
8~__
,I
~,~y
/ /
"t 6
LOW i 0 " ~ e
1
I
I
I
I
I
I
I
I
- 6 -5 - 4 - 3 -~ -I 0 I 2 3
A X I S 1
Fig. 10: Canonical variates analysis of chlorophyll a , nutrients, pelagic ATP, and particle
counts in the experimental microcosms during three months with sewage input compared with the same analysis during the two months following termination of the sewage input. Substan-
tial recovery of lower treatment levels is apparent in overlap of the replication triangles
i t o MICROCOSMS MICROCOSM~ SEPARATED FOR CLAJTY
C,J ~ ~ e 8 7 ' 5 % V a r i a t i o n e x p l a i n e d ~ ~ ~ T R O L LOW
03
__ M id - B e y U p p e r
<~ ~ ~ B a y P r o v i d e n c e R i v e r
L\
CONTROL 12 B A,
_ CONTRO I G
0 I 2 5 4
A X I S 1
Fig. 11: Canonical variates analysis of chlorophyll, ammonia, nitrate, and nitrite in the micro- cosms and in Narragansett Bay during the recovery period. Good agreement with lower bay
Analysis of marine ecosystems 45 R e c o v e r y
The time series data show declines in cell counts, chlorophyll, and pelagic A T P that began before the sewage was stopped (Fig. 2). Marked fluctuations in these, and other parameters became particularly apparent and are also characteristic of Narra- gansett Bay in the warmer months. The high seasonal variability obscures clear trends in the single parameter time series data. However, canonical variates analysis of nutrient values, chlorophyll a, pelagic ATP, and particle counts during the three month sewage addition and the two month recovery period did show differences between the sampling periods (Fig. 10). Aflcer the sewage was stopped, the replication triangles all began to overlap to some degree, even though seasonal changes had influenced the general condition and variability of all the microcosms. A reduced data set from the microcosms which included chlorophyll, ammonia, nitrate and nitrite was compared with the 13 bay stations during the recovery period using canonical variates analysis (Fig. 11). All treatment microcosms and two controls overlap mid and lower bay stations indicating good recovery for these parameters. Control microcosm 1, by contrast, was positioned high on Axis 2 due to very high values of nitrate and nitrite, apparently derived from earlier high ammonia values. Recovery of the microcosms that had been subjected to the high sewage inputs was still far from complete with respect to all parameters, even though the recovery period was almost twice as long as the flushing time of the systems.
Acknowledgements. We are grateful to Alina Froelich, Betty Buckley, Steve Hale, Jona-
than Garber, Jack Kelley, Sybil Seitzinger and to our EPA colleagues Andrea Hurtt, Sue Cheer, Earl Davey and Barbara Guida for help with the extensive laboratory analysis. M. Gayle Kraus performed the meiofaunal analyses. Robert Marrero identified and counted phytoplankton species. BjSrn Malmgren and Wendell Hahm assisted with the multivariate analyses. This re- search was supported by a grant from the U.S. Environmental Protection Agency, R-803 143.
L I T E R A T U R E C I T E D
Abbott, W., 1966. Microcosm studies on estuarine waters. I. The replicability of microcosms. J. Wat. Pollut. Control Fed. 30, 258-270.
Bertalanffy, L. yon, 1968. General system theory. Braziller, New York, 289 pp.
Beyers, R. J., 1963. A characteristic diurnal metabolic pattern in balanced microcosms. Pubis Inst. mar. Sci. Univ. Texas 9, 19-27.
Blackith, R. E. & Reyment, R. A., 1971. Multivariate morphometrics. Acad. Press, London, 412 pp.
Bodungen, B. yon, yon Brockel, K., Smetacek, V. & Zeitzschel, B., 1976. The planktontower. I. A structure to study water/sediment interactions in enclosed water columns. Mar. Biol. 34, 369-373.
Chardy, P., Glemarec, M. & Laurec, A., 1976. Application of inertia methods to benthic marine ecology: practical implications of the basic options. Estuar. coast, mar. Sci. 4, 179-205.
Cheer, S., Gentile, J. H. & Hegre, C. S., 1974. Improved method for ATP analysis. Analyt. Biochem. 60, 102-114.
Cooke, G. D., 1971. Aquatic laboratory microeeosystems and communities. In: The structure and function of freshwater microbial communities. Ed. by J. Cairns. Polytech. Inst., Black- burgh, VA., 47-85.
Davies, J. M., Gamble, J. C. & Steele, J. H., 1975. Preliminary studies with a large plastic enclosure. In: Estuarine research. Ed. by L. E. Cronin. Acad. Press, New York, 1, 251-264. Farrington, J. W. & Quinn, J. G., 1973. Petroleum hydrocarbons and fatty acids in waste
water effluents. J. Wat. Pollut. Control Fed. 45, 704-712.
Knauss, J. A., Griffin, J. J., Nixon, S. W., Pilson, M. E. Q. & Smayda, T. J., 1976. A facility for the experimental analysis of coastal marine ecosystems. Tech. prog. Rep. U.S. envir. Protect. Agency, 124 pp.
Kremer, J. N. & Nixon, S. W., 1975. An ecological simulation model of Narragansett Bay - the plankton community. In: Estuarine Research. Ed. by L. E. Cronin. Acad. Press, New York, 1, 672-690.
Levandowsky, M., 1977. Multispecies cultures and microcosms. In: Marine ecology. Ed. by O. Kinne. Wiley-Interscience, London, 3 (3) 1399-1458.
Likens, G. E., Bormann, F. H., Johnson, N. M., Fisher, D. W. & Pierce, R. S., 1970. Effects of forest cutting and herbicide treatment on nutrient budgets in the Hubbard Brook water- shed ecosystems. Ecol. Monogr. 40, 23-47.
Mann, K. H., 1972. The analysis of aquatic ecosystems. In: Essays in hydrobiology. Ed. by R. B. Clark & R. J. Wooton. Univ. of Exeter, Exeter, 1-14.
-- 1975. Relationship between morphometry and biological functioning in three coastal inlets
of Nova Scotia. In: Estuarine Research. Ed. by L. E. Cronin. Acad. Press, New York, 1,634-644.
Menzel, D. W. & Corwin, N., 1965. The measurement of total phosphorus in seawater based on the liberation of organically bound fractions by persulfate oxidation. Limnol. Oceanogr. 10, 28O-282.
Nixon, S. W., Oviatt, C. A. & Hale, S. S., 1976. Nitrogen regeneration and metabolism of coastal marine bottom communities. In: The role of terrestrial and aquatic organisms in decomposition processes. Ed. by J. M. Anderson & A. Macfaden. The 17th symposium of the British Ecological Society. Blackwell, Oxford, 269-283.
Odum, t-I. T. (Ed.), 1970. A tropical rain forest, a study of irradiation and ecology at E1 Verde, Puerto Rico. Div. Tech. Inf., U.S. Atomic Energys Commn, 9 chapters.
- - 1971. Environment, power and society. Wiley-Interseience, New York, 331 pp.
Patten, B. C., 1971. Coda. In: Systems analysis and simulation in ecology. Ed. by B. C. Patten. Acad. Press, New York, 1,583-584.
Perez, K., Morrison, G., Oviatt, C., Nixon, S. & Buckley, B., 1976. The importance of physi- cal and biotic scaling to the experimental simulation of a coastal marine ecosystem. Helgo- l~inder wiss. Meeresunters. 80, 144-162.
Smetacek, V., Bodungen, B. yon, Bro&el, K. yon & Zeitzschel, B., 1976. The planktontower. II. Release of nutrients from sediments due to changes in the density of bottom water. Mar. Biol. 34, 373-378.
Solorzano, L., 1969. Determination of ammonia in natural waters by the phenolhypochlorite methods. Limnol. Oceanogr. 14, 799-801.
Steele, J. H., 1974. The structure of marine ecosystems. Blackwell, Oxford, 128 pp.
Strickland, J. D. H. & Parsons, T. R., 1968. A practical handbook of seawater analysis. Bull. Fish. Res. Bd Can. 167, 1-311.
Takahaski, M., Thomas, W. H., Siebert, D. L. R., Beers, J., Koeller, P. & Parsons, T. R. 1975. The replication of biological events in enclosed water columns. Arch. Hydrobiol. 76, 5-23. U.S. Army Corps of Engineers, 1959. Contamination dispersion in estuaries, Narrangansett
Bay. Hydraulic Model Investigation. Misc. Pap. U.S. Army Eng. Waterways Exp. Sm 2, 1-332.
Walsh, J. J., 1975. A spatial simulation model of the Peruvian upwelling ecosystem. Deep Sea Res. 22, 201-'236.
First author's address: Candace A. Oviatt