R E S E A R C H A R T I C L E
Open Access
Dental erosion in French adolescents
Michèle Muller-Bolla
1,2*, Frédéric Courson
2,3, Violaine Smail-Faugeron
2,3, Thibault Bernardin
1and
Laurence Lupi-Pégurier
1Abstract
Background:Since the 2000s, different epidemiological studies focusing on the prevalence or the aetiology of DE in adolescents recognised them as an at-risk population due to their eating behaviours. None was carried out in French adolescents.
The primary objective of this study was to assess the prevalence of dental erosion (DE) using the total BEWE score among adolescents in the department of Alpes Maritimes, France. The secondary objectives were to observe changes in prevalence estimates depending on both the cutoffvalue of total BEWE score with different teeth/dental surfaces examined, and to identify the related risk factors.
Methods:A cross-sectional study in a multistage random sample of 339 14-yr-old schoolchildren was carried out in 2014. The children completed a self-administered questionnaire concerning diet and oral habits. Caries was assessed with ICDAS-II (International Caries Detection and Assessment System-II) criteria and erosion with BEWE (Basic Erosive Wear Examination) index. The total BEWE score was calculated to assess the DE prevalence with two cutoff values (3 and 1). Data were analysed using descriptive statistics and logistic regression models.
Results:The 331 children were aged 14.4 ± 0.5 years. The DE prevalence was 39 % using a total BEWE score≥3. With a cutoff total BEWE score of 1 (at least one affected tooth), the prevalence varied from 3.9 to 56.8 % depending on the teeth/surfaces that were used for the analysis. The DE prevalence, assessed with only first molars and maxillary incisors, was about 54 %. The risk factors for DE (total BEWE score≥3) were daily consumption of acidic beverages (OR: 4.0; 95 % CI: 2.1–7.6) and acidic sweets (OR: 3.2; 95 % CI: 1.2–8.0), low socio economic category (OR: 2.4; 95 % CI: 1.1–5.0) and visible dental biofilm (OR: 2.0; 95 % CI: 1.2–3.4).
Conclusion:Depending on the method chosen, the prevalence varied from 3.9 to 56.8 % among these adolescents.
Thus, a consensus on choice of index, teeth to examine and age at assessment is necessary to standardise measurement of DE prevalence.
Background
Dental erosion (DE) is a non-carious lesion consisting of progressive and irreversible loss of dental hard tissue due to the chemical process of acid dissolution that does not involve bacterial plaque acid [1, 2]. Its overall clinical appearance may also involve a frictional component, such as abrasion or attrition, particularly in older age groups. Since the 2000s, different epidemiological stud-ies focusing on the prevalence or the aetiology of DE in adolescents recognised them as an at-risk population
due to their eating behaviours. The studies were carried out in the Americas [3–14], Arabian countries [15–23], an Asian country [24, 25] and in Western Europe [2, 26–35]. The prevalence of DE ranged from 7 to 95 % and, except in two studies, the extension of severe ero-sion into dentine was usually infrequent [11, 16] (Table 1). The wide variation of prevalence in teenagers is suggestive of the difficulty in finding a unanimously accepted index among researchers for measuring and detecting erosive lesions. A recent systematic review es-timated an overall worldwide prevalence of tooth erosion of 30 % (95 % CI: 24–37) by mixing different clinical in-dices and without specifying the teeth examined. Futher-more, the review included population-based studies in * Correspondence:michele.muller@unice.fr
1Dental Faculty, University Nice Sophia Antipolis. CHUN, Nice, France 2URB2i - EA 4462, University Paris Descartes, Montrouge, France
Full list of author information is available at the end of the article
© 2015 Muller-Bolla et al.Open AccessThis article is distributed under the terms of the Creative Commons Attribution 4.0 International License (http://creativecommons.org/licenses/by/4.0/), which permits unrestricted use, distribution, and reproduction in any medium, provided you give appropriate credit to the original author(s) and the source, provide a link to the Creative Commons license, and indicate if changes were made. The Creative Commons Public Domain Dedication waiver (http://creativecommons.org/publicdomain/zero/1.0/) applies to the data made available in this article, unless otherwise stated. Muller-Bollaet al. BMC Oral Health (2015) 15:147
Table 1Prevalence of dental erosion in adolescents (12–16 years-old) assessed on a population-based samples (prevalence studies published since 2000)
Authors Year Country (Area) Age (years) Sample size Erosion/Wear Index used Permanent teeth (surfaces) Examined
Prevalence (%)
El Karim et al. [23] 2007 Sudan (Khartoum) 12–14 157 Erosion Smith and Knight Tooth Wear Index (TWI) [51].
UI (B, P) 66.9 %
Hamasha et al. [15] 2014 Jordan (Amman, Iibid, Al-Karak)
12–14 3 812 Erosion TWI [51] modified by Millward et al. [52]: 0 (B/L/O/I) No loss of enamel surface characteristics.
1 (B/L/O/I) Loss of enamel surface characteristics.
2 (B/L/O) Loss of enamel, visible dentine for less than 1/3 of the surface.
2 (I) Loss of enamel just exposing dentine. 3 (B/L/O) Loss of enamel, visible dentine for > 1/3 of the surface.
3 (I) Loss of enamel and substantial loss of dentine.
4 (B/L/O) Complete loss of enamel, or pulp exposure, or exposure of secondary dentine.
4 (I) Pulp exposure or exposure of secondary dentine.
All permanent teeth (all surfaces)
32.2 %
Al Majed et al. [16] 2002 Saudi Arabia (Riyadh)
12–14 862 Erosion Modified TWI derived from the 1998 United Kingdom Adult Dental Health Survey [53]:
0 No obvious wear facets in enamel. 1 Marked wear facets in enamel. Enamel only, Loss of surface characterisation. 2 Wear into dentin, dentin exposed occlusally/incisally. Loss of enamel exposing dentine.
3 Extensive wear into dentin, greater than 2 mm2of exposed dentin, pulp exposure. Loss of enamel and dentin resulting in pulpal exposure.
UI (B, P), M1 (O) 95 % (DE in at least one tooth)
26 % (DE into dentine or into pulp)
McGuire et al. [3] Okunseri et al. [13]
2009 2011
United States (NHANES)
13–19 1 962 Erosion Incisors, canines,
M1 (O)
45.9 % (DE in at least one tooth):
13–14 year-old: 39.6 % 16–17 year-old: 44.5 %
Bardsley et al. [26] Milosevic et al. [27]
2004 Nord west England (Preston)
14 2 385 Wear Simplified version of TWI dichotomised as the presence or absence of dentinal exposure (S-TWI) (1984):
0 No wear into dentin.
1 Dentine just visible (including cupping) or dentine exposed for less than 1/3 of surface.
2 Dentin exposure greater than 1/3 of surface.
3 Complete loss of enamel on a surface, exposure of pulp or secondary dentin.
Incisors, canines, M1 (O)
53 %
Bardolia et al. [31] 2010 UK (Isle of Man) 13–14 629 Erosion Incisors, canines, M1 (O)
51 % (20 % if exclusion of incisal edge wear)
Abu-Ghazaleh et al. [22] 2013 Jordan (Amman) 15–16 1 602 Wear Incisors, canines, M1 (O)
51 %
Muller-Bol
la
et
al.
BMC
Oral
Health
(2015) 15:147
Page
2
of
Table 1Prevalence of dental erosion in adolescents (12–16 years-old) assessed on a population-based samples (prevalence studies published since 2000)(Continued)
Dugmore et al. [32] Dugmore et al. [28]
2003 2004
UK (Leicestershire, Rutland)
1214 1 7531 308 re-examined
Erosion Index of O’Brien [32]. Depth:
0 Normal enamel.
1 Loss of enamel surface characteristics. 2 Loss of enamel exposing dentine 3 Loss of enamel and dentine with pulp exposure.
Area:
1 Less than one third of surface involved. 2 Between one and two thirds of surface involved.
3 More than two thirds of surface involved.
Incisors, M1 12 year-old: 59.7 % (2.7 % exhibiting exposed dentine)
14 year-old: 64.1 % (56.3 % at 12 year-old)
Sanhouri et al. [18] 2010 Sudan (Khartoum) 12–14 1 138 Wear All permanent teeth (all surfaces)
74 %
Gurgel et al. [9,10] 2011 Brazil (Bauru) 12, 16 414 Erosion UI (B, P), M1 (O) 20 % (withoutloss of dentine)
Habib et al. [12] 2013 United States (Kansas city)
12 218 Erosion UI (B, P) 10 %
Van Rijkom et al. [30] 2002 The Netherlands (The Hague)
10–13 15–16
345 400
Erosion Modified scale of Lussi by Van Rijkom [54]: 0 No visible smooth wear.
1 Slight smooth enamel wear, surface with silky-shining,‘melted’appearance. 2 Deep smooth enamel wear, dentine is shining through (light yellow).
3 Smooth wear into dentine on L/P or O surfaces, or less than one-half of B surfaces (yellow).
4 Smooth wear into dentine on more than one-half of B surfaces.
All permanent teeth (all surfaces)
3 % of 10–13 year-olds 30 % of 15–16 year-olds Truin et al. [33] 2005 The Netherlands
(The Hague)
12 324 Erosion UI, UC (P); M1 (O) 24 %
El Aïdi et al. [34] 2008 The Netherlands (Oss)
10–12 622 Erosion All permanent teeth
(all surfaces)
32.2 % (deep enamel erosion: 1.8 %)
Arnadottir et al. [29] 2003 Iceland (Reykjavik) 15 278 Erosion Modified scale of Lussi (1991): 0 No erosion.
1 Loss of surface enamel, dentine not involved (anterior teeth), enamel erosion on cusp tips that cannot be attributed to attrition (posterior teeth).
2 Erosion extending into dentine. 3 Extending close to pulp (pulp chamber visible).
All permanent teeth (all surfaces)
21.6 %
Arnadottir et al. [2] 2010 Iceland 12, 15 1 507 Erosion All permanent teeth (all surfaces)
15.7 % of 12-year-olds (n= 757)
30.7 % of 15-year-olds (n= 750)
Peres et al. [7] 2005 Brazil (Joaçaba) 12 391 Erosion Dental erosion index of O’Sullivan [55]. Grade of severity:
0 Normal enamel.
1 Matte appearance of the enamel surface with no loss of contour.
2 Loss of enamel only.
3 Loss of enamel with exposure of dentin (ADJ visible).
4 Loss of enamel and dentin beyond ADJ. 5 Loss on enamel and dentin with exposure of pulp.
Area of surface affected by erosion: Code- Less than half of the surface affected. Code + More than half of the surface affected.
UI 13 %
Correr et al. [4] 2009 Brazil (Piracicaba, São Paulo)
12 389 Erosion UI, M1 26 %
Wang et al. [24] 2010 China (Guangzhou) 12–13 1 499 Erosion Incisors, M1 27.3 % Vargas-Ferreira et al. [11] 2011 Brazil (Santa Maria) 11–14 870 Erosion UI, M1 7.2 % Kumar et al. [17] 2013 Karnataka, South
India
11–14 605 Erosion All permanent teeth
(all surfaces)
8.9 %
Aguiar et al. [8] 2014 Brazil (Campina Grande)
15–19 675 Erosion UI, M1 21 %
Muller-Bol
la
et
al.
BMC
Oral
Health
(2015) 15:147
Page
3
of
Table 1Prevalence of dental erosion in adolescents (12–16 years-old) assessed on a population-based samples (prevalence studies published since 2000)(Continued)
Auad et al. [5] Waterhouse et al. [6]
2007 2008
South east Brazil (TrêsCorações)
13–14 458 Erosion Criteria used in UK National Diet and nutrition survey [56]:
0 Normal.
1 Enamel only. Less than one third of surface involved.
2 Enamel and dentine. One third up to two thirds of surface involved. 3 Enamel, dentine and pulp. Two thirds or more of surface involved.
UI (B/P), M1 (O) 34.1 % (no evidence of erosion affecting dentine)
Huew et al. [19–21] 2011 Libya (Benghazi) 12 791 Erosion UI (B/P), M1 (O) 40.8 %
Margaratis et al. [35] 2011 Greece (Attica) 14–16 502 Erosion BEWE scoring system [46]: 0 No erosive tooth wear. 1 Initial loss of surface texture. 2 Distinct defect; hard tissue loss < 50 % of the surface area.
3 Hard tissue loss≥50 % of the surface area.
All permanent teeth (all surfaces)
58 % (BEWE >0) If S-TWI on incisors, M1(O): 51.6 %
Zhang et al. [25] 2014 China (Hong Kong) 12 600 Erosion All permanent teeth (all surfaces)
75 % (BEWE > 0) but no severe erosion (BEWE = 3)
Alvarez Loureiro L. et al. [14] 2015 Montevideo (Uruguay)
12 1 136 Erosion All permanent teeth
(B, P, O)
52.9 % (BEWE >0)
BBuccal,IIncisal,PPalatal,LLingual,OOcclusal,UIupper incisors,UCupper canines,M1first molars,UKUnited Kingdom,BEWEBasic Erosive Wear Examination
Muller-Bol
la
et
al.
BMC
Oral
Health
(2015) 15:147
Page
4
of
the permanent teeth of children and adolescents aged 8–19 years [36].
When focusing on Europeans adolescents, the preva-lence of DE has ranged from 18 to 64 % [28, 33] but no epidemiological study of DE has so far been carried out in France (Table 1). The prevalence of DE was only in-directly considered in the study of Bartlett et al. [37]; it focused on the prevalence of tooth wear in 18–35 year-old Europeans including France and six other countries. The index used to measure both severity and dis-tribution of tooth wear was the Basic Erosive Wear Examination (BEWE), as recommended by different au-thors [1, 38–41] but the protocol did not consider all surfaces, just the buccal and lingual surfaces of all teeth [37]. Nevertheless early signs of erosion are often ob-served on the occlusal surfaces of molars [1]. The prob-lem of which clinical index to use and which teeth and tooth surfaces to observe arises since many different methods are available in the literature (Table 1). Finally, no studies that address the risk indicators for DE in France have been found.
The primary objective of the present study was to as-sess the prevalence of DE using the total BEWE score in a sample of French adolescents. The secondary objec-tives were to observe changes in prevalence depending on both the cutoff value of total BEWE score on differ-ent teeth/ddiffer-ental surfaces examined, and to iddiffer-entify the related risk factors.
Methods
This cross-sectional survey was carried out in 2014 in the Alpes Maritimes (AM) department in the south-east of France. Ethical approval was obtained from the local ethics committee (“Comité Protection Personnes sud Méditerranée V”).
Study population
Alpes Maritimes is the 14th most densely populated de-partment in France with 251 persons per sq km. It in-cludes Nice, the fifth largest city in France. Four of the 71 public secondary schools are located in rural areas, the others are in urban areas where students enrolled in priority education schools (PES) (12.5 %) are of lower socioeconomic status than others.
Sampling procedure
A minimum sample size of 322 adolescents was re-quired assuming prevalence of DE of 30 % [42, 43], precision and level of statistical signification of 0.05. We used a two-stage, stratified sampling method to obtain a representative sample of approximately 14-yr-old adolescents from 8th grade high-schools by randomisation of the schools on the basis of geo-graphic location (urban/rural) and socio-economic
category (PES/not PES). A list of all the schools was obtained from the local education department. Firstly, a consent form to participate in the study was given to all of the parents prior to the dentist’s visit to the randomised schools. Secondly, the children who were present on the day of the examination and for whom positive parental and personal consent was obtained were included. Children were excluded if they were not 14 years old during the school year or if they were currently wearing orthodontic appliances. Chil-dren affected by a hereditary or acquired dental struc-tural abnormality were also excluded.
Data collection
The data were collected on the day of the examin-ation using a self-completed questionnaire. This ques-tionnaire was based on one used in previous studies that identified risk factors for DE [44] and included sociodemographic characteristics, dietary and oral health behaviours. The French version was first tested in 30 French 14-yr-olds and it was found to be com-prehensible for this age group.
Clinical examinations
Before examination, with good lighting (Power-Spotlight, Bisico, France), the teeth were carefully cleaned (Happy morning brushes, Hager & Werken, France) and dried (Trans’Care Max, Satelec group, Acteon equipment, France). Lesions were scored using the BEWE index (0 = no erosion, 1 = early enamel surface loss, 2 = enamel and dentine surface loss < 50 %, 3 = surface loss 50 %) on all permanent tooth scoreable surfaces. With this scoring system, all teeth were examined, and the most severely affected surfaces (buccal/labial, occlusal, and lingual/pal-atal) in each sextant were recorded. Each subject ob-tained a total BEWE score that corresponded to the sum of the highest scores in the six sextants; and the preva-lence of erosion was calculated on the basis of a total BEWE score≥3. The risk level of DE is low when the total score is between 3 and 8; medium, between 9 and 13; and high for a score of 14 and above [38, 39, 41]. Carious lesions were recorded using the ICDAS-II (International Caries Detection and Assessment System) advanced method on all scoreable surfaces of permanent teeth. Children were affected by dentinal lesions (ICDAS 4–6) or with both enamel and dentinal lesions (ICDAS 1–6) [45]. After the examination, the children received a card to take home reporting their dental needs.
All clinical examinations were carried out by a single examiner (TB) who was trained and calibrated by a paediatric dentist (MMB). A range of different levels of dental erosion was used in the calibration process, which was based on photographic images. Reliability was assessed through the Kappa test.
Statistical analysis
Prevalence was estimated as the proportion that had a total BEWE score≥3 considering highest scores in sex-tants (primary outcome). The proportions with a total BEWE score≥1 on particular permanent teeth (incisors, canines, first molars) were secondary outcomes. Data analysis included comparisons of means and the Chi-squared test to investigate the univariate associations be-tween the dichotomous dependent variable DE (primary outcome) and a range of demographic, dietary and oral care variables. Independent variables which were asso-ciated with DE (p< 0.1) were entered as candidate vari-ables into a stepwise multiple logistic regression analysis. All the significant variables were ranked using a multi-variable logistic regression analysis. Similar multimulti-variable logistic regression analyses were tested, changing the cutoff value of the dependent variable (total BEWE score≥1 considering all surfaces). The level of statistical significance was set at 0.05. In each classroom, one child chosen at random was examined twice one week later by the same examiner using the ICDAS-II advanced method and the BEWE index to measure intra-examiner reliability. The corresponding Kappa values assessed in 34 re-examined children one week later were respect-ively 0.8 (ICDAS-II) and 0.9 (BEWE). Data were ana-lysed using SPSS19.0.
Results
Of the 495 subjects invited to participate, 143 did not re-turn the parental consent, 3 were absent on the day of the visit dates and 18 were excluded. The 331 children were aged 14.4 ± 0.5 years. There were 174 girls and 157 boys included; 12.1 % (n= 40) were enrolled in PES and 5.1 % (n= 17) in rural schools.
The highest total BEWE score≥3 (cumulative score of all sextants) in our study was in the range 9–13 (medium risk level) for only one adolescent. When the total BEWE cutoff score was≥3, prevalence was 39 % (primary objective). When the cut off value was 1, i.e. at least one tooth with signs of DE, the prevalence depended on the dental surfaces observed. If only maxil-lary incisors were examined, as in the method used in some studies carried out in adolescents [7, 12, 23] (Table 1), the prevalence decreased from 39 to 3.9 %. Conversely, if first molars were examined in addition to the maxillary incisors, whatever the surfaces considered, the prevalence was about 54 %, close to 56.8 % for all the surfaces examined on all permanent teeth (Table 2). These results depend on the distribution of the DE le-sions. Light extension (BEWE 3–8) was more frequent in mandibular (16.9) compared with maxillary (9.0) teeth. The BEWE score 3 was found just once on the oc-clusal subsurface of the second maxillary right premolar
and score 2 was found on occlusal surfaces of perman-ent molars and second premolars. First molars, and more particularly the lower ones, were the most affected teeth (Table 3). If we consider the results for each kind of tooth, 98.0 % of the subjects with at least one second molar affected by DE presented also DE on the first mo-lars. Second premolars were more often affected than both the first ones and the second molars.
The risk factors for DE (Total BEWE score≥3) were, in decreasing order, the consumption of acidic beverages and sweets, and the low socio-economic category of par-ticipants. Area of residence, the presence of carious le-sions (ICDAS 1–6 or 4–6) and prolonged retention of drinks in the mouth were not significantly associated with erosive experience in adjusted logistic regression analyses; visible dental biofilm was only associated if le-sions ICDAS 4–6 were included in the multivariable logis-tic regression analysis (Table 4). Thus the consumption of acidic beverages (OR: 4.0; 95 % CI: 2.1–7.6) and sweets (OR: 3.2; 95 % CI: 1.2–8.0), low socio-economic category (OR: 2.4; 95 % CI: 1.1–5.0) and the presence of visible dental biofilm (OR: 2.0; 95 % CI: 1.2–3.4) had an effect on the primary outcome. When changing the dependent vari-able by substitution of primary outcome with the total BEWE score≥1 considering all surfaces, independent var-iables which were entered as candidate varvar-iables into a stepwise multiple logistic regression analysis were differ-ent (Table 5). With this cutoff value, only acidic beverages (OR: 6.4; 95 % CI: 2.9–14.0) and drinking method (OR: 3.5; 95 % CI: 1.4–8.9) had an effect on the dependant variable.
Discussion
The prevalence of DE using a total BEWE score≥3 in a stratified sample of French adolescents was 39 %. This was within the confidence interval of the overall estimated Table 2Dental Erosion prevalence in a sample of French adolescents (n= 331) according to the dental surfaces of permanent teeth examined
Dental surfaces examined BEWE Prevalence
Maxillary incisorsa Total BEWE≥1 3.9 %
Maxillary incisors and occlusal
surfaces of first molarsb Total BEWE≥1 54.4 %
Maxillary incisors and first molars on all scorable surfacesc
Total BEWE≥1 54.4 %
Incisors and first molarsd Total BEWE≥1 55.0 %
Six upper and lower anterior teeth,
occlusal surfaces of first molarse Total BEWE≥1 55.0 %
All teeth (all surfaces)f Total BEWE≥1 56.8 %
a
[7,12,23],b
[5,6,9,10,16,19–21],c
[4,8,11],d
[24,28,32],
e
[3,13,22,26,31],f
[2,14,15,17,18,25,29,30,34,35].
BEWEBasic Erosive Wear Examination
prevalence of DE in European countries (33 %, 95 % IC 25–42) and outside the confidence interval of the overall worldwide prevalence of DE of 30 % (95 % IC: 24–37), both reported in a recent systematic review [36]. Except in the two studies carried out in the United States [3, 13, 14], prevalences in America ranged from 7.2 to 34.1 % and were lower than in France [4–12] whereas the systematic review, which included fewer studies, did not indicate any significant difference between American and European countries [36]. Conversely, except for the two studies with equivalent rates [15, 17, 19–21], four descriptive studies carried out in Arab countries indi-cated a higher prevalence, ranging from 51 to 95 % [16, 18, 22, 23]. Finally, by increasing order of prevalence in European countries, France was situated between The Netherlands [30, 33, 34] and Iceland [2, 29], with rates around 20–30 %, and United Kingdom [26–28, 31, 32] or Greece [35] around 50–60 %.
This ranking by country must be considered with cau-tion as the prevalence of DE in adolescents was studied using different clinical indices. As indicated in the sys-tematic review of Salas et al. [36], the prevalences of DE assessed with O’Sullivan’s or Lussi’s modified scales were lower [2, 4, 7, 8, 11, 17, 24, 29, 30, 33, 34] than in the present study using the total BEWE score. On the con-trary, the prevalences of DE were higher with the Tooth Wear Index (TWI) modified three times (Table 1). One of them [31] easily explains these observations because this was dichotomised as the presence or absence of dentinal exposure [22, 26, 27, 31]. In the present study, the erosive lesions involved mostly the enamel. Only the study of Hamasha et al. [15], that used the TWI modi-fied by Millward, did not confirm these result due to the lower prevalence. In France, the prevalence was assessed with BEWE total score because it is now both the most recommended index and the more recently used, espe-cially in adults [35, 39, 41, 46, 47]. In children and ado-lescents, this was only used in a retrospective study [40] and in a study with a population-based sample mixing adults and adolescents [48]. However, three prevalence studies focusing on adolescents [14, 25, 35] have used BEWE scores but with a cutoff value of 1 for DE diagno-sis (Table 1). They reported prevalences higher than
50 %, as in our study, and an increase of the prevalence from 39 to 56.8 % by changing the cutoff value (Table 2). There is therefore a problem of both index choice and cut off value, not forgetting the type of tooth wear regis-tered. Studies considering erosion, attrition (wear result-ing from tooth to tooth grindresult-ing) and abrasion (wear resulting from tooth to other hard surfaces) showed higher prevalences [18, 22, 26, 27] compared with others (Table 1). This could be explained by an easier differen-tial diagnosis in the young population than in the adult one [2, 24, 49]. Finally, the kind of tooth examined influenced the DE prevalence: the examination of maxil-lary incisors decreased significantly the DE prevalence whereas there was no significant difference between other situations (Table 2). Our results confirm those of other studies, since erosion was found to be greater in posterior than in anterior teeth and the most frequently affected teeth were the lower first molars [2, 3, 16, 17, 22, 31, 33] (Table 3). The most common clinical mani-festation of DE was the appearance of cup-like lesions on the cusp tip of lower first molars. By contrast, other studies have recorded DE mainly on anterior teeth [4, 5, 9–11, 24, 28, 29] where loss of smooth surface enamel is more difficult to see [50]. Yet our examination condi-tions in schools were optimal due to adequate light and drying facilities. The absence of DE on mandibular inci-sors in Table 2 is due to their protection from acid at-tack by the high flow of submandibular saliva [5]. Thus the examination of upper incisors alone and first molars appears sufficient in prevalence studies carried out in adolescents at an age to be fixed by consensus. In the present study, the age of 14 years was used for examin-ation of all teeth due to exposition to possible intrinsinc and extrinsinc aetiological factors for some time; if examining upper incisors and first molars can be consid-ered sufficient, adolescents could be examined at the age of 12. This age should allow both DE prevalence and dental caries to be registered in the same study. Regard-ing severity, the first degree involvRegard-ing the enamel alone was most common, as has been reported in most of the studies in adolescents [4–7, 10–12, 19–21, 28, 30, 32, 34, 49]. To conclude this first part focusing on prevalence, the limitations of the present study should be Table 3BEWE scores according to affected teeth in 331 subjects
17–27 16–26 15–25 14–24 13–23 12–22 11–21 31–41 32–42 33–43 34–44 35–45 36–46 37–47
Score 1 B 1 (0.2) 22 (3.3) 10 (1.5) 8 (1.2) 21 (3.2) 12 (1.8) 17 (2.6) 8 (1.2) 5 (0.8) 5 (0.8) 8 (1.2) 10 (1.5) 16 (2.4) 3 (0.5)
O 4 (0.6) 180 (22.7) 81 (12.2) 13 (2.0) 32 (4.8) 133 (20.1) 237 (35.8) 43 (6.5)
L 3 (0.5) 1 (0.2) 4 (0.6) 2 (0.3) 2 (0.3) 2 (0.3) 5 (0.8)
Score 2 B 1 (0.2)
O 4 (0.6) 30 (4.5) 8 (1.2) 1 (0.2) 17 (2.6) 93 (14.1) 10 (1.5)
L
BBuccal,Oocclusal,Llingual,BEWEBasic Erosive Wear Examination
considered. The study sample was not nationally repre-sentative. As the majority of prevalence studies [4–8, 10–12, 16–31, 33–35] (Table 1), it was a stratified sam-ple in a particular area fairly representative of the target population. Thus the application of the results to the French population needs to be confirmed.
Dental erosion is considered a multifactorial condition. Because the present study was cross-sectional and not longitudinal, the design only permitted an analysis of the association between known risk factors and experience of DE in French adolescents to highlight eventual
particular cultural behaviors. As in previous studies [17, 24], no significant difference in the prevalence of DE between urban and rural areas was found in adjusted logistic regression analyses. Contrary to the majority of the studies [3, 5, 8–11, 16–18, 25, 28, 33, 34], socio-economic status was associated with the experience of DE: the present study confirmed a significantly higher DE prevalence in the lowest social category [12, 24, 26, 32, 35, 49] more often cited than the contrary [7, 23]. The use of different indices could again explain these different results, because the significance of the Table 4Association between erosive experience (total BEWE≥3) and independent variables. Unadjusted and adjusted logistic regression analyses
Independent variables number Erosive experience (Total BEWE≥3)
Non(%) Yesn(%) Unadjusted
OR (95 %)
Adjusted OR (95 %)
Adjusted OR (95 %)
Socio-economic category No PES 291 186 (64) 105 (36) 1 1 1
PES 40 16 (40) 24 (60) 2.7 (1.4–5.2) 2.2 (1.1–4.7) 2.2 (1.1–4.7)
Area of residence Rural 17 6 (35) 11 (65) 1 1 1
Urban 314 196 (62) 118 (38) 0.3 (0.1–0.9) 0.4 (0.1–1.1) 0.3 (0.1–1.0)
Sex1 Female 174 110 (63) 64 (37) 1 Not included Not included
Male 157 92 (59) 65 (41) 1.2 (0.8–1.9)
Dental biofilm No visible 247 163 (66) 84 (34) 1 1 1
Visible 84 39 (46) 45 (55) 2.2 (1.4–3.7) 1.8 (1.1–3.3) 1.8 (1.0–3.1)
ICDAS 4–6 carious lesions No 285 183 (64) 102 (36) 1 1 Not included
Yes 46 19 (41) 27 (59) 2.6 (1.4–4.8) 1.3 (0.6–2.7)
ICDAS 1–6 carious lesions No 172 118 (69) 54 (31) 1 Not included 1
Yes 159 84 (53) 75 (47) 2.0 (1.3–3.1) 1.4 (0.9–2.4)
Fluoride toothpastec 1 No 61 41 (67) 20 (33) 1 Not included Not included
Yes 270 161 (60) 109 (40) 1.4 (0.8–2.5)
Dentist control during the past year1 No 73 42 (57) 31 (43) 1 Not included Not included
Yes 258 160 (62) 98 (38) 0.8 (0.5–1.4)
Acid reflux/repeated vomiting1 No 295 181 (61) 114 (39) 1 Not included Not included
Yes 36 21 (58) 15 (42) 1.1 (0,6–2.3)
Daily acidic beveragea No 270 184 (68) 86 (32) 1 1 1
Yes 61 18 (29) 43 (71) 5.1 (2.8–9.4) 3.8 (2.0–7.3) 3.6 (1.9–7.0)
Daily energy/sports drinksb 1 No 326 200 (61) 126 (39) 1 Not included Not included
Yes 5 2 (40) 3 (60) 2.4 (0.4–14.5)
Daily aicidic sweets No 299 195 (65) 104 (35) 1 1 1
Yes 32 7 (22) 25 (78) 6.7 (2.8–16.0) 2.9 (1.1–7.5) 3.0 (1.2–7.6)
Daily acid fresh fruits1 No 277 172 (62) 105 (38) 1 Not included Not included
Yes 54 31 (57) 23 (43) 1.3 (0.7–2.4)
Retained drink in the mouth after drinking No 298 189 (63) 109 (37) 1 1 1
Yes 33 13 (39) 20 (61) 2.7 (1.3–5.6) 1.8 (0.8–4.2) 1.9 (0.8–4.3)
Daily vitamin C No 298 178 (60) 120 (40) 1 Not included Not included
Yes 33 24 (73) 9 (27) 0.6 (0.3–1.2)
All consumers drank acidic beverages during and between meals: 94 % of them were sugared and the most consumed beverages were Cola (89 %)a
and Powerade (71 %)b
. 1 (9.4 %) or 2 (90.3 %) daily tooth brushingc
. ICDAS 4–6 or ICDAS 1–6 carious lesions were included in the adjusted logistic regression analyses.1
p > 0.1
association differed according the indices used in the same study [35]. Indeed socio-economic status had no effect on the dependant variable when a cutoff value of 1 was chosen (Table 5). Sex was not associated with DE prevalence, a result that is in accordance with numerous studies [4, 5, 7, 9–12, 17, 18, 25, 34, 35]. This may be ex-plained by a similar pattern of exposure to risk factors in both sexes. A higher prevalence in males was found more particularly in studies which considered all tooth wear [22, 26, 30] and it was explained by differences in muscular strength and biting forces [26]. However, others studies targeting only DE found significant
differences between the sexes [2, 3, 24, 28, 29, 31, 33] and one study showed a higher prevalence in girls [24].
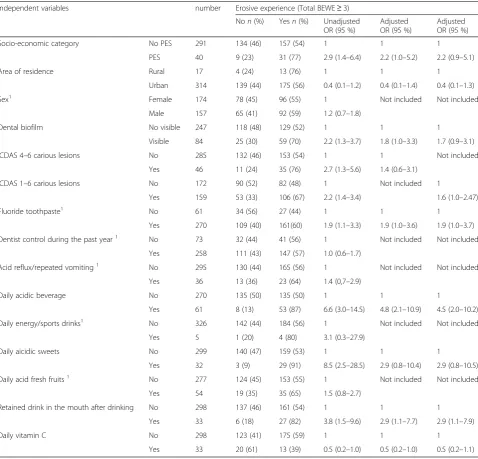
Concerning oral health, the significantly greater occur-rence of DE in the presence of carious lesions ICDAS 1–6 or 4–6 was inconsistent because the relationships were not statistically significant in adjusted logistic regression analyses (Table 4). This is in agreement with different studies using the DMFT (Decayed, Missing, Filled Teeth) index as independent variable [5, 11, 20, 31, 33]. However, caries experience was greater [25, 28] or lesser in ado-lescents with erosive experience [22] according to the studies. These different results could be explained by Table 5Association between erosive experience (total BEWE≥1) and independent variables. Unadjusted and adjusted logistic regression analyses
Independent variables number Erosive experience (Total BEWE≥3)
Non(%) Yesn(%) Unadjusted
OR (95 %)
Adjusted OR (95 %)
Adjusted OR (95 %)
Socio-economic category No PES 291 134 (46) 157 (54) 1 1 1
PES 40 9 (23) 31 (77) 2.9 (1.4–6.4) 2.2 (1.0–5.2) 2.2 (0.9–5.1)
Area of residence Rural 17 4 (24) 13 (76) 1 1 1
Urban 314 139 (44) 175 (56) 0.4 (0.1–1.2) 0.4 (0.1–1.4) 0.4 (0.1–1.3)
Sex1 Female 174 78 (45) 96 (55) 1 Not included Not included
Male 157 65 (41) 92 (59) 1.2 (0.7–1.8)
Dental biofilm No visible 247 118 (48) 129 (52) 1 1 1
Visible 84 25 (30) 59 (70) 2.2 (1.3–3.7) 1.8 (1.0–3.3) 1.7 (0.9–3.1)
ICDAS 4–6 carious lesions No 285 132 (46) 153 (54) 1 1 Not included
Yes 46 11 (24) 35 (76) 2.7 (1.3–5.6) 1.4 (0.6–3.1)
ICDAS 1–6 carious lesions No 172 90 (52) 82 (48) 1 Not included 1
Yes 159 53 (33) 106 (67) 2.2 (1.4–3.4) 1.6 (1.0–2.47)
Fluoride toothpaste1 No 61 34 (56) 27 (44) 1 1 1
Yes 270 109 (40) 161(60) 1.9 (1.1–3.3) 1.9 (1.0–3.6) 1.9 (1.0–3.7)
Dentist control during the past year1 No 73 32 (44) 41 (56) 1 Not included Not included
Yes 258 111 (43) 147 (57) 1.0 (0.6–1.7)
Acid reflux/repeated vomiting1 No 295 130 (44) 165 (56) 1 Not included Not included
Yes 36 13 (36) 23 (64) 1.4 (0,7–2.9)
Daily acidic beverage No 270 135 (50) 135 (50) 1 1 1
Yes 61 8 (13) 53 (87) 6.6 (3.0–14.5) 4.8 (2.1–10.9) 4.5 (2.0–10.2)
Daily energy/sports drinks1 No 326 142 (44) 184 (56) 1 Not included Not included
Yes 5 1 (20) 4 (80) 3.1 (0.3–27.9)
Daily aicidic sweets No 299 140 (47) 159 (53) 1 1 1
Yes 32 3 (9) 29 (91) 8.5 (2.5–28.5) 2.9 (0.8–10.4) 2.9 (0.8–10.5)
Daily acid fresh fruits1 No 277 124 (45) 153 (55) 1 Not included Not included
Yes 54 19 (35) 35 (65) 1.5 (0.8–2.7)
Retained drink in the mouth after drinking No 298 137 (46) 161 (54) 1 1 1
Yes 33 6 (18) 27 (82) 3.8 (1.5–9.6) 2.9 (1.1–7.7) 2.9 (1.1–7.9)
Daily vitamin C No 298 123 (41) 175 (59) 1 1 1
Yes 33 20 (61) 13 (39) 0.5 (0.2–1.0) 0.5 (0.2–1.0) 0.5 (0.2–1.1)
consumption habits of acidic beverages, sugar-free (light) or regular soda drinks. In the present study, this tendency to proportional relationship between carious lesions and DE could be explained by a higher propor-tion of participants who consumed acid and sugar-containing cola beverages. The inconsistent relationship between DE and cavitated carious lesions can be ex-plained by the inclusion of visible dental biofilm in one adjusted logistic regression analysis (Table 4). In all cases, the associations were close to statistical signifi-cance (Tables 4 and 5). Usually, dental biofilm protects enamel from erosive lesions, especially on anterior teeth. In contrast, the main consumption of both sug-ary and acidic beverages or sweets in the present study increased the quantity of dental plaque, which was sig-nificantly associated with higher DE prevalence. As in other studies [3, 12, 15, 16, 22, 24, 30], no statistically significant association was observed between oral be-haviours (daily toothbrushing with fluoride toothpaste, dental examination during the past year) and DE. Only the study of Bardolia et al. [31] showed that a brushing twice a day increased the risk of DE.
Thus, diet plays a major role. In agreement with the ma-jority of studies in adolescents since the 2000s, strong as-sociations were found between DE and acidic beverages [6, 12, 15, 17, 20, 23–25, 30, 31] or sweets [17, 18, 23] (Table 4). However, the acidic beverage was the sole risk factor to have an effect on the DE, whatever the cutoff value of total BEWE score (Tables 4 and 5). In France, this could be due to a parent education problem about oral health because drinks and food dispensers have been pro-hibited in schools since 2005. The method of drinking, keeping or not the beverage in the mouth, was also associ-ated with DE [13, 15–17, 30]. Only two studies did not show these associations [4, 11]. In the present study, the method of drinking had an effect on the DE for a cutoff value of 1. The frequent behaviour of children of retaining a drink in the mouth could be explained by a particular position of the tongue, the higher DE rates on second premolars compared with first premolars. While there are conflicting results from different studies, the present work confirms the most frequent results for sports drinks [6, 8, 9, 19, 24, 29], fresh fruits [6, 8, 9, 13, 24, 31] and daily vitamin C [9, 17] which were not associated with DE. Only one study (sports drinks; [15]) and four studies (fresh fruits; [17–19, 22]) showed contrary results; in the case of fresh fruits, this concerned only oranges [22], lemon [17] or banana [19]. The present study confirmed that acid reflux and repeated vomiting were not associated with DE in ado-lescents [9, 11, 14, 24, 29]. Only two studies, both using TWI modified indices (which over assess DE), reported the contrary [15, 16]. This setting can some-times be difficult to evaluate due to its subjectivity.
Conclusion
The DE prevalence in Alpes Maritimes (France) was mated to reach 39 %. It is difficult to compare this esti-mate with other national prevalences due to the wide range of indices, choice of teeth and age used in different studies. Although the BEWE index has been recom-manded, the cut-off value of 1 still needs to be stipulated, for comparison with recent studies. The examination of maxillary incisors and first permanent molars appeared sufficient for assessing DE prevalence. Finally, the age of examination should be discussed because using 12-year-olds would have the advantage of allowing a prevalence study of both DE and caries prevalence.
Abbreviations
DE:Dental erosion; BEWE: Basic Erosive Wear Examination; AM: Alpes Martimes; PES: Priority education schools; ICDAS: International Caries Detection and Assessment System; TWI: Tooth wear index; DMFT Decayed: missing, filled teeth; OR: Odds ratio; 95 % CI: 95 % confidence interval.
Competing interests
This study was supported by a grant from the CG06 (Alpes Maritimes) and GABA International. The supporters played no role in data collection and analysis. The authors declare that they have no conflicts of interest.
Authors’contributions
Some authors have made substantial contributions to conception and design of the study (LLP, MMB), acquisition (TB, MMB) analysis (LLP, MMB) and interpretation of data (FC, VSF, MMB); MMB has been involved in drafting the manuscript; FC and VSF have been involved in revising it critically for intellectual content. All authors read and approved the final manuscript.
Author details
1Dental Faculty, University Nice Sophia Antipolis. CHUN, Nice, France.2URB2i
- EA 4462, University Paris Descartes, Montrouge, France.3Dental Faculty, University Paris Descartes, Montrouge, France.
Received: 5 August 2015 Accepted: 9 November 2015
References
1. Lussi A, Ganss C. Erosive tooth wear from diagnosis to therapy. 2nd ed. Basel: Ed Karger; 2014. p. 278.
2. Arnadottir IB, Holbrook WP, Eggertsson H, Gudmundsdottir H, Jonsson SH, Gudlaugsson JO, et al. Prevalence of dental erosion in children: a national survey. Community Dent Oral Epidemiol. 2010;38(6):521–6.
3. McGuire J, Szabo A, Jackson S, Bradley TG, Okunseri C. Erosive tooth wear among children in the United States: relationship to race/ethnicity and obesity. Int J Paediatr Dent. 2009;19(2):91–8.
4. Correr GM, Alonso RCB, Correa MA, Campos EA, Baratto-Filho F, Puppin-Rontani RM. Influence of diet and salivary characteristics on the prevalence of dental erosion among 12-year-old schoolchildren. J Dent Child. 2009;76(3):181–7.
5. Auad SM, Waterhouse PJ, Nunn JH, Steen N, Moynihan PJ. Dental erosion amongst 13- and 14-year-old Brazilian schoolchildren. Int Dent J. 2007;57(3):161–7.
6. Waterhouse PJ, Auad SM, Nunn JH, Steen IN, Moynihan PJ. Diet and dental erosion in young people in south-east Brazil. Int J Paediatr Dent. 2008;18(5):353–60.
7. Peres KG, Armênio MF, Peres MA, Traebert J, De Lacerda JT. Dental erosion in 12-year-old schoolchildren: a cross-sectional study in Southern Brazil. Int J Paediatr Dent. 2005;15(4):249–55.
8. Aguiar YPC, dos Santos FG, de Moura EFF, da Costa FCM, Auad SM, de Paiva SM, et al. Association between dental erosion and diet in Brazilian adolescents aged from 15 to 19: a population-based study. Sci World J. 2014;2014:818167. doi:10.1155/2014/818167.
9. Gurgel CV, Rios D, de Oliveira TM, Tessarolli V, Carvalho FP, de Machado MA. Risk factors for dental erosion in a group of 12- and 16-year-old Brazilian schoolchildren. Int J Paediatr Dent. 2011;21(1):50–7.
10. Gurgel CV, Rios D, Buzalaf MAR, da Silva SMB, Araújo JJ, Pauletto ARC, et al. Dental erosion in a group of 12- and 16-year-old Brazilian schoolchildren. Pediatr Dent. 2011;33(1):23–8.
11. Vargas-Ferreira F, Praetzel JR, Ardenghi TM. Prevalence of tooth erosion and associated factors in 11–14-year-old Brazilian schoolchildren. J Public Health Dent. 2011;71(1):6–12.
12. Habib M, Hottel TL, Hong L. Prevalence and risk factors of dental erosion in American children. J Clin Pediatr Dent. 2013;38(2):143–8.
13. Okunseri C, Okunseri E, Gonzalez C, Visotcky A, Szabo A. Erosive tooth wear and consumption of beverages among children in the United States. Caries Res. 2011;45(2):130–5.
14. Alvarez Loureiro L, Fabruccini Fager A, Alves LS, Alvarez Vaz R, Maltz M. Erosive Tooth Wear among 12-Year-Old Schoolchildren: A Population-Based Cross-Sectional Study in Montevideo, Uruguay. Caries Res. 2015;49(3):216–25. 15. Hamasha AA-H, Zawaideh FI, Al-Hadithy RT. Risk indicators associated with
dental erosion among Jordanian school children aged 12–14 years of age. Int J Paediatr Dent. 2014;24(1):56–68.
16. Al-Majed I, Maguire A, Murray JJ. Risk factors for dental erosion in 5–6 year old and 12–14 year old boys in Saudi Arabia. Community Dent Oral Epidemiol. 2002;30(1):38–46.
17. Kumar S, Acharya S, Mishra P, Debnath N, Vasthare R. Prevalence and risk factors for dental erosion among 11- to 14-year-old school children in South India. J Oral Sci. 2013;55(4):329–36.
18. Sanhouri NM, Ziada HM, Ahmed GI, Kamis AH. Tooth surface loss, prevalence and associated risk factors among 12–14 years school children in Khartoum State, Sudan. Community Dent Health. 2010;27(4):206–12.
19. Huew R, Waterhouse PJ, Moynihan PJ, Kometa S, Maguire A. Dental erosion and its association with diet in Libyan schoolchildren. Eur Arch Paediatr Dent. 2011;12(5):234–40.
20. Huew R, Waterhouse P, Moynihan P, Kometa S, Maguire A. Dental caries and its association with diet and dental erosion in Libyan schoolchildren. Int J Paediatr Dent. 2012;22(1):68–76.
21. Huew R, Waterhouse PJ, Moynihan PJ, Maguire A. Dental erosion among 12 year-old Libyan schoolchildren. Community Dent Health. 2012;29(4):279–83. 22. Abu-Ghazaleh SB, Burnside G, Milosevic A. The prevalence and associated
risk factors for tooth wear and dental erosion in 15- to 16-year-old schoolchildren in Amman, Jordan. Eur Arch Paediatr Dent. 2013;14(1):21–7. 23. El Karim IA, Sanhouri NM, Hashim NT, Ziada HM. Dental erosion among
12–14 year old school children in Khartoum: a pilot study. Community Dent Health. 2007;24(3):176–80.
24. Wang P, Lin HC, Chen JH, Liang HY. The prevalence of dental erosion and associated risk factors in 12–13-year-old school children in Southern China. BMC Public Health. 2010;10:478.
25. Zhang S, Chau AM, Lo EC, Chu C-H. Dental caries and erosion status of 12-year-old Hong Kong children. BMC Public Health. 2014;14:7. 26. Bardsley PF, Taylor S, Milosevic A. Epidemiological studies of tooth wear
and dental erosion in 14-year-old children in North West England. Part 1: The relationship with water fluoridation and social deprivation. Br Dent J. 2004;197(7):413–6.
27. Milosevic A, Bardsley PF, Taylor S. Epidemiological studies of tooth wear and dental erosion in 14-year old children in North West England. Part 2: The association of diet and habits. Br Dent J. 2004;197(8):479–83. 28. Dugmore CR, Rock WP. The prevalence of tooth erosion in 12-year-old
children. Br Dent J. 2004;196(5):279–82. discussion 273.
29. Arnadóttir IB, Saemundsson SR, Holbrook WP. Dental erosion in Icelandic teenagers in relation to dietary and lifestyle factors. Acta Odontol Scand. 2003;61(1):25–8.
30. van Rijkom HM, Truin GJ, Frencken JEFM, König KG, van’t Hof MA, Bronkhorst EM, et al. Prevalence, distribution and background variables of smooth-bordered tooth wear in teenagers in the hague, the Netherlands. Caries Res. 2002;36(2):147–54.
31. Bardolia P, Burnside G, Ashcroft A, Milosevic A, Goodfellow SA, Rolfe EA, et al. Prevalence and risk indicators of erosion in thirteen- to fourteen-year-olds on the Isle of Man. Caries Res. 2010;44(2):165–8.
32. Dugmore CR, Rock WP. The progression of tooth erosion in a cohort of adolescents of mixed ethnicity. Int J Paediatr Dent. 2003;13(5):295–303. 33. Truin GJ, van Rijkom HM, Mulder J, van’t Hof MA. Caries trends
1996–2002 among 6- and 12-year-old children and erosive wear
prevalence among 12-year-old children in The Hague. Caries Res. 2005;39(1):2–8.
34. El Aidi H, Bronkhorst EM, Truin GJ. A longitudinal study of tooth erosion in adolescents. J Dent Res. 2008;87(8):731–5.
35. Margaritis V, Mamai-Homata E, Koletsi-Kounari H, Polychronopoulou A. Evaluation of three different scoring systems for dental erosion: a comparative study in adolescents. J Dent. 2011;39(1):88–93. 36. Salas MMS, Nascimento GG, Huysmans MC, Demarco FF. Estimated
prevalence of erosive tooth wear in permanent teeth of children and adolescents: An epidemiological systematic review and meta-regression analysis. J Dent. 2015;43(1):42–50.
37. Bartlett DW, Lussi A, West NX, Bouchard P, Sanz M, Bourgeois D. Prevalence of tooth wear on buccal and lingual surfaces and possible risk factors in young European adults. J Dent. 2013;41(11):1007–13.
38. Young A, Amaechi BT, Dugmore C, Holbrook P, Nunn J, Schiffner U, et al. Current erosion indices—flawed or valid? Summary. Clin Oral Investig. 2008;12 Suppl 1:S59–63.
39. Bartlett D, Harding M, Sherriff M, Shirodaria S, Whelton H. A new index to measure tooth wear—methodolgy and practical advice. Community Dent Health. 2011;28(2):182–7.
40. Holbrook WP, Arnadóttir IB, Hlöðversson SO, Arnarsdóttir E, Jónsson SH, Sæmundsson SR. The Basic Erosive Wear Examination (BEWE) applied retrospectively to two studies. Clin Oral Investig. 2014;18(6):1625–9. 41. Olley RC, Wilson R, Bartlett D, Moazzez R. Validation of the Basic Erosive
Wear Examination. Caries Res. 2014;48(1):51–6.
42. O’Brien M. Children’s Dental Health in the UK 1993. London: HMSO; 1994. p. 27–9.
43. Milosevic A, Young PJ, Lennon MA. The prevalence of tooth wear in 14-year-old school children in Liverpool. Community Dent Health. 1994;11(2):83–6.
44. Lussi A, Schaffner M. Progression of and risk factors for dental erosion and wedge-shaped defects over a 6-year period. Caries Res. 2000;34(2):182–7.
45. Clara J, Bourgeois D, Muller-Bolla M. DMF from WHO basic methods to ICDAS II advanced methods: a systematic review of literature. Odontostomatol Trop. 2012;35(139):5–11.
46. Bartlett D, Ganss C, Lussi A. Basic Erosive Wear Examination (BEWE): a new scoring system for scientific and clinical needs. Clin Oral Investig. 2008;12 Suppl 1:S65–8.
47. Mulic A, Tveit AB, Wang NJ, Hove LH, Espelid I, Skaare AB. Reliability of two clinical scoring systems for dental erosive wear. Caries Res. 2010;44(3):294–9.
48. Vered Y, Lussi A, Zini A, Gleitman J, Sgan-Cohen HD. Dental erosive wear assessment among adolescents and adults utilizing the basic erosive wear examination (BEWE) scoring system. Clin Oral Investig. 2014;18(8):1985–90.
49. Al-Dlaigan YH, Shaw L, Smith A. Dental erosion in a group of British 14-year-old, school children. Part I: Prevalence and influence of differing socioeconomic backgrounds. Br Dent J. 2001;190(3):145–9.
50. Milosevic A. The problem with an epidemiological index for dental erosion. Br Dent J. 2011;211(5):201–3.
51. Smith BG, Knight JK. A comparison of patterns of tooth wear with aetiological factors. Br Dent J. 1984;157(1):16–9.
52. Millward A, Shaw L, Smith AJ, Rippin JW, Harrington E. The distribution and severity of tooth wear and the relationship between erosion and dietary constituents in a group of children. Int J Paediatr Dent Br Paedodontic Soc Int Assoc Dent Child. 1994;4(3):151–7.
53. Kelly M, Steele J, Nuttall N. Adult Dental Health Survey: Oral Health in the United Kingdom 1998. London: Office for National Statistics.
54. Lussi A. Dental erosin clinical diagnosis and case history taking. Eur J Oral Sci. 1996;104(Part 2):191–8.
55. O’Sullivan EA. A new index for measurement of erosion in children. Eur J Paediatr Dent. 2000;2(1):69–74.
56. Walker A, Gregory J, Bradnock G. National Diet and Nutrition Survey: young people aged 4 to 18 years. Volume 2: Report of the oral health survey 2000. London: The Stationery Office.