R E S E A R C H A R T I C L E
Open Access
Trends in the utilisation of aged care services
in Australia, 2008
–
2016
Jyoti Khadka
1,2,3*, Catherine Lang
1, Julie Ratcliffe
3, Megan Corlis
4, Steve Wesselingh
1, Craig Whitehead
3and
Maria Inacio
1,5Abstract
Background:Aged care support services in Australia are delivered through home care packages, permanent residential care, respite care and transition care. This study aimed to determine age and gender specific incidence rates of aged care service utilisation in Australia between 2008-09 and 2015–16.
Methods:This is a population-based epidemiological study of people accessing aged care services in Australia. The trends and characteristics of people (over the age of 65 years old) accessing aged care services in Australia were evaluated, using data (2008–09 and 2015–16) from the Australian Institute of Health and Welfare and Australian Bureau of Statistics. The yearly utilisation incidence rates (per 1000 people) per service type were calculated and changes in incidence rate ratios (IRR) of service utilisation for the study period were estimated using Poisson regression models. Results:The proportion of older Australians aged≥65 years who used aged care services remained similar between 2008-09 (5.4%,N= 208,247) and 2015–16 (5.6%,N= 248,669). However, the incidence use of specific services changed during the study period. Specifically, admissions into permanent residential care decreased (from 23.8/ 1000 people in 2008–09 to 19.6/1000 in 2015–16, at a IRR of 0.84/year,p< 0.001) but increased for transition care (from 4.3/1000 in 2008–09 to 6.6/1000 in 2015–16, at a IRR of 1.57/year,p< 0.001) and home care packages (from 8.04/1000 in 2008–09 to 12.0/1000 per 1000 in 2015–16, at a IRR of 1.52/year,p< 0.001). Between 2008-09 and 2015–16, the greatest changes in IRR were observed in males aged 80–89 years accessing transition care (IRR = 1.68/year,p< 0.001). A higher proportion of people aged between 80-89 years (≥45%), females (≥60%), Australia born (≥60%) and English speakers (≥80%) used all the service types.
Conclusions:Patterns of service utilisation for aged care services changed over the study period with a decrease in incidence of individuals accessing permanent residential care but increased for other service types. This finding reflects changes in attitudes regarding ageing in place and policies. These findings are helpful to inform key stakeholders on service planning to further improve quality of the aged-care services in Australia.
Keywords:Aged care, Utilisation, Incidence rate, Home care, Permanent residential care, Respite care, Transition care
Introduction
In common with other Organization for Economic Co-operation and Development countries, the population of Australia is progressively aging with a relatively larger proportion of its population aged 65 years or above com-pared to 20 years ago [1]. In 2015–16, 15% (3.4 million) of residents were over 65 years old and this proportion is
projected to increase to 19% by 2031 [2]. Currently 7% of those over 65 years of age are receiving residential aged care services [3]. This group are also heavy users of health services accounting for a significant proportion (41%) of all hospitalisations and days spent in hospital (48%) [4]. In 2015–16 the Australian government spent $17 billion dollars on aged care services, with over two thirds of this spending allocated to residential aged care services, and this expenditure is expected to rise signifi-cantly over the coming decades [5].
Aged care services in Australia have been subsidised by the Federal Government since 1963 and over time
© The Author(s). 2019Open AccessThis article is distributed under the terms of the Creative Commons Attribution 4.0 International License (http://creativecommons.org/licenses/by/4.0/), which permits unrestricted use, distribution, and reproduction in any medium, provided you give appropriate credit to the original author(s) and the source, provide a link to the Creative Commons license, and indicate if changes were made. The Creative Commons Public Domain Dedication waiver (http://creativecommons.org/publicdomain/zero/1.0/) applies to the data made available in this article, unless otherwise stated.
* Correspondence:Jyoti.khadka@sahmri.com
1
Healthy Ageing Research Consortium, Registry of Older South Australians, South Australian Health and Medical Research Institute, North Terrace, PO Box: 11060, Adelaide, SA 5001, Australia
2Institute for Choice, University of South Australia, Adelaide, Australia
have evolved into a variety of service provision pro-grammes. Commencing 2003 an Aged Care Assessment Team (ACAT) approval is required to access aged care ser-vices. An ACAT carries out assessments under the Federal Government’s Aged Care Assessment programme (ACAP) to determine an individual’s care needs, eligibility for ser-vices, recommendations for specific type of support needed and the level of aged care programme to be assigned. Briefly, aged care services currently in existence in Australia are:
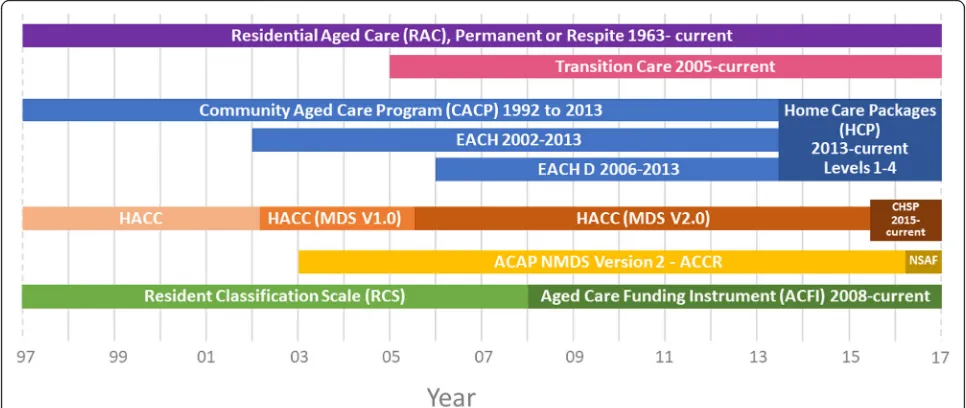
1. Home care packages (HCP):HCP have a focus on supporting people to remain living at home and in their own communities for as long as possible and thereby preventing premature or inappropriate admission to permanent residential aged care. Both in 2013 and 2015, the structure of HCP changed, with programmes in existence previously (Community Aged Care Packages, Extended Aged-Care at Home; and Extended Aged Care at Home-Dementia, Home and Community Care) replaced by‘Home Care Packages Programme’ and‘Commonwealth Home Support Programme’ respectively (Fig.1);
2. Residential Aged Care (RAC):There are two types of programmes delivered through RAC services: permanent residential aged care (PRAC) and respite residential care (RRC) [5].PRACprovides
government subsidised institutional residential aged care services for those who are not coping well at home. Government funding is allocated based on
means-tested income fees for these services.RRC
provides short-term relief or break to care recipients or their usual carers in residential care facilities from their usual arrangements. This may be arranged for planned breaks, holidays or in case of emergencies [6];
3. Transition Care (TC):TC provides a short-term care to older people leaving hospital or those who have accessed or who are deemed eligible for at least low-level PRAC. TC aims to provide services during the transition to facilitate recovery from illness, improve functioning and independence to delay or avoid entry into PRAC [7].
The aged care services are co-funded by both the Australian Government and the service users. The gov-ernment regulates the maximum costs clients are re-quired to pay and subsidises a range of services. The amount of government subsidy is determined by the types of services (e.g. home vs residential aged care), level of care needs and the individual’s income and/or assets (i.e. means-tested). The Australian Government also has targets for subsidised long-term care places for every 1000 people over 70 years old, which were around 111–113 during the study period, and the ratio of home care to residential care has been increasing [8].
As the aged care services and their provision in Australia have changed dramatically in the last couple of decades due to legislative reforms [9], changes in demo-graphics and health care needs of the recipients [3, 10], and consumer preferences have also likely changed.
Therefore, population based epidemiological evaluations of the change in incidence rate of aged care utilisation across different service types and subgroups of individ-uals would be of value to understand the changes in in-dividuals accessing services. Specifically, the aim of this study was to describe patterns of service use and to esti-mate the rate of change by age and gender specific groups between 2008-09 and 2015–16 in Australia.
Methods
Study design, setting, and data sources
A population based epidemiological study was con-ducted using publicly available data from Australian In-stitute of Health and Welfare (AIHW) GEN Aged Care Data [11–13] and the Australian Bureau of Statistics (ABS). From the AIHW GEN Aged Care Data the de-identified datasets describing admissions into aged care were obtained. From the ABS Australian historical popu-lation estimates for the same time periods as the AIHW GEN Aged Care data were obtained.
Study population
People≥65 years who were admitted to HCP, RAC, and TC aged care programmes in Australia between July 1st 2008 to June 30th 2016 were included.
Variables
The incidence of annual admissions into PRAC, RRC, HCP, or TC services were obtained from the AIHW GEN Aged Care data admissions files for the years of 2008–09 to 2015–16 [12]. These datasets offer de-identi-fied information on new admissions into services each year, including the individuals’ age, gender, country of birth, preferred language spoken at home and indigen-ous status. We accessed the datasets between 2008-09 and 2015–16 to determine trends of admission into dif-ferent aged care services.
Cohort characteristics evaluated by year included: age (stratified as 65–79, 80–89, ≥90 years); gender; country of birth (stratified as Australia, Other Non-English-speaking country, Other English-Non-English-speaking country); pre-ferred language spoken at home (English vs other).
Statistical analysis
Data were analysed using SAS (Version 9.2, SAS Insti-tute, Cary, NC, USA) and STATA MP 15.1 (StataCorp, Texas, USA). Summary statistics including frequencies and proportions were calculated to describe the study population. The incidence of aged care service utilisation rate and 95% confidence intervals (CI) per 1000 Austra-lian citizens≥65 years (from ABS data) per financial year were estimated. Overall incidence of aged care service utilisation rates and by age and gender groups were eval-uated. Historical changes in the incidence of aged care
utilisation per year were modelled using Poisson regres-sion. The changes in the incidence of aged care service utilisation rate over time were calculated using incidence rate ratios (IRRs). Models were adjusted by age, gender, and state. IRRs and 95% CI were reported. All reported
P values were considered statistically significant when less than 0.05 (α). This study adheres with the tenets of the declaration of Helsinki.
Results
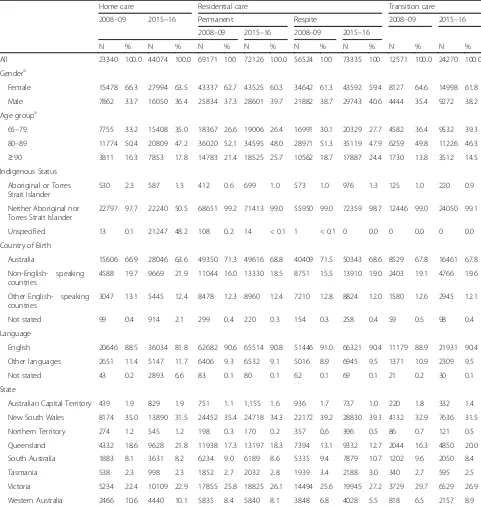
In 2015–16, there were 3.7 million (15% of total popula-tion) people age 65 years old and older, an increase of 0.79 million (27%) from 2008 to 09 in Australia. Over the same period, older people accessing aged care service increased by 19%, from 208,247 in 2008–09 to 248,669 in 2015–16. Both in 2008–09 and 2015–16, a higher proportion of older people entering the aged care system were females (> 60%), aged between 80-89 years old (≥45%), Australia born (> 63%), English speaking (> 80%) and non ATSI (> 98%), Table 1.
The proportion of Australian residents age 65 years old and older who used the aged care services remained the same between 2008-09 (5.4%, N = 208, 247) and 2015–16 (5.6%, 248,669). However, the inci-dence rate of admission to specific types of services changed during the study period, Table 1. The inci-dence rate of admissions to PRAC decreased from 23.8/1000 people in 2008–09 to 19.6/1000 in 2015– 16, at an adjusted IRR of 0.84/year (p < 0.001) over the period. The incidence rate of admission to HCP services increased from 8.04/1000 in 2008–09 to 12.0/ 1000 in 2015–16 at a IRR of 1.52/year (p < 0.001) over the period and for TC services from 4.3/1000 in 2008–09 to 6.6/1000 in 2015–16 at a IRR of 1.57/year (p < 0.001), Fig. 2. The incidence rate of admission to respite care increased slightly from 19.5/1000 in 2008–09 to 19.9/1000 in 2015–16, at a IRR of 1.05/ year (p< 0.001) over the study period.
a IRR of 0.93/year (p < 0.001), whereas all other gen-der and age groups observed increases in incidence rates of admissions (Table 2 & Fig. 3). Between 2014 and 2015, in those aged 79 year and above a decrease in incidence rate of admission to PRAC and increase in admission to HCP and respite care services was observed, Fig. 3.
Discussion
This study provides a comprehensive Australia wide in-cidence of admission into services, rate of change in ad-missions, and demographic profiles of older people who have commenced aged care services during the most re-cent period for which data is available. The proportion of people accessing aged care services remained similar
Table 1Characteristics of people admitted to Aged Care Services in 2008–09 and 2015–16
Home care Residential care Transition care
2008–09 2015–16 Permanent Respite 2008–09 2015–16
2008–09 2015–16 2008–09 2015–16
N % N % N % N % N % N % N % N %
All 23340 100.0 44074 100.0 69171 100 72126 100.0 56524 100 73335 100 12571 100.0 24270 100.0
Gendera
Female 15478 66.3 27994 63.5 43337 62.7 43525 60.3 34642 61.3 43592 59.4 8127 64.6 14998 61.8
Male 7862 33.7 16050 36.4 25834 37.3 28601 39.7 21882 38.7 29743 40.6 4444 35.4 9272 38.2
Age groupa
65–79 7755 33.2 15408 35.0 18367 26.6 19006 26.4 16991 30.1 20329 27.7 4582 36.4 9532 39.3
80–89 11774 50.4 20809 47.2 36020 52.1 34595 48.0 28971 51.3 35119 47.9 6259 49.8 11226 46.3 ≥90 3811 16.3 7853 17.8 14783 21.4 18525 25.7 10562 18.7 17887 24.4 1730 13.8 3512 14.5 Indigenous Status
Aboriginal or Torres Strait Islander
530 2.3 587 1.3 412 0.6 699 1.0 573 1.0 976 1.3 125 1.0 220 0.9
Neither Aboriginal nor Torres Strait Islander
22797 97.7 22240 50.5 68651 99.2 71413 99.0 55950 99.0 72359 98.7 12446 99.0 24050 99.1
Unspecified 13 0.1 21247 48.2 108 0.2 14 < 0.1 1 < 0.1 0 0.0 0 0.0 0 0.0
Country of Birth
Australia 15606 66.9 28046 63.6 49350 71.3 49616 68.8 40409 71.5 50343 68.6 8529 67.8 16461 67.8
Non-English- speaking countries
4588 19.7 9669 21.9 11044 16.0 13330 18.5 8751 15.5 13910 19.0 2403 19.1 4766 19.6
Other English- speaking countries
3047 13.1 5445 12.4 8478 12.3 8960 12.4 7210 12.8 8824 12.0 1580 12.6 2945 12.1
Not stated 99 0.4 914 2.1 299 0.4 220 0.3 154 0.3 258 0.4 59 0.5 98 0.4
Language
English 20646 88.5 36034 81.8 62682 90.6 65514 90.8 51446 91.0 66321 90.4 11179 88.9 21931 90.4
Other languages 2651 11.4 5147 11.7 6406 9.3 6532 9.1 5016 8.9 6945 9.5 1371 10.9 2309 9.5
Not stated 43 0.2 2893 6.6 83 0.1 80 0.1 62 0.1 69 0.1 21 0.2 30 0.1
State
Australian Capital Territory 439 1.9 829 1.9 751 1.1 1,155 1.6 936 1.7 737 1.0 220 1.8 332 1.4
New South Wales 8174 35.0 13890 31.5 24452 35.4 24718 34.3 22172 39.2 28830 39.3 4132 32.9 7636 31.5
Northern Territory 274 1.2 545 1.2 198 0.3 170 0.2 357 0.6 396 0.5 86 0.7 121 0.5
Queensland 4332 18.6 9628 21.8 11938 17.3 13197 18.3 7394 13.1 9332 12.7 2044 16.3 4850 20.0
South Australia 1883 8.1 3631 8.2 6234 9.0 6189 8.6 5335 9.4 7879 10.7 1202 9.6 2050 8.4
Tasmania 538 2.3 998 2.3 1852 2.7 2032 2.8 1939 3.4 2188 3.0 340 2.7 595 2.5
Victoria 5234 22.4 10109 22.9 17855 25.8 18825 26.1 14494 25.6 19945 27.2 3729 29.7 6529 26.9
Western Australia 2466 10.6 4440 10.1 5835 8.4 5840 8.1 3848 6.8 4028 5.5 818 6.5 2157 8.9
a
Fig. 2Incidence of Aged Care Programme Utilisation Rate/1000 people 65 Years Old and Older in Australia, 2008–09 to 2015–16
Table 2Crude and adjusted incidence rate ratio of change in Aged Care Programme Utilisation between 2008-09 and 2015–16, overall and by gender and age groups
Home care Residential care Transition Care
Permanent Respite
Crude IRR (95%CI)
Adjusted IRR
(95%CI)1 Crude IRR(95%CI) Adjusted IRR(95%CI)1 (95%CI)Crude IRR Adjusted IRR(95%CI)1 Crude IRR(95%CI) Adjusted IRR(95%CI)1
Overall 1.49 (1.46–1.51) 1.52 (1.50–1.55) 0.82 (0.81–0.83) 0.84 (0.83–0.85) 1.02 (1.01–1.-03) 1.05 (1.03–1.06) 1.52 (1.49–1.55) 1.57 (1.53–1.60)
Females 65–79
1.50 (1.45–1.55) 1.49 (1.44–1.45) 0.78 (0.76–0.81) 0.78 (0.76–0.81) 0.90 (0.88–0.93) 0.91 (0.88–0.93) 1.59 (1.52–1.67) 1.59 (1.52–1.67)
Females 80–89
1.56 (1.52–1.61) 1.59 (1.52–1.60) 0.86 (0.85–0.88) 0.86 (0.85–0.88) 1.09 (1.07–1.11) 1.09 (1.07–1.11) 1.58 (1.52–1.65) 1.58 (1.52–1.64)
Females ≥90
1.39 (1.32–1.45) 1.39 (1.32–1.45) 0.82 (0.80–0.84) 0.82 (0.80–0.84) 1.12 (1.09–1.15) 1.12 (1.09–1.15) 1.32 (1.24–1.42) 1.32 (1.23–1.41)
Males 65–79
1.56 (1.50–1.63) 1.56 (1.49–1.63) 0.80 (0.78–0.83) 0.80 (0.78–0.83) 0.93 (0.90–0.96) 0.93 (0.91–0.96) 1.59 (1.51–1.68) 1.59 (1.51–1.68)
Males 80–89
1.28 (1.19–1.37) 1.65 (1.59–1.72) 0.87 (0.83–0.89) 0.87 (0.85–0.89) 1.10 (1.07–1.13) 1.10 (1.07–1.13) 1.68 (1.60–1.77) 1.68 (1.60–1.77)
Males ≥90
1.49 (1.46–1.51) 1.28 (1.19–1.37) 0.84 (0.80 = 0.87) 0.84 (0.80–0.87) 1.11 (1.06–1.16) 1.10 (1.06–1.15) 1.38 (1.23–1.54) 1.38 1.23–1.54)
IRRIncidence rate ratio,CIConfidence Intervals
1
over the study period despite significant growth (by 27%) of the general population aged older than 65 years old in Australia. However, the trends of admissions into services changed during this period with a significant de-crease in the uptake of PRAC coinciding with inde-creases in other services, with the highest increase observed in the admission to HCP. A noticeable growth in HCP ad-mission was observed 2014 onwards, which aligns with the introduction of a new Home Care Packages Programme by the Federal government [14].
Over the study period, the incidence rate of admission into PRAC services declined gradually until 2014 and since then a noticeable decline in admissions into PRAC was observed. This is evident in both genders and all age groups. Similar recent declines in institutionalised long-term care services utilisation and occupancy rates have also been reported in other countries, including Germany, Netherlands and United States [15, 16]. The decline in admission rates into PRAC in Australia has coincided with a consequent increase in the utilisation Fig. 3Incidence of Aged Care Programme Utilisation Rate/1000 people 65 Years Old and Older in Australia by Age and Gender, 2008–09
of HCP services. This is likely the result of significant pol-icy changes in the sector placing more emphasis on home and community care services and encouraging the transi-tion to PRAC only when other service optransi-tions are exhausted and shifting targets by the Australian Govern-ment regarding age care operational provision rate for HCP and PRAC in the last few years [8]. Despite popula-tion ageing, the shift observed in this study to aging in place is also occurring in most developed countries [17]. The attractiveness of community living could be attrib-uted to several reasons such as the wish of older people to stay in their own homes and communities and thus main-tain their autonomy, increase in privately funded assisted living (e.g. retirement villages), availability of better health and primary care services that maintain individuals at home (e.g. better chronic disease management, access to flu vaccines, reduced smoking rates) [18,19].
Andres et al. also argued that government policies could directly influence people’s preference of home care over institutional care [15]. A noticeable change in pat-tern of utilisation of home and permanent care was ob-served after the Australian government introduced several reforms such as a web based portal called “My Aged Care,” merging of three community based pro-grammes (Community Aged Care Programme, Extended Aged Care at Home, Extended Aged Care at Home-De-mentia) into a new HCP programme, greater investment in HCP programmes and increasing in target ratios of HCP to PRAC places [8], and launching of the Aged Care Pricing Commission [20]. The short-term effects in the patterns of utilisation could be attributed to these government reforms. Since 2013, Australian government has announced additional reforms to be implemented progressively over 10 years. As observed in this study, the utilisation of aged care services is intrinsically linked to policy change, therefore caution is needed to avoid the realisation of unwanted consequences of new pol-icies, including older frail people who are considered eli-gible not being able to obtain necessary services or having long waits to enter the service due to funding or reduced placement levels.
English speaking, females, 80–89 years old constituted a large segment of our cohort and has been consistent over the years evaluated. Borotkanics et al. [21], and For-der et al. have reported that females aged between 70 and 90 years are more likely to enter PRAC [22]. In-creased longevity is due to better health and primary health care, and so it is not surprising that aged care ser-vices are being used more often by people who have lived to a very advanced age which was identified in the study. Very old individuals are the ones who need sup-portive care services as they are nearing the end of life and this is also at a time of life when spousal death and the death of others who could be their first line of care
[23]. We also found that a lower proportion of people entering PRAC were born in non-English speaking countries (< 20%) and had a preferred language (< 12%) other than English (Culturally And Linguistically Di-verse, CALD), which had been reported by AIHW for the national cohort and studies by Petrov et al. and Jorgensen et al. [4, 11, 24]. When compared to Austra-lian general population (about 21% spoke a language other than English), the proportion of older CALD people using PRAC was low [25]. The study has highlighted the under-representation of older people from ATSI and CALD population groups accessing aged care services. Despite ATSI people accounting for almost 5% of Australians ≥65 years, the difference in utilisation of the aged care services in this study was substantial be-tween ATSI (< 1% for all except for HCP) and non-Indi-genous people (> 97%) and this remained consistent over the study period [21, 26]. LoGiudice et al. have highlighted the importance of developing a culturally ap-propriate care system that preserve ATSI identity, staff-ing, policy, planning and resourcing are necessary to cater the needs of the older ATSI population [27]. HCP utilisation rates was relatively higher over the study period in this demographic, which may indicate that the older ATSI population were more likely to opt to remain for as long as possible at home and in the community rather than accessing residential facilities. To date very few studies have explored the issue of aged care services inequity for the older ATSI population [27–29]. Further research is needed studies to explore the support needs and preferences of the older ATSI population and incorporate this evidence into service innovations to assist in increasing the uptake of aged care services in this population.
because of our inability to account for potential multiple entries into the same service by the same person as our data does not include individual identifiers. While it is un-likely that this would occur in those accessing home care, permanent residential aged care, and transition care, it is possible for the respite care estimates. Finally, the inci-dence rates of service admission were calculated based on the proportion of the Australian population aged 65 years old and older, but not all Australians users of aged care services were included in this evaluation. For example, in-digenous people may access age care services when they are 50 years of older and under certain circumstances younger people with disabilities (50–65 years ATSI are < 0.3% of the total population receiving aged care). How-ever, as the vast majority of aged care recipients are aged 65 years and over and the main focus of this study.
Conclusions
The provision of aged care services in Australia is com-plex and diverse but also dynamic due to the constant introduction of government reforms, and some changes in demographics and the way people use aged care ser-vices. Our findings indicate that although the numbers of people getting aged care services has increased with population growth and aging, the proportion of older people who are needing and getting supportive aged care services has not changed in the decade studied. Further-more, there was a clear shift to home care services from institutionalised care and also there has been an aging trend among the people who are accessing aged care ser-vices with more older people accessing serser-vices than younger people. Having home care services readily avail-able could be a key factor not only in keeping people out of nursing homes but also keeping them well and out of hospital. With the current emphasis on the gov-ernment’s“age in place”policy, understanding the trends in aged care service utilisation is helpful to key stake-holders in informing service planning and the future al-location of funding and resources.
Abbreviations
ABS:Australian Bureau of Statistics; ACAT: Aged Care Assessment Team; AIHW: Australian Institute of Health and Welfare; ATSI: Aboriginal and Torres Strait Islander; CACP : Aged Care Packages; CALD: Culturally and Linguistically Diverse; CI: Confidence intervals; EACH: Extended Aged-Care at Home; EACHD: Extended aged-care at home-dementia; HACC: Home and Community Care; HCP: Home care package(s); IRR: Incidence rate ratios; PRAC: Permanent residential aged care; RAC: Residential aged care; RRC: Respite residential care; TC: Transition care
Acknowledgements
Not applicable.
Authors’contributions
MI conceived the study idea and discussed with all co-authors. JK and MI developed the protocol that was reviewed and edited by other authors. CL, JK and MI performed data analyses. All authors reviewed and interpreted the data. JK wrote the first draft of the paper, which was revised by all authors. All authors read and approved the final manuscript.
Funding
This work was supported by the South Australian Government Premier’s Research and Industry Fund (2017–2021) (RCP 9). The funders had no role in study design, data collection and analysis, decision to publish or preparation of the manuscript.
Availability of data and materials
The data that support the findings of this study are openly available from the Australian Institute of Health and Welfare (AIHW) GEN Aged Care Data (Source:https://www.gen-agedcaredata.gov.au/Resources/Access-data/2017/ August/GEN-Data-People-using-aged-careandhttps://www.gen-agedcaredata. gov.au/Resources/Access-data/2018/June/GEN-data-Admissions-into-aged-care) [11,12] and the Australian Bureau of Statistics (ABS),http://www.abs.gov.au/ ausstats/abs@.nsf/mf/3101.0/[13]
Ethics approval and consent to participate
Publicly available de-identified data were utilised at all stages so review by an Ethics Committee was not required.
Consent for publication
Not applicable.
Competing interests
The authors declare that they have no competing interests.
Author details 1
Healthy Ageing Research Consortium, Registry of Older South Australians, South Australian Health and Medical Research Institute, North Terrace, PO Box: 11060, Adelaide, SA 5001, Australia.2Institute for Choice, University of South Australia, Adelaide, Australia.3College of Nursing and Health Sciences,
Flinders University, Adelaide, Australia.4Helping Hand, Adelaide, Australia.
5Division of Health Sciences, University of South Australia, Adelaide, Australia.
Received: 19 November 2018 Accepted: 11 July 2019
References
1. United Nations Department of Economic and Social Affairs Population Division: World Population Ageing 2015 (ST/ESA/SER.A/390). In., vol. (ST/ ESA/SER.A/390); 2015.
2. Australian Bureau of Statistics. Population Projections, Australia, 2012 (base) to 2101.https://www.abs.gov.au/ausstats/abs@.nsf/Lookup/3222.0main+ features32012%20(base)%20to%202101. Accessed 30 Oct 2018.
3. Commonwealth of Australia Department of Health. 2015–16 Report on the Operation of the Aged Care Act 1997. Canberra: Department of Health; 2016.https://agedcare.health.gov.au/sites/g/files/net1426/f/documents/12_2 016/2015-16_report-on-the-operation-of-the-aged-care-act-1997.pdf. 4. Petrov L, Joyce C, Gucciardo-Masci T. Aging in Australia: country of birth
and language preferences of residents in aged care facilities. Aust Health Rev. 2017;43(1):78-84.
5. Australian Government, Australian Institute of Health and Welfare. Aged care: overview. https://www.aihw.gov.au/reports-data/health-welfare-services/aged-care/overview. Accessed 30 Oct 2018.
6. Harris M, Diminic S, Marshall C, Stockings E, Degenhardt L. Estimating service demand for respite care among informal carers of people with psychological disabilities in Australia. Aust N Z J Public Health. 2015;39(3):284–92. 7. Masters S, Giles L, Halbert J, Crotty M. Development and testing of a
questionnaire to measure older people's experience of the transition care Program in Australia. Australas J Ageing. 2010;29(4):172–8.
8. Commonwealth of Australia Department of Health. 2017–18 Report on the Operation of the Aged Care Act 1997 (ROACA). Canberra: Department of Health; 2016.https://www.health.gov.au/resources/ publications/2017-18-report-on-the-operation-of-the-aged-care-act-1997-roaca. Accessed 30 Oct 2018.
9. Australian Government, Department of Health. Ageing and Aged Care. Aged care reform. Canberra, 2018. https://agedcare.health.gov.au/aged-care-reform. Accessed 30 Oct 2018.
11. Australian Institute of Health and Welfare. GEN data: people using aged care.https://www.gen-agedcaredata.gov.au/Resources/Access-data/2017/ August/GEN-Data-People-using-aged-care. Accessed 30 Oct 2018. 12. Australian Institute of Health and Welfare. GEN data: admissions into aged care.
https://www.gen-agedcaredata.gov.au/Resources/Access-data/2017/August/ GEN-Aged-Care-Data-Admissions-into-Aged-Care. Accessed 30 Oct 2018. 13. Australian Bureau of Statistics. 3101.0- Australian Demographic Statistics,
Dec 2017. Canberra: 2018.https://www.abs.gov.au/ausstats/abs@.nsf/ Lookup/3101.0main+features1Dec+2017. Accessed 30 Oct 2018. 14. Australian Government Department of Health and Ageing. Home care
packages program guidelines. August 2013.https://www.rightathome.com. au/images/pdfs/Home_Care_Packages_Program_Guidelines_-_10_July_2 013.pdf. Accessed 30 Oct 2018.
15. Alders P, Costa-Font J, de Klerk M, Frank R. What is the impact of policy differences on nursing home utilization? The cases of Germany and the Netherlands. Health Policy. 2015;119(6):814–20.
16. Castle NG, Engberg J, Lave J, Fisher A. Factors associated with increasing nursing home closures. Health Serv Res. 2009;44(3):1088–109. 17. U.S. Department of Health and Human Services: Why are nursing home
utlilization rates declining? Available fromhttp://www.nasuad.org/hcbs/ article/why-are-nursing-home-utilization-rates-declining. 2009.
18. Alders P, Deeg DJH, Schut FT. Who will become my co-residents? The role of attractiveness of institutional care in the changing demand for long-term care institutions. Arch Gerontol Geriatr. 2019;81:91–7.
19. de Meijer C, Bakx P, van Doorslaer E, Koopmanschap M. Explaining declining rates of institutional LTC use in the Netherlands: a decomposition approach. Health Econ. 2015;24(Suppl 1):18–31.
20. Australian Goverment Aged Care Pricing Commissioner. Aged care pricing Commissioner information publication scheme entry. Canberrra: Commonwealth of Australia; 2019.http://www.acpc.gov.au/internet/acpc/ publishing.nsf/Content/aged-care-pricing-commissioner-information-publication-scheme-entry. Accessed 30 Oct 2018.
21. Borotkanics R, Rowe C, Georgiou A, Douglas H, Makeham M, Westbrook J. Changes in the profile of Australians in 77 residential aged care facilities across New South Wales and the Australian Capital Territory. Aust Health Rev. 2017;41(6):613–20.
22. Forder P, Byles J, Vo K, Curryer C, Loxton D. Cumulative incidence of admission to permanent residential aged care for Australian women - a competing risk analysis. Aust N Z J Public Health. 2018;42(2):166–71. 23. Imai H, Fushimi K. Factors associated with the use of institutional long-term
care in Japan. Geriatr Gerentol Int. 2012;12(1):72–9.
24. Jorgensen M, Siette J, Georgiou A, Warland A, Westbrook J. Modeling the association between home care service use and entry into residential aged care: a cohort study using routinely collected data. J Am Med Dir Assoc. 2018;19(2):117–121 e113.
25. Australian Bureau of Statisitics. 2071.0 - Census of Population and Housing: Reflecting Australia - Stories from the Census, 2016. Canberra. 2016.https://www.abs.gov.au/ausstats/abs@.nsf/Lookup/by%20Subject/2 071.0~2016~Main%20Features~Snapshot%20of%20Australia,%202016~2. Accessed 30 Oct 2018.
26. Australian Bureau of Statistics. 2071.0 - Census of Population and Housing: Reflecting Australia - Stories from the Census: Aboriginal and Torres Strait Islander Population. Canberra. 2016.https://www.abs.gov.au/ausstats/abs@.nsf/ Lookup/by%20Subject/2071.0~2016~Main%20Features~Aboriginal%20and%2 0Torres%20Strait%20Islander%20Population%20Data%20Summary~10. Accessed 30 Oct 2018.
27. LoGiudice DC, Smith K, Shadforth G, Lindeman M, Carroll E, Atkinson D, Schaper F, Lautenschlager N, Murphy R, Flicker L. Lungurra Ngoora--a pilot model of care for aged and disabled in a remote Aboriginal community--can it work? Rural Remote Health. 2012;12:2078.
28. Davy C, Cass A, Brady J, DeVries J, Fewquandie B, Ingram S, Mentha R, Simon P, Rickards B, Togni S, et al. Facilitating engagement through strong relationships between primary healthcare and Aboriginal and Torres Strait Islander peoples. Aust N Z J Public Health. 2016;40(6):535–41.
29. Bell D, Lindeman MA, Reid JB. The (mis) matching of resources and assessed need in remote Aboriginal community aged care. Australas J Ageing. 2015;34(3):171–6.
Publisher’s Note