DNP Scholarly Projects Student Scholarship
Fall 2018
Using Informatics to Improve Autism Screening in
a Pediatric Primary Care Practice
Jessica Teates
Follow this and additional works at:https://scholars.unh.edu/scholarly_projects
Part of theSocial and Behavioral Sciences Commons
This Clinical Doctorate is brought to you for free and open access by the Student Scholarship at University of New Hampshire Scholars' Repository. It has been accepted for inclusion in DNP Scholarly Projects by an authorized administrator of University of New Hampshire Scholars' Repository. For more information, please [email protected].
Recommended Citation
Teates, Jessica, "Using Informatics to Improve Autism Screening in a Pediatric Primary Care Practice" (2018).DNP Scholarly Projects. 9.
Using Informatics to Improve Autism Screening in a Pediatric Primary Care Practice
Jessica L. Teates
University of New Hampshire
Faculty Mentor: Pamela DiNapoli, PhD, RN, CNL
Practice Mentor: Eleanor Maguire, MSN, APRN
Table of Contents
Abstract ...3
Introduction ...4
Problem Description ...4
Available Knowledge ...6
Rationale ...11
Specific Aims ...13
Methods ...14
Context ...14
Intervention ...15
Study of the Intervention ...21
Measures ...22
Analysis ...23
Ethical Considerations ...24
Results ...25
Evolution over Time ...25
Details of the Process Measures and Outcome ...29
Discussion ...31
Summary ...32
Interpretation ...33
Conclusions ...33
Funding ...34
References ...35
Appendices ...38
Appendix A (IRB Determination Letters) ...38
Abstract
Background: According to the most recent report from the CDC (2018), autism spectrum
disorder (ASD) affects approximately one in 59 children in the United States (U.S.). In 2007, the American Academy of Pediatrics (AAP) issued a strong recommendation for all primary care providers to screen children for autism, using a validated tool, at the 18 and 24-month well-child visits, in order to begin the referral process for more formal testing, and intervention, promptly. Despite the strong stance of the AAP and evidence supporting the importance of early
intervention for children with ASD, not all primary care providers are screening for ASD or developmental delay.
Purpose: To improve the percentage of eligible children, presenting for 18 and 24 month well-child visits in a pediatric primary care office, who are screened for ASD, by integrating the Modified Checklist for Autism in Toddlers (M-CHAT) screening tool into the electronic medical record with tablets. The specific aims were to increase the percentage of children screened and improve the documentation of the screens performed.
Methods: This quality improvement project utilized a before-after quantitative design to support the improvement. Reports were obtained for three months prior to the implementation of the tablets and process change, and again for three months following the implementation. Manual chart reviews were also performed to verify the data from the reports. The definition used for complete screening for this project included 1) presence of the completed screen in the medical record, 2) provider documentation of the result, interpretation, and plan if indicated, and 3) CPT code entry for charge capture completed in the electronic medical record.
Results: The results of the project revealed improvements in overall percentages of eligible children screened for autism at D-H Nashua Pediatrics. The percentage of complete screening increased from 64.7% to 73.9% following the implementation of the project, a change which is statistically significant (t=31.6105, df=16,p=0.05). Each individual element was also tracked and those results showed that 1) the completeness of provider documentation related to the screening increased from 93.6% to 96% (t=41.3321, df=16, p=0.05) and 2) the M-CHAT screen was present in the electronic health record (EHR) 98.9% of the time, which was an increase from 84.6% (t=295.4084, df=16, p=0.05). The charge capture completion rate remained statistically unchanged at 76.5% (t=0.4664, df=16, p=0.05). Additionally, only one screening was noted to be missed altogether, out of 280 eligible children. Prior to the project, there were four missed screenings (out of 156 eligible children) captured by the chart reviews conducted over three months prior to the implementation of the project. Overall, the results show that the project resulted in an increase the percentage of M-CHAT screening, an increase in the presence of source documentation in the electronic health record (EHR), and more complete provider documentation related to the screening.
Using Informatics to Improve Autism Screening in a Pediatric Primary Care Practice
Problem Description
Autism Spectrum Disorder (ASD) is a disorder impacting approximately one in 59
children in the U.S. (CDC, 2018). ASD significantly affects the individual, the individual’s
family, and society, in multiple ways. ASD may negatively affect the quality of life of the child
(de Vries, 2015), the quality of life of the parents (Vasilpoulou, 2016), and place financial burden
on families and society (Buescher, Cidav, & Knapp, 2014; Rotholtz, Kinsman, Lacy, & Charles
(2017).
There is a substantial body of research concluding that early diagnosis and subsequent
intervention has significant positive influence on the child’s developmental outcomes. The
timing of early diagnosis related to ASD has been established as ideally before the third year of
life, during which time synaptic density peaks, and prior to synapse selection for strengthening or
deletion around the start of the third year of life (Zwaigenbaum, 2015). Research also shows that
formal, validated screening instruments are the most effective tools to find a potential
developmental concern, especially given the current lack of a cause and therefore specific
diagnostic test.
In 2007, Johnson and Myers, for the American Academy of Pediatrics (AAP), published a
clinical report in follow-up to an AAP policy statement on developmental surveillance that had
been published one year earlier. The goal of the clinical report, as well as the prior policy
statement, was to assist providers in the early recognition of developmental findings specific to
to start early intervention as soon as possible. The report also urged providers to use formal
screening tools, citing the inaccuracy of provider impressions that are based on clinical
interactions alone. The specific AAP recommendation was to screen all children for ASD using
formal ASD-specific screening tool, at the 18-month well-child visit, to repeat the screening at
the 24-month well-child visit, and to screen as needed if concerns arise. The AAP also advised
pediatricians to be timely in acting upon all positive screens. In 2016, the AAP reaffirmed their
stance on the importance of ASD-specific screening for all children at both the 18 and 24-month
well-child visits, while also agreeing with a statement from the U.S. Preventive Services Task
Force (USPSTF) that more research is needed into the efficacy of universal screening in
detecting ASD and other developmental disorders.
In 2015, Zwaigenbaum, et al. published the panel recommendations garnered from a
working group of international multidisciplinary healthcare providers and researchers with
expertise in ASD. The group met in 2010 with the goal of performing a literature review to gain
consensus on 1) the best practice for developmental screening, and 2) addressing barriers to said
screening. The results of the panel review were 1) the Checklist for Autism in Toddlers (CHAT )
could not be recommended for its low sensitivity, 2) another modification of the CHAT, the
Q-CHAT, needed more validation, 3) the Early Screening for Autistic Traits (ESAT) was
determined to have a low case detection and positive predictive value (PPV) of only 0.25, and
therefore could not be recommended, 4) additional tools such as the FYI and Baby and Infant
Screen for Children with Autism Trait to require more data before a recommendation for use can
be made, and 5) the M-CHAT, the most studied, translated, and validated tool, had a PPV of 0.54
panel also found that the revised versions of the CHAT, the CHAT-R (R for revised) or
CHAT-R/F (R/F for revised with follow-up), improved the overall ASD detection rate of the
M-CHAT and reduced the initial screen-positive rate, making the newer revisions of the tool better
due to a lower rate of initial false-positives.
Despite the strong stance of the AAP and the evidence behind the importance of early
intervention for children with ASD, not all primary care providers are screening for ASD or
developmental delay. According to Campbell, et al. (2017) and Keil, Breunig, Fleischfresser, and
Ofthedal (2014), the percentage of primary care providers in the U.S. screening for ASD using a
formal tool ranges from zero to 99%.
Available Knowledge
A systematic review (SR) was conducted in an attempt to ascertain the actual percentage
of primary care providers in the U.S. who are adhering to the AAP recommendations to screen
all children for ASD twice by 30 months of age. The SR search strategy involved the databases
PubMed, Medline, CINAHL, Cochrane, ProQuest, PsyInfo, and Google. In addition, all
references from full-text articles were reviewed. The search words included: CHAT OR
M-CHAT-R OR M-M-CHAT-R/F OR Modified Checklist for Autism in Toddlers; Autism AND
screening AND disparit*; Autism AND screening AND “cultural groups” OR “ethnic groups”
OR race. The search included all (quantitative) research studies, published and not published,
including randomized controlled trials, descriptive studies, and quasi-controlled studies; grey
literature including theses and presentations. The date range of the search starts the year the AAP
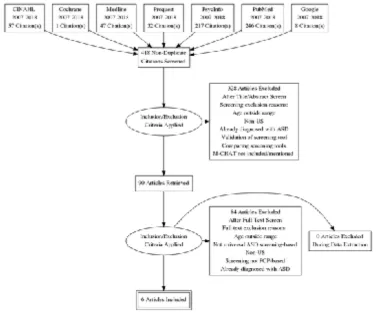
605 articles were found for the initial search, and 418 articles remained after merging duplicates.
Titles and abstracts for the 418 articles were screened independently by two researchers using the
PICO and inclusion and exclusion criteria. Consensus was attained and 90 articles were
chosen for full text review. All 90 full-text articles were reviewed independently by two
researchers for inclusion. Any disagreement between researchers was fully resolved and again
consensus achieved. After consensus, 84 articles were excluded. Figure 1 shows a total of six
studies were included for review. Of the six studies included in the SR, five of the studies were
survey studies, and one was a quasi-experimental before-after QI study.
!
The results of the SR revealed that the overall percentage of children screened at 18
months ranged from 59.8% to 99%, and screening at 24 months ranged from 44% to 99%. The
overall percentage of children screened for ASD using the M-CHAT and for both 18 and 24
months ranged from 38% to 99%. With regards to the utilization of the M-CHAT as the validated
tool, the use of the M-CHAT ranged from 45% to 100% for five studies, with one survey study
not explicitly stating the percentages for the type of screening tool used. The SR supported that
screening for ASD using the M-CHAT was not being done per the AAP recommendations.
A literature review (LR) was also conducted to support the position that there is an
advantage to using electronic screening over a paper modality. To expand the results, the search
was not specific to screening for ASD. The LR search included the databases CINAHL,
Medline, Cochrane, and PubMed. The first search words included “primary care” + electronic +
questionnaire, and yielded 2145 articles. The second included the search terms “developmental
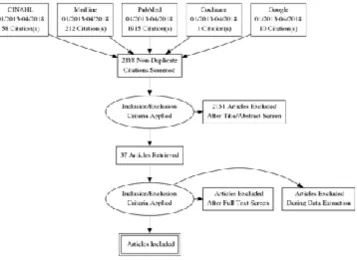
screening” + pediatrics + electronic and yielded 41 results. Of the 2166 non-duplicate abstracts,
figure 2 shows that of the 34 articles retrieved for full text review, nine were included for
!
Figure 2. PRIMSA Diagram
The results of the LR reveal that paper screening may be inefficient, and the manual
aspect of paper screening, scoring, and documenting, is prone to error (Harrington, Bai, &
Perkins, 2013). A study by Brooks, Haynes, Smith, McFadden, and Robins (2016) found a 58.5%
increase in M-CHAT screening by changing from a paper modality to a web-based electronic
version of M-CHAT, as well improvements in documentation and accuracy of referrals. A study
by Campbell, et al. (2017) showed that the accuracy of documentation improved from 54% to
92% following the change from paper M-CHAT modality to electronic delivery. This is similar to
a study by Brooks, Haynes, Smith, McFadden, and Robins (2016) which found a 58.5% increase
in M-CHAT screening using web based electronic version of M-CHAT, as well improvements in
documentation and accuracy of referrals. A study by Aleem, Torrey, Duncan, Hort, and
tablets, also increased screening rates. Carrol, Bauer, Dugan, Anand, Saha, and Downs (2014)
found that adding electronic clinical decision supports into the electronic medical record as
reminders to screen increased screening rates for general developmental delay significantly,
which also speaks to the effectiveness of using technology to improve processes. These studies
help to demonstrate how quality of care may be enhanced by utilizing technology to improve a
process such as screening for ASD in toddlers.
LR results also yielded insight into patient preference for electronic or paper.
Goodyear-Smith, Warren, Bojic, and Chong (2013) surveyed patients regarding lifestyle risk factors and
found that 97% felt a tablet was easy to use for completing questionnaires. Harrington, Bai, and
Perkins (2013) found parents preferred the iPad format of the M-CHAT questionnaire the over
paper version. Barentsz, et al. (2014) looked at the usefulness of electronic questionnaires for
breast cancer patients and found that 1) younger patients and patients with higher education
attainment preferred electronic over paper, and 2) electronic versions improved completeness of
screening for patients who were inpatient (but not outpatient). Harrington, Bai, & Perkins also
found that electronic modality with automatic scoring decreased scoring errors compared with
the manual scoring needed for paper screening. Of note, an important consideration regarding
modality of screening questionnaires is whether they are equally accurate. Belasario, Jamsek,
Huckvale, O’Donoghue, Morrison, and Car (2015) found no significant difference in mean
overall scores between self-administered questionnaires given electronic or paper, as long as
Rationale
Rogers’ theory of diffusion of innovation is used as the theoretical framework
underpinning this DNP project. According to Rogers (1995), the rate of acceptance of an
innovation is influenced by several variables, including “the perceived attributes of the
innovation, the type of the innovation, the communication channels, the nature of the social
systems, and the extent of the change agent’s promotion efforts” (Rogers, p. 207). In his writings
Rogers points out that small, more individual-level innovations are more rapidly implemented
than organizational innovations that involve large groups of people.
Understanding this has been an important scaffolding for the project at Dartmouth
Hitchcock Medical Center (DHMC). As the main hub of the Dartmouth-Hitchcock (D-H)
system, the medical center is a large academic medical center, and the approval of a project at
such a large organization involved many steps and approvals from several departments. The
process for the project approval was started nearly two months before the projected
commencement date, and started with the largest departments and potential organizational
hurdles first. In his theory, Rogers posits that the rate of innovation is influenced by the change
agent’s promotion efforts, and this view has proven valuable when promoting this project in a
large organization with many departments. The change agent, as an early adopter, helps influence
the effort towards the diffusion level. Following the diffusion of the innovation, there may be
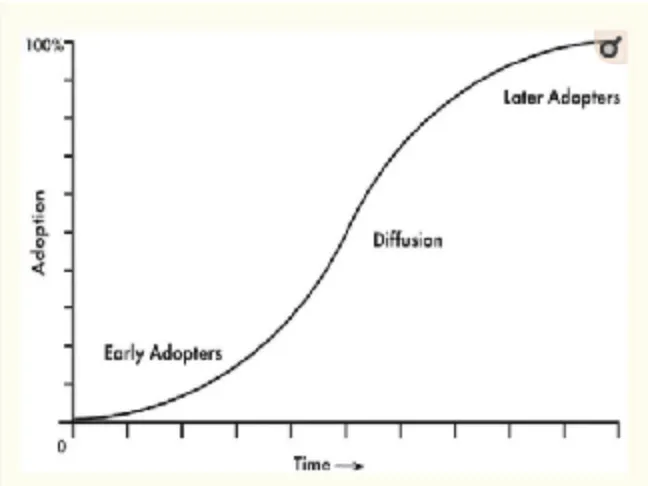
late adopters for whom the innovation had not been easily accepted. Rogers’ diffusion S curve is
!
Figure 3. TheDiffusion S-Curve(Rogers, 1995)
After approval of the project, the “opinion leaders” (Rogers, p. 207) were contacted.
These stakeholders included the site department chair, former department chair, and manager,
and their backing for this project very positively affected the rate of adoption and success.
Dearing (2009) wrote of Rogers’ theory and outlined 10 errors when disseminating an
innovation. According to Dearing, the first error is to assume that evidence matters with potential
adopters. He advises that evidence matters with the initial champion buy-in, but once opinion
leaders are behind the innovation, emphasize other elements such as cost and ease of
implementation. Another error outlined is the introduction of the innovation before it is ready.
Therefore, ensuring thorough preparation and vetting is key. The stages of adoption specific to
Specific Aims
Local Aim : To increase the percentage of children screened for ASD, using the M-CHAT
R/F, at 18 and 24-month well child visits, as evidenced by 1) provider documentation of the
screening, including the result with analysis and plan if indicated, in the provider’s well-child
exam note, 2) the presence of the source documentation (parent-completed M-CHAT
questionnaire) in the EHR, and 3) the entry of CPT code 96110 into the EHR for charge capture,
from 64.7% to 100% within three months of implementation.
Table 1.
Five stages of the adoption process
Stage Definition
Knowledge
Meetings with site stakeholders provided additional education on the M-CHAT and the revised version with follow up. Education was provided to all site members involved regarding the new process, with at-elbow support at implementation and as needed for the duration of the project. Data was collected and shared with the stakeholders throughout the project, and at the conclusion.
Persuasion
All questions were fielded, and data shared to demonstrate the
improvement the new process was expected to bring. Site champion(s) worked to increase buy-in and maintain momentum.
Decision Once the process was fully vetted, approved by the stakeholders, and the
timeline agreed upon, the date for go-live was set.
Implementati on
The implementation phase started with full-time, at-elbow support within the department for the first two weeks, when the process was at its inception. Assessment throughout that time revealed an increase in the comfort level with the process by the team. Once each provider/nurse had completed at least one successful screen without questions or glitches, the at-elbow support was decreased to weekly check-in and as needed support, either in person or via phone or email.
Confirmation
Global Aim: To develop an effective, stable process that other pediatric departments may
adopt to increase the percent of children screened for ASD in their respective organization, as
well as to improve the completeness of the documentation of the screen.
Methods
Context
D-H Nashua is a community group practice in the D-H system. D-H is a non-profit,
research and academic medical center in the upper valley of New Hampshire, serving northern
New England. D-H provides more than 1,000 primary and specialists, is one of 45
comprehensive cancer centers in the country, has a dedicated children’s hospital, 24 community
ambulatory centers (including Nashua), and is a level 1 trauma center with an advanced response
team able to provide air and ground transport throughout northern NE. DHMC is a 396-bed,
level 1 trauma center and tertiary care teaching hospital.
D-H Nashua provides primary, specialty, and urgent care, as well as ancillary services
such as laboratory and radiology, to the approximately 87,000 residents of Nashua, NH (US
Census, 2016), as well as the surrounding towns. The pediatric primary care department at D-H
Nashua employs 11 primary care providers, including seven pediatricians, three nurse
practitioners, and one physician assistant, as well as more than 20 licensed practical nurses
(LPNs), and several medically-trained administrative professionals. The team provides primary
care for approximately 10,000 children, and is a National Committee for Quality Assurance
The physical layout of the department is designed for collaboration. There are three
central pods where the provider and LPN sit side-by-side during the time patient appointments
are held. There is an office close to the central pod where two to three triage registered nurses
(RNs) manage phone calls. The reception area is staffed by at least two medical receptionists,
and there are two to three other medical secretaries at designated check-out desks.
The pediatrics department flows, without partition, into the Nashua Family Practice
department, then to Nashua Internal Medicine. Other areas comprising the second floor of the
six-year old building include the call center, which answers all primary care calls, and
administrative offices for the scheduling coordinator, supervisors, and manager.
Interventions
This process improvement project used before-after quantitative design. Aggregate data
was obtained through EHR report capabilities and verified through manual chart reviews, with
results reported as percentages before and after the implementation of the project.
The pre-implementation phase of the project included obtaining organizational approval
of a student project, re-establishment of employee status as required for approval, D-H Internal
Review Board (IRB) approval of a QI project, securing of a clinical and faculty mentor,
establishing D-H Information Systems (IS) collaboration regarding equipment and computer
programming build needs, and approval from the implementation site.
The project site approval was first obtained from the department chair and the manager,
and shortly thereafter a synopsis of the project was presented at a provider meeting. The meeting
Of note, it came to light at the provider meeting that the department had been using the older
version of the M-CHAT, and had not moved to the revised version that had been developed in
2013. During the meeting, many of the questions from the providers were related to questions
that they had found confusing, and it was shared that those confusing questions were actually
deleted from the revised version. Education was provided regarding the follow-up process for
new version as well, and the providers were assured that the new process would include the new,
revised M-CHAT R/F.
Once departmental buy-in was established, close collaboration was begun with the D-H
IS department to build programming rules into the EHR to automatically trigger the
questionnaire to a queue once an appointment is made within the designated parameters.
Specifically, the screen would trigger once an appointment for a well-child visit under CPT
99382 or 99392, ICD-10 Z00.121 or Z00.129, was made for a child between the ages of 16 and
26 months. The M-CHAT R/F is validated for use between the ages of 16 and 30 months, and
the ages for screening for this project were chosen catch any child that presented for an 18 or 24
month well-child visit a month or so early or late. Additionally, a provider, nurse, or staff
member could add on a screen at any time outside of those age parameters, or well child visit
codes.
A virtual visit with the principal in charge of the electronic M-CHAT implementation at
the Children’s Hospital of Philadelphia (CHOP) had taken place prior to starting the project.
CHOP had moved from paper modality to tablets a few years previously as part of a government
parameters and needs was created, and the team in charge of informatics projects at D-H was
contacted. Once in communication with the build team lead, the build was not as difficult as
anticipated, since another office at D-H was using a similar tablet program to screen in primary
care, so the analyst was able to use some of that programming already in place.
Once the EHR build was set and tested with the new tablets and a test patient, the
pre-implementation phase continued with in-person departmental and stakeholder education, and
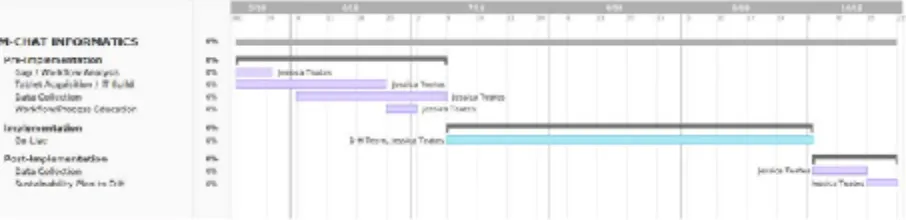
continued with meetings with stakeholders to determine readiness, until the go-live date arrived.
The GANTT chart in figure 4 illustrates the project schedule.
Figure 4. GANTT chart
On-site at-elbow support and guidance was in place for the first two weeks of
implementation, and support remained available via phone, email, or in person thereafter.
During the first week, there were no technical glitches, and only intermittent questions from
providers and nurses were fielded. Specific deliverables for the first week included 1) assisting
with adding a smart phrase to provider’s 18 and 24-month well-child visit templates, which
would pull the M-CHAT score into the note with a generic plan which could be tailored if
screen was queued, in process, or completed. In addition, since the current application was
unable to highlight or bold the “incorrect” responses in the screen, providers had voiced that it
was difficult for them to quickly spot the questions to follow up on. In response, small “cheat
sheets” were created for providers who were interested to assist with this. The “cheat sheets”
were a small reminder that all answers should be “yes” except for 2, 5, and 12, which were
reversed and a “no” is the expected answer. Keeping that in mind, a quick scan of the responses
should show all responses “yes” except “no” to 2, 5, and 12. Any “yes” or “no” answer outside
those would need to be followed up on. Very few of the providers actually knew the screen in its
entirety, and none appeared to be aware of which questions were expected to be “yes” or “no”.
When the process was on paper, the nurses would score the screen and use a yellow highlighter
to mark the “wrong” answers on the paper screen, so providers did not actually have to know the
scoring or details beyond looking at those highlighted questions. Some of the providers thought
scanning the questions for “yes” or “no” in the wrong place was too much, but consensus was
that given the limitation on highlighting the answers in the EHR, the process put into place to
scan the results would be the best way to determine which to follow up on at this time.
Throughout the 17 weeks post-implementation, the providers were able to determine the
incorrect answers to follow up on, as evidenced by chart review, and no further complaints were
fielded.
The only real challenge arose the first day of implementation, and was raised by the front
desk secretary. Apparently, the secretary had made the assumption that the department-specific
paper form, which was developed by the department and not meant to be a part of the medical
discussion had been solely about the M-CHAT screening on the tablet. The receptionist
verbalized that she was certain that parents would be upset at having to fill out forms on both the
tablet and paper, and demonstrated visible frustration. She was told by the chair that if a parent
is upset at the prospect of completing both paper and tablet forms, she may offer just the tablet
option. The team member was carefully supported, while also advised that she may be
projecting her views onto parents, and that it is important to keep an open mind and remain
objective. Trying to lighten the moment while respecting her view was difficult but important.
Presentation is very important, and if the person handing out the tablet (and clipboard) shows
that they are not on board with the process, the parent’s perspective may be changed. After some
discussion, the receptionist reluctantly agreed to proceed. Rounds were performed with the
receptionist that week and beyond, and the receptionist reported that parents were not refusing
filling out both as she had expected.
The charge capture process received close monitoring throughout the implementation,
since there was not a specific change established from before the tablets were introduced.
Unfortunately, the D-H IS team did not yet have the time to dedicate to automating the charge
capture to drop once the screen was uploaded into the EHR via the tablet interface, so the process
would remain a manual one for the time being. Knowing that the pre-implementation charge
capture completion rates were poor, it was decided to work on reminders and engagement in the
process as a way to improve the charge capture completions until it could be automated by the
After the first two weeks of at-elbow support, email communication was consistently
rendered on a weekly basis with the chair, department manager, and the clinical and
administrative supervisors, sharing data retrieved from the chart reviews and overall checking in.
Data shared included the total number of eligible children screened, and the aggregate and
percentages for complete documentation, charge capture, and any missed screens. A plan was
formed with the chair for her to follow up in person on any missed charge captures and missing
provider notes, and therefore provider initials, appointment dates/times, and specifics on what
was missing was included. Run charts were created and maintained to track progress and
determine if changes were needed. At the mid-point of the implementation phase, at week 6, a
simple before-after bar graph was shared with the chair and department to visualize the
improvement made thus far. The chart reviews allowed for formative feedback to providers
regarding missing documentation and nurses for missing charge capture.
The chart reviews clearly showed that there was one provider who presented as a “special
cause variable”. This provider was well known as one who does not follow the rest of the
department, and therefore it was not surprising that he had missed documentation while others
had not. Unfortunately, he did not use a template for his notes, and declined to have templates
created for him. The department chair personally reached out to him with feedback when it was
noted he missed documentation. The chart reviews and run charts show that his notes have
Study of the Interventions
The run chart was chosen as a tool to 1) track the process over time, 2) show whether a
change in the process is needed, and 3) indicate if any change made was successful. According
to Ramsey (2015), run charts may provide time-specific information on whether the process
distribution is stable, as well as if there is potential special cause variation in the process. The run
charts created for each of the data measured were updated and assessed weekly. Changes made
were marked and subsequent data reviewed for potential runs. Runs below the median were
evident around the mid-point of the project, and a short run above the median following a change
in process.
A simple before-after bar graph was made at the mid-point of the project as a visual for
the department to show improvement at that point. The bar graph cannot, however, show
improvement over time so has limited utility for a process improvement project. It was helpful
to the department, however, as a quick and easy visual to show positive results for their efforts.
Finally, a control chart was created in an effort to detect special cause variation. Since the
data is not sub-grouped, an individual control chart was chosen. An excel template created by
New York University (NYU) was utilized, using +/- 3 standard deviations from the mean as the
control limits. It should be noted, however, that the data used for the control chart consisted of
only 17 points (weeks), not the recommended minimum of 20 (Ramsey, 2015), but this number
Measures
In order to measure the outcomes of this DNP Project, a data abstraction tool was adapted
from Agency for Healthcare Research and Quality (AHRQ) templates. According to Vassar and
Holzman (2013), the failure to use standardized data abstraction form, and the failure to create a
procedure for data abstraction are two common errors committed when performing a
retrospective chart review. The data abstraction tool shown in Figure 5 was completed for each
chart reviewed, and the aggregate results compared with the numbers obtained from the reporting
capability in the EHR.
Figure 5. Data abstraction tool
The reports retrieved from the EHR included the following search parameters: 1) dates of
service January 1, 2018 through March 31, 2018 2) all D-H Nashua pediatrics providers, 3) all
children between 16 and 26 months of age, presenting for 4) a well-child visit (CPT 99382 or
99392, ICD-10 Z00.121 or Z00.129), and 5) presence of CPT code 96110 as yes/no. The date of
abstraction was for the three months preceding the implementation, and for four months
The data retrieved from manual chart reviews included verification that 1) the visit was a
well-child visit (ICD-10 code Z00.121 or Z00.129), 2) the child had not already received two
M-CHAT screens, and 3) the screen was actually performed.
Each eligible child’s medical record was also reviewed for “completeness” of
documentation, including 1) the presence, or absence, of the M-CHAT (scanned into the chart for
pre-project chart reviews), and 2) the presence, or absence, of provider documentation, including
2a) the result of the M-CHAT, and 2b) the plan regarding the result of the M-CHAT. The data
obtained from the reporting capability in the EHR was compared against the data obtained
through manual chart review for quality control.
Analysis
Quantitative data was obtained by chart reviews and EHR reporting and tracked as
aggregate data. The data was separated into the categories being tracked, and kept as raw data as
well as converted into a mean, expressed as a percentage specific to the element tracked.
Qualitative data was acquired from departmental meetings and rounding, as well as weekly (and
as needed) communication with the departmental chair, who kept a very close pulse on the
process. The chair’s feedback was verified against the student’s feedback to ensure responses
correlated, in case some providers and staff might not provide negative feedback to the project
lead.
A run chart was created and updated weekly from the data retrieved. The run chart is
utilized as a visual aid to track progress and how the tracked data change over time. A review of
midpoint of the project, which necessitated an intervention. Following the midpoint change, thee
run chart then showed that the intervention, or change in process, that had been put into place
was successful. Run charts may assist in determining whether a process is stable, and if special
cause variation is influencing the process. For this project, a control chart was also created to
better show whether there is special cause variation or just common cause. The control charts
were created towards the end of the 17 weeks of data collection, when the process was thought to
be stable. An individuals chart was chosen since there was no subgrouping of data needed.
Control limits were set as three times the standard deviation, and upper specification limit was
set at the goal of 100%, with lower specification limit set at the baseline data mean retrieved
from the pre-implementation chart reviews.
Ethical Considerations
The D-H Internal Review Board (IRB) determined that this is a non-research, QI project.
UNH IRB was not required. (Appendix A)
All participants were protected by the Health Insurance Portability and Accountability
Act of 1996 (HIPAA) which protects the privacy of patients’ health information (Modifications
to the HIPAA Privacy, Security, Enforcement, and Breach Notification Rules, 2013).
Additionally, the DNP student and team who conducted this project followed the Standards of
Care for practice in a primary care office. All information that has and will be collected as part of
evaluating the impact of this project will be aggregated data from the project participants and
will not include any potential patient identifiers. The risk to patients participating in this project
of participants and their identifying numbers were kept on an encrypted, password protected
laptop belonging to the DNP student. Only the DNP student has the laptop password.
Results
Evolution Over Time With Modifications
The run charts for each element, and for all three elements combined, were analyzed
weekly. Beginning around week 10 a distinct downward in the charge capture element began
showing (chart 3), which was also noted in the combined run chart, as shown in chart 4. At that
time, there was a run of three to four data points below the median, indicating a change in
process needed. A slight change in process specific to the charge capture process was put in
place around week 13, and a positive run resulted over the following weeks, indicating the
process change was successful (chart 3). The run chart for the presence of the screen in the EHR,
as shown in chart 1, reveals only one data point below 100%, which occurred the week of the
EHR upgrade, when the first iPad would not work properly and the screen was completed on
paper and not scanned. The run chart for provider documentation, as shown in chart 2, indicates
Chart 1. Run chart for presence of screen in the EHR
Chart 3. Run chart for charge capture complete
Variation in the process was further investigated with control charts. The control charts
for each element, as well as all elements combined, as shown in charts 5, 6, and 7, showed that
100% of the points fell between the control limits, demonstrating an in-control process for each
of the elements charted. Raw data for each control chart may be found in Appendix B.
Chart 5. Control chart for provider documentation complete
Chart 7. Control chart for all elements complete
Details of the Process Measures and Outcome
As a result of this process improvement, the percentage of screening all eligible children
presenting to D-H Nashua Pediatrics for well-child visits at 18 and 24 months for ASD has
increased. The formal definition of complete screening for this project, which includes the
presence of 1) provider documentation of the screen, results, and plan, 2) the screen in the EHR,
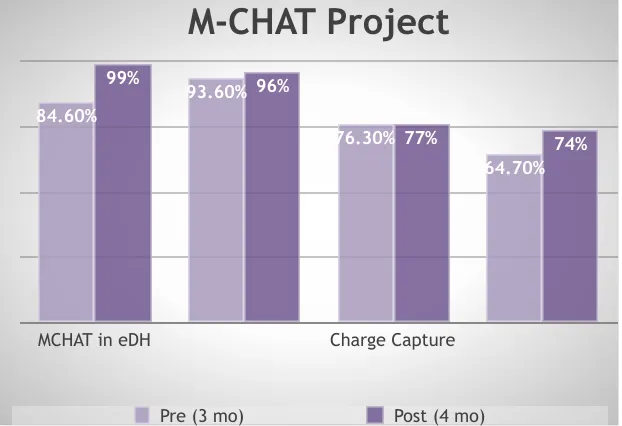
and 3) charge capture completed, increased from 64.7% to 73.9%, as shown in Figure 6,
following implementation of the project. T-testing shows this is statistically significant
(t=31.6105, df=16, p=0.05). A “looser” definition of screening, considering the presence of either
the completed screen in the EHR and/or provider documentation of the screening, was also
looked at and that result rose from 97.4% to 99.6%, which is also statistically significant using a
Figure 6. Before-after bar graph
Elements 1, 2, and 3 were also charted individually, to track progress of each component,
given the intervention needed to add a change to each element differed. For example, if provider
documentation showed a downward trend, or a negative run on the run chart, the intervention
would be focused on providers. Should the charge capture show a downward trend, the focus of
the intervention would be mostly on nursing, and not include providers. Lastly, should the
presence of the screen show a concern, the follow up would be largely with front desk staff or the
IS team.
The results of the pre (n=156) and post (n=280) chart reviews illustrated in Figure 6
show:
• Provider documentation increased from 93.6% to 96%
• Presence of the screen in the EHR increased from 84.6% to 98.9%
M-CHAT Project
MCHAT in eDH Charge Capture
74% 77%
96% 99%
64.70% 76.30%
93.60% 84.60%
• Charge capture completion remained unchanged at 76.5% (prior 76.3%)
There was only one child of the 280 reviewed in the 17 weeks post-implementation for
whom the screen was not completed at all. This was evidenced by none of the 3 elements present
in the chart review. Chart review of the three month span prior to the project implementation
revealed that four children missed screening out of 156.
Discussion
Overall the results were very positive. The charge capture result is disappointing, but not
altogether unexpected. Since the IS team could not automate that process, it remained a manual
one performed by very busy nurses for whom rooming and immunizations took up the majority
of their time. At the inception of this project there was an initial concern that the charge capture
rate may be negatively affected by removing the paper screen, which might have been serving as
a reminder for charge capture. Focusing on reminders and visual cues in the schedule worked for
the first few weeks of the project, however the department was experiencing staffing issues, and
chart reviews showed that the majority of missed charge captures were actually coming from
nurses who were floating to pediatrics from other offices, per diem nurses, or new nurses. Given
the constant staffing changes and flux that did not have an expected end date, the unknown date
of the automation of charge capture, and the results of the run chart, a visual cue in the form of a
colored mark on the paperwork the nurses receive upon rooming was implemented (with positive
results shown on the run chart). This addition to the process was effective, as evidenced by a run
The project had two unexpected benefits. The first benefit was that the department
moved to the updated version of the M-CHAT, the M-CHAT-R/F. The validation of the revised
version showed a reduction in the initial false-positive rate, from 9.15% to 7.17%, while
maintaining statistically unchanged positive predictive value (PPV), and increasing the detection
of ASD from 45 out of 10000 to 67 of 1000 screened (χ2 [1, n = 35 060] = 8.63; P = .003),
compared with the previous version of the M-CHAT (Robins, et al., 2014). The second benefit
was that since the new tablet-based screening process has been deemed a success by the
department, the process is now being used as a scaffold to start screening for teenage depression
and substance abuse with another validated and AAP-endorsed tool. The department may also
add additional recommended screens and questionnaires to the current process, further improving
the quality of care.
Summary
This project was able to demonstrate that even a relatively successful process may be
improved upon by using scientific methodology and informatics. While the goal of screening
100% of eligible children for ASD using the M-CHAT R/F was not attained, there was a
statistically significant increase in the percentage of children screened of 9.2% (64.7% to
73.9%). The data show that the quality as measured by the completeness of documentation also
increased, with provider documentation of the screen and plan increasing by 2.4%. The presence
of the actual parent-completed questionnaire in the EHR increasing by 14.3%, which was
A particular strength of the project was the minimal cost involved, since the equipment
and programming time was able to be provided in the operational budget. In addition, since the
iPads are already in use, adding other screens to the iPad using the same process as the M-CHAT
will not cost anything additional (with the exception of time to build the parameters in the EHR).
Another strength of the project, as previously outlined, is that the project will act as a scaffold for
other screening questionnaires that the department plans to introduce, so it serves as a process
upon which other quality improvements will be added.
Interpretation
The results of this project were similar to the results of a project by Brooks, Haynes,
Smith, McFadden, and Robins (2016), which showed that ASD screening results were improved
by moving from a paper to electronic screening modality. By improving screening rates and
reducing potential missed screens, more children with potential ASD may be found and referred
for formal testing earlier. Early identification and intervention has been shown to improve
outcomes for children with autism, including an improved quality of life of the child and family,
and reduced economic burden to the family and society.
Conclusions
Despite the AAP’s strong recommendation for all children to be screened for ASD using a
validated tool, at 18 and 24-month well-child visits, it is not being done consistently. The vast
majority of providers, such as the providers at D-H Nashua Pediatrics, have the best intention to
screen 100% of children, but the current processes that are in place to screen children at most
by using process improvement methodologies, statistics, inter-professional collaboration,
leadership ability, and nursing informatics application, the variables and potential errors may be
removed from an ineffective and inefficient process to improve both screening rates and the
completion of the provider documentation of the screening. Moving the screening for ASD,
using the M-CHAT, from paper to electronic modality using a tablet has helped to reduce human
and process variables that negatively affect reaching the goal of screening all children for ASD.
The process also streamlines the workflows in the office, removing the extra time necessary to
manually score the screen, enter the result, and scan the paper into the EHR. The additional
screenings may also increase revenue for the department by increasing the number of screens
performed that may be submitted to insurance for payment. Most importantly, this automated
process has demonstrated an effective reduction in missed screens, and therefore a reduction in
subsequent delays in treatment should the child who missed the screening have ASD or a delay
that needed prompt intervention
Funding
There was no funding for this project. All non-student time and equipment was provided
References
Aleem S., Torrey W., Duncan M., Hort S, & Mecchella J. (2015). Depression screening
optimization in an academic rural setting. International Journal of Healthcare Quality
Assurance, 28 (7). doi: 10.1108/IJHCQA-01-2015-0012.
Barentsz, M., Wessels, H., van Diest, P., Pijnappel, R., Haaring, C., van der Pol,
C...Verkooijen, H. (2014). Tablet, web-based, or paper questionnaires for measuring
anxiety in patients suspected of breast cancer: Patient preferences and quality of collected
data. Journal of Medical Internet Research. Doi: 10.2196/jmir.3578
Boland, A., Cherry, M., & Dickson, R. (2014). Doing a Systematic Review: A Student’s
Guide. London: Sage
Brooks, B., Haynes, K., Smith, J., McFadden, T., & Robins, D. (2016). Implementation
of web-based autism screening in an urban clinic. Clinical Pediatrics, 55(10). Doi:
10.1177/0009922815616887
Buescher, A., Cidav, Z., Knapp, M., & Mandell, D. (2014). Costs of autism spectrum
disorders in the united kingdom and the united states. JAMA Pediatrics.
doi:10.1001/jamapediatrics.2014.210
Campbell, K., Carpenter, K., Espinosa, S., Hashemi, J., Qiu, Q., Tepper,
M.,…..Calderbank, R. (2017). Use of a digital modified checklist for autism in toddlers –
revised with follow-up to improve quality of screening for autism. The Journal of
Pediatrics, 183. https://doi.org/10.1016/j.jpeds.2017.01.021.
CDC. (2018). Autism prevalence slightly higher in CDC’s ADDM Network. Retrieved
from: https://www.cdc.gov/media/releases/2018/p0426-autism-prevalence.html
Dearing, J. (2009). Applying diffusion of innovation theory to intervention development.
de Vries, M. & Geurts, H. (2015). Influence of autism traits and executive functioning on
quality of life in children with an autism spectrum disorder.
Journal of Autism and Developmental Disorders, 45 (9). Retrieved from:
https://link-springer-com.libproxy.unh.edu/article/10.1007/s10803-015-2438-1
DHHS. (2013). Modifications to the HIPAA Privacy, Security, Enforcement, and
Breach Notification Rules Under the Health Information Technology for Economic and
Clinical Health Act and the Genetic Information Nondiscrimination Act; Other
Modifications to the HIPAA Rules. Retrieved from:
https://www.federalregister.gov/documents/2013/01/25/2013-01073/modifications-to-
the-hipaa-privacy-security-enforcement-and-breach-notification-rules-under-the
Goodyear-Smith, F., Warren, J., Bojic, M., & Chong, A. (2013). eCHAT for lifestyle and
mental health screening in primary care. Annals of Family Medicine, 11 (5). doi:
10.1370/afm.1512
Harrington, J., Bai, R., & Perkins, A. (2013). Screening children for autism at an urban
clinical using an electronic M-CHAT. Journal of Clinical Pediatrics, 52(1). Doi:
10.1177/00099228812463957
Johnson, C.P., & Myers, S. (2007). Identification and evaluation of children with autism
spectrum disorders. Pediatrics, 120 (5). Retrieved from:
http://pediatrics.aappublications.org/content/120/5/1183
Keil, A., Breunig, C., Fleischfresser, S., & Oftedahl, E. (2014). Promoting routine use of
developmental and autism-specific screening tools by pediatric primary care clinicians.
WMJ, 113 (6). Retrieved from:
https://www.wisconsinmedicalsociety.org/_WMS/publications/wmj/pdf/113/6/227.pdf
Economic burden of childhood autism spectrum disorders. Pediatrics, 133 (3). Retrieved
from:http://pediatrics.aappublications.org.libproxy.unh.edu/content/133/3/e520.short
Ramsey, P. (2015). Math 737/837 Six Sigma Descriptive Statistics: Continuous Data course
notes. Retrieved from: UNH MATH 837.2BB: Stat Methods for QI and
Design, Canvas LMA.
Robins, D., Casagrande, K., Barton, M., Chen, C., Dumont-Mathieu, T., & Fein, D. (2014).
Validation of the modified checklist for autism in toddlers, revised with follow-up.
Pediatrics, 133(1). Retrieved from:
http://pediatrics.aappublications.org/content/133/1/37.comments
Rogers, E. (1995). Diffusion of Innovations. New York, NY: The Free Press.
Rotholz, D., Kinsman, A., Lacy, K., & Charles, J. (2017). Improving early identification
and intervention for children at risk for autism spectrum disorder. Pediatrics, 139 (2).
Retrieved from:
http://pediatrics.aappublications.org.libproxy.unh.edu/content/139/2/e20161061
Vasilopoulou, E., & Nisbet, J. (2016). The quality of life of patents of children with
autism spectrum disorder: A systematic review. Research in Autism Spectrum Disorders,
23. https://doi.org/10.1016/j.rasd.2015.11.008
Vasser. M. & Holzman, M. (2013). The retrospective chart review: Important
methodological considerations. Journal of Education Evaluation in Healthcare.
doi: 10.3352/jeehp.2013.10.12
Zwaigenbaum, L., Bauman, M., Choueiri, R., Fein, D., Kasari, C., Pierce,
K...Wetherby, A. (2015). Pediatrics, 136 (supplement 1). Retrieved from:
http://pediatrics.aappublications.org.libproxy.unh.edu/content/pediatrics/136/Supplement