University of Pennsylvania
ScholarlyCommons
Publicly Accessible Penn Dissertations
1-1-2015
Regulation of Tissue-Specific Expression in the C.
Elegans Embryo
Joshua Tom Burdick
University of Pennsylvania, [email protected]
Follow this and additional works at:http://repository.upenn.edu/edissertations Part of theBioinformatics Commons, and theDevelopmental Biology Commons
Recommended Citation
Burdick, Joshua Tom, "Regulation of Tissue-Specific Expression in the C. Elegans Embryo" (2015).Publicly Accessible Penn
Dissertations. 1629.
Regulation of Tissue-Specific Expression in the C. Elegans Embryo
Abstract
Development proceeds through many stages, and requires genes to function at particular places and times. Knowing when and where a gene is expressed can predict its function. Furthermore, tissue-specific gene expression is regulated by many factors, whose expression patterns often overlap. Understanding this
regulation would be helped by finding examples of regulatory targets of these factors, throughout the genome. The nematode C. elegans provides a model of how parts combine to form an organism. It develops into 558 cells during embryogenesis via an invariant lineage (pattern of divisions). Fluorescent markers are available for many well-defined groups of cells. Therefore, we asked how well we could “deconvolute” the expression genome-wide in each individual cell, based on expression measurements in overlapping sets of cells. Using simulated data, we compared the performance of several different methods for solving this problem. We found that we could estimate the possible range of expression throughout the embryo, using far fewer measurements than there are cells. Based on the performance simulations, we measured expression in eighteen populations of cells, flow-sorted by fluorescent markers expressed in the C. elegans embryo. Applying our deconvolution methods allowed us to estimate every gene’s expression in every cell, although the accuracy of these
predictions with our current sample size are not yet high enough to make them broadly useful. We clustered this dataset, and found that many genes known to be expressed in particular tissues cluster together.
Comparison with existing annotation suggests that over a hundred of these clusters of genes are expressed in a tissue-specific manner. RNA-FISH confirms some of these expression predictions. Motifs corresponding to known C. elegans transcription factors were enriched upstream of the genes in many of these clusters. By combining motif enrichment with coexpression, we obtain many novel predictions about gene regulation. We have validated several of these predictions using RT-PCR in a mutant background. Our data and analysis provides a resource for improving our knowledge of tissue-specific expression and its regulation throughout C. elegans development. Furthermore, our results suggest a framework for inferring changes in gene expression and cell type composition in complex tissues.
Degree Type Dissertation
Degree Name
Doctor of Philosophy (PhD)
Graduate Group
Genomics & Computational Biology
First Advisor John I. Murray
Keywords
Subject Categories
REGULATION OF TISSUE-SPECIFIC EXPRESSION
IN THE C. ELEGANS EMBRYO
Joshua Burdick
A DISSERTATION
in
Genomics and Computational Biology
Presented to the Faculties of the University of Pennsylvania
in
Partial Fulfillment of the Requirements for the
Degree of Doctor of Philosophy
2015
Supervisor of Dissertation
_______________________________
John Isaac Murray, PhD, Assistant Professor, Genetics
Graduate Group Chairperson
_______________________________
Li-San Wang, PhD, Associate Professor, Pathology and Laboratory Medicine
Dissertation Committee
Junhyong Kim, PhD, Professor, Biology
Zhirong Bao, PhD, Biology, Assistant Member, Memorial Sloan-Kettering Institute
Shane Jensen, PhD, Associate Professor, Department of Statistics
REGULATION OF TISSUE-SPECIFIC EXPRESSION IN THE C. ELEGANS
EMBRYO
COPYRIGHT 2015
Joshua Tom Burdick
This work is licensed under the Creative Commons Attribution-NonCommercial-ShareAlike 3.0 License
To view a copy of this license, visit
ACKNOWLEDGMENTS
First, I would like to thank my advisor, John Isaac Murray, for guiding me through
this research. This included allowing me to try speculative mathematical approaches,
suggesting more practical strategies, and generally keeping me on track. My committee,
Arjun Raj, Junhyong Kim, Shane Jensen, and Zhirong Bao, also shaped this project.
This work relied heavily on the experimental skills of the entire Murray lab. In
particular, Travis Walton did the FACS sorting, and Elicia Preston did the RNA-FISH
experiments, in collaboration with the Raj lab. Together with others in the Murray lab
(including Julia Richards), they generated the lineaging expression data. Members of the
lab also provided much helpful advice. In particular, Amanda Zacharias had many
suggestions, and also helped record everyone else's suggestions.
Financial support was provided by the NIH, the Genetics department, and the
Genomics and Computational Biology program. Many people in GCB, notably Maja
Bucan, and coordinaters Hannah Chervitz and Maureen Kirsch, kept things running
smoothly. Thanks to many other teachers (in GCB and elsewhere) for the opportunity to
learn.
The Penn worm meeting (including members of the Khurana, Raizen, Sundaram,
and Kalb labs) provided a fascinating forum about practical aspects of studying the
worm. Thanks also are due to the other GCB students for help studying, insightful talk,
and encouragement. Also thanks to my music and dancing friends, for providing variety.
ABSTRACT
REGULATION OF TISSUE-SPECIFIC EXPRESSION
IN THE C. ELEGANS EMBRYO
Joshua Burdick
John Isaac Murray
Development proceeds through many stages, and requires genes to function at particular
places and times. Knowing when and where a gene is expressed can predict its function.
Furthermore, tissue-specific gene expression is regulated by many factors, whose
expression patterns often overlap. Understanding this regulation would be helped by
finding examples of regulatory targets of these factors, throughout the genome. The
nematode C. elegans provides a model of how parts combine to form an organism. It
develops into 558 cells during embryogenesis via an invariant lineage (pattern of
divisions). Fluorescent markers are available for many well-defined groups of cells.
Therefore, we asked how well we could “deconvolute” the expression genome-wide in
each individual cell, based on expression measurements in overlapping sets of cells.
Using simulated data, we compared the performance of several different methods for
solving this problem. We found that we could estimate the possible range of expression
throughout the embryo, using far fewer measurements than there are cells. Based on the
performance simulations, we measured expression in eighteen populations of cells,
although the accuracy of these predictions with our current sample size are not yet high
enough to make them broadly useful. We clustered this dataset, and found that many
genes known to be expressed in particular tissues cluster together. Comparison with
existing annotation suggests that over a hundred of these clusters of genes are expressed
in a tissue-specific manner. RNA-FISH confirms some of these expression predictions.
Motifs corresponding to known C. elegans transcription factors were enriched upstream
of the genes in many of these clusters. By combining motif enrichment with
coexpression, we obtain many novel predictions about gene regulation. We have
validated several of these predictions using RT-PCR in a mutant background. Our data
and analysis provides a resource for improving our knowledge of tissue-specific
expression and its regulation throughout C. elegans development. Furthermore, our
results suggest a framework for inferring changes in gene expression and cell type
TABLE OF CONTENTS
ACKNOWLEDGMENTS...iii
ABSTRACT...iv
LIST OF TABLES...viii
LIST OF FIGURES...ix
1. Introduction...1
Regulation of tissue-specific transcription...2
Transcription factors...3
Enhancers...5
Tradeoffs in measuring tissue-specific expression...8
Methods for finding tissue-specific targets of TFs...14
Assaying enhancer function...18
Conclusions...20
2. Deconvolution of gene expression from cell populations across the C. elegans lineage ...21
Background...22
Results...26
Discussion...39
Methods...43
Acknowledgements...48
Figures...50
3. Orthogonal cell population expression profiling identifies embryonic regulatory networks in C. elegans...64
Background...65
Results...68
Discussion...83
Materials and methods...86
Acknowledgements...91
Tables...92
Figures...99
4. Conclusions...133
Future directions...134
Summary...139
LIST OF TABLES
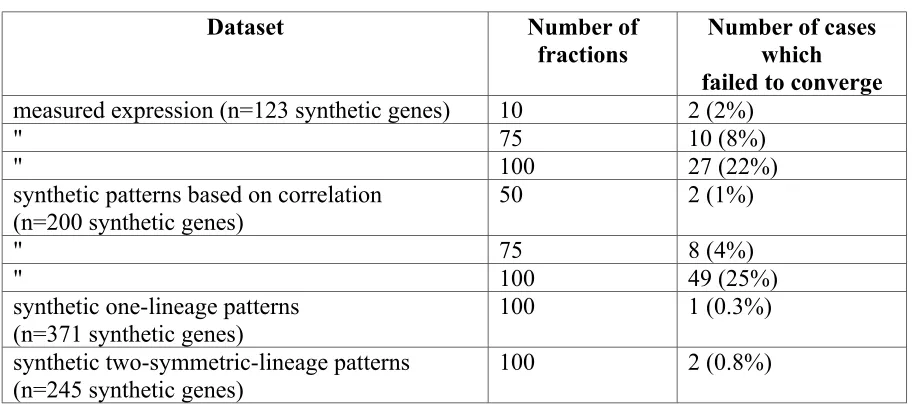
Table 2-1: Number of problem instances in which EP failed to converge...49
Table 2-2: Comparison of running time for various deconvolution methods...49
Table 3-1: Strains and genotypes of embryos used...92
Table 3-2: Expression intensity of reporters in each cell...92
Table 3-3: Total mapped reads for each experiment...93
Table 3-4: Reads per million for each gene...94
Table 3-5: Computed enrichments for each gene...94
Table 3-6: Anatomy terms enriched in FACS-sorted samples...94
Table 3-7: Expression annotation enriched in FACS-sorted samples...94
Table 3-8: Gene ontology terms enriched in FACS-sorted samples...94
Table 3-9: Motifs enriched upstream of genes in FACS-sorted samples...94
Table 3-10: ChIP signals enriched upstream of genes in FACS-sorted samples...94
Table 3-11: Number of motifs found significant using different numbers of clusters, at different cutoffs...95
Table 3-12: Anatomy terms enriched in clustered genes...95
Table 3-13: Expression annotation in clustered genes...95
Table 3-14: Gene ontology terms in clustered genes...95
Table 3-15: Motifs enriched upstream of clustered genes...95
Table 3-16: ChIP signals enriched upstream of clustered genes...95
LIST OF FIGURES
Figure 2-1: Illustration of the method...50
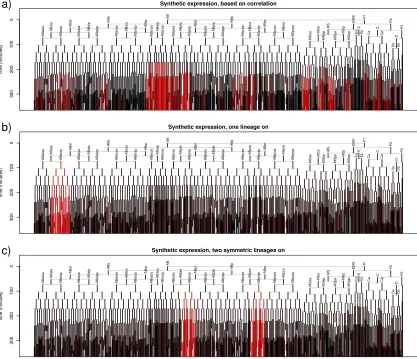
Figure 2-2: Examples of synthetic expression patterns used to measure accuracy...51
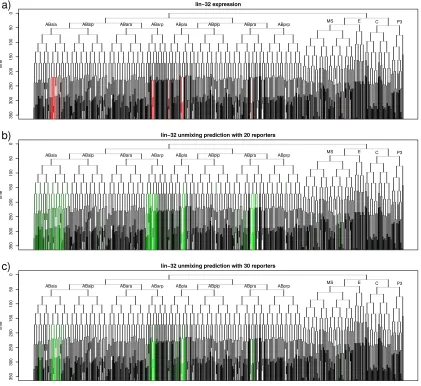
Figure 2-3: Example of expression prediction...52
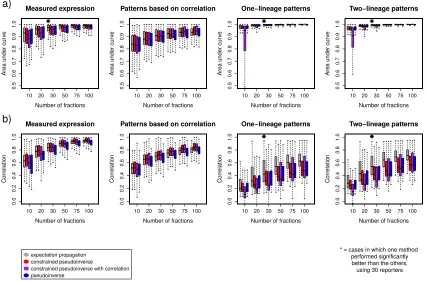
Figure 2-4: Prediction accuracy for several real and simulated data sets...53
Figure 2-5: EP accuracy for one- and two-lineage patterns...54
Figure 2-6: Expression prediction for ceh-27 computed using expectation propagation (EP)...55
Figure 2-7: Prediction bounds for a typical gene, alr-1...56
Figure 2-8: Comparison of sampling prediction intervals with actual expression...57
Figure 2-9: Prediction bounds for expression of a gene in groups of cells, computed using expectation propagation...58
Figure 2-10: Sizes of EP prediction bounds for 123 genes, using thirty simulated reporters...59
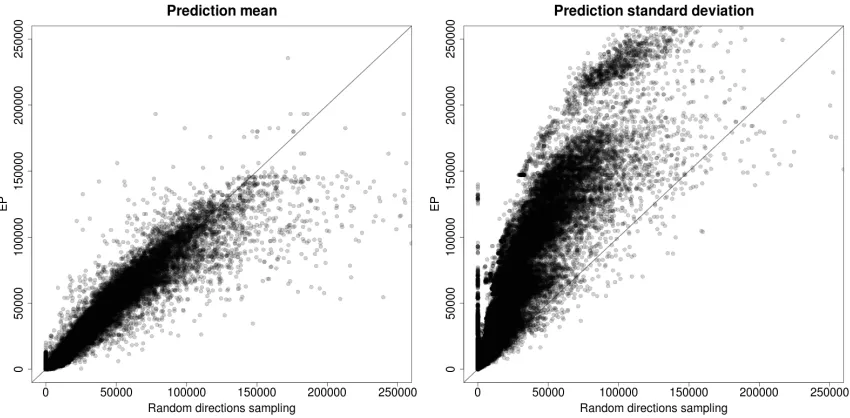
Figure 2-11: Comparison of a) mean and b) standard deviation of prediction bounds from sampling and EP, for 123 genes, using thirty simulated reporters...60
Figure 2-12: Deconvolution accuracy, by AUC and correlation, in the presence of various kinds of experimental noise...61
Figure 2-13: Posterior predicted intervals for alr-1...62
Figure 2-14: Potential scale reduction using increasingly long sampling chains...63
Figure 3-1: Experimental strategy...99
Figure 3-3: Data quality of expression measurements of FACS-sorted cells...114
Figure 3-4: Comparison of enrichments using a matched control...115
Figure 3-5:Enrichments for two replicates of cnd-1 sorting...116
Figure 3-6: Enrichments for selected pairs of samples, calculated for time-specific genes from (Li et al. 2014)...117
Figure 3-7: Accuracy predicting the expression in ungated samples using only (+) and (-) samples (x axis), or using the (+), (-), and singlet control samples (y axis)...122
Figure 3-8: Annotation of FACS-sorted cells...123
Figure 3-9: Clustering of enrichment...124
Figure 3-10: Annotation of clusters...125
Figure 3-11: Correlation of expression patterns for genes in different clusters and the same cluster...126
Figure 3-12: Mean expression and mean absolute enrichments of clusters...127
Figure 3-13: Predicted regulatory relationships...128
Figure 3-14: Non-coding RNAs...129
Figure 3-15: Unmixing cross-validation accuracy...130
Figure 3-16: Reproducibility of enrichments, at different cutoffs...131
1. Introduction
A multicellular organism starts as a single cell, which divides into many cells with
diverse components and functions. This is reflected in the genes they express: for
example, neurons express genes important for neurotransmitter production but not titin,
while muscle cells express titin but not neurotransmitter-related genes. This process
requires particular regulators, such as transcription factors, to function at particular places
and times. If a given regulator or combination of regulators is only expressed in a
particular tissue, then we might hypothesize that other genes also expressed (or not
expressed) only in that tissue are activated (or repressed) by those regulators.
Genome-wide expression data has helped annotate gene function and regulation;
however, most existing methods for measuring cell type-specific gene expression patterns
during development are either limited to measuring a subset of genes, or limited in
resolution. In this chapter, I survey what is known about which genes are expressed in
particular tissues, and why. Then, I survey methods for measuring expression patterns,
and disentangling the regulation of such tissue-specific expression.
Tissue-specific expression
Multicellular organisms clearly develop into distinct parts with organized and
compartmentalized functions. Many different organisms are made of similar materials
(such as hair or leaves). Certain materials (such as hair, leaves, and blood) are present in
material" before, for instance, the biochemistry of polypeptides was understood. It also
implied the existence of a mechanism of inheritance for developmental differences
(Mendel 1866), long before the discovery of DNA.
However, an individual gene isn't visible, or at least distinguishable, even under a
microscope. The introduction of methods to visualize particular genes enabled annotating
the function of many tissue-specific genes, simply based on where they were expressed.
It also raised the question of what causes genes to be expressed in particular cells or
tissues.
Regulation of tissue-specific transcription
There are many genes whose primary purpose is to affect the expression of other
genes. These regulators act at a variety of levels. For instance, every step of gene
expression, including chromatin modification, transcription, splicing, translation,
post-translational modification, protein folding, and mRNA and protein degradation, is
regulated.
Knowing where regulators are expressed can strongly suggest their function. For
instance, several C. elegans mutants were isolated which have no pharynx or rectum
(Mango, Lambie, and Kimble 1994). The locus was thus named pha-4. Later, the
expression pattern of pha-4 was determined to be mostly in the pharynx (and intestine
and rectum). Furthermore, pha-4 encodes a forkhead family DNA binding transcription
factor that binds to regulatory sequences (promoters and enhancers) that control the
expression of hundreds of downstream genes in the pharynx (Horner et al. 1998; Kalb et
tissues in which it had an effect. However, in general, we don't expect regulators and
what they regulate to line up so exactly.
Regulation of gene expression is arguably one of the most important kinds of
regulation, as it determines the “parts list” of components of a particular cell. The level of
expression of mRNA in a cell has been extensively studied. Partly, this may be a matter
of convenience: mRNA can be amplified, by methods such as PCR or aRNA (Baugh et
al. 2001), and the resulting cDNA can be hybridized or sequenced. This makes mRNA
levels easier to quantify than protein levels.
Here, I focus on one important class of expression regulators, transcription factors,
or TFs. Our increasing knowledge of gene expression patterns and the binding motifs for
TFs, make this class of regulators significantly easier to understand than other important
classes of regulators, such as miRNAs, RNA binding proteins, protein kinases, and other
signal transduction pathway components.
Transcription factors
Transcription factors regulate transcription by binding to DNA and modulating
transcription in many ways. They can recruit the basal transcription machinery
(Keaveney and Struhl 1998), or release pausing at promoters (Rahl et al. 2010). They can
also recruit histone acetyltransferases (HATs), which activate expression (Brownell et al.
1996), or HDACs such as the Sin3 complex (Grzenda et al. 2009), which repress it. They
vary in the specificity of the site they bind. Some bind to a fairly specific sequence with
high information content: for example the regulator of cilia development RFX (and its
2005). However, most factors bind to degenerate motifs with only a few informative
nucleotides (Weirauch et al. 2014). The affinity of a TF for a given binding site can relate
to the time at which that TF acts. For instance, pha-4 is active in the development of the
C. elegans foregut at various times. The strength of a pha-4 binding site (along with the
presence of other motifs) can influence when a target gene is expressed (Gaudet et al.
2004).
Some TFs are expressed only in specific tissues, and can force a cell fate decision,
mostly independently. For instance, forced expression of the TF MyoD can induce
expression of muscle-specific genes, even in differentiated, cultured non-muscle cells
(Weintraub et al. 1989). Other factors play a large role in specifying some cell fate, but
are not solely responsible for it. For instance, NKX factors are instrumental in specifying
the heart (Lints et al. 1993). Pit-1 is expressed throughout the pituitary (although not
always translated to protein), and interacts with other TFs to define the pituitary
(Simmons et al. 1990).
However, as noted above, most TFs can bind to a wide variety of sites with
different affinities. This means that most TFs have many apparent binding sites
throughout the genome. Existing data suggest that most genes are not expressed
throughout an organism (e.g., Su et al. 2004; Spencer et al. 2011)), and so presumably not
all apparent TF binding sites are functional.
Why do TFs bind, and function, at only a fraction of their apparent binding sites?
Certainly, the fact that some chromatin is compacted prevents TFs from binding to such
binding sites must be present together, in order to have a regulatory effect. In many cases,
expression of many overlapping TFs gives rise to tissue-specific expression. For instance,
in hematopoiesis, many factors were found to regulate the differentiation of multiple
blood cell types (Novershtern et al. 2011). In C. elegans, a survey of expression patterns
of 127 TFs found many were expressed in overlapping groups of cells, which weren't
tissue-specific (Murray et al. 2012). Therefore, we would expect that in many cases,
many factors act in combination to specify a cell fate.
Enhancers
Many genes are known to be regulated by a combination of transcription factors
binding at regulatory sequences called enhancers. The cooperative action by multiple TFs
at an enhancer provides the major mechanism by which information encoded in several
TF expression patterns combine to form more complex patterns.
A well-studied example from the Drosophila embryo is the even-skipped (eve)
“stripe 2” enhancer. There, bicoid (bcd) and hunchback (hb) proteins activate eve
expression, while giant (gt) and Krüppel (Kr) proteins repress it. These regulators are
expressed in gradients, and bind to several enhancers, resulting in eve expression in seven
stripes. eve, in turn, encodes a homeodomain protein, which regulates downstream steps
in the segmentation process (Arnosti et al. 1996). The stripe 2 enhancer was dissected
using “enhancer bashing”: testing the effect of various modified enhancers on expression
of a reporter construct. Such studies revealed that the eve stripe 2 enhancer is composed
of motifs scattered over a large region, whose spacing, orientation, and location aren't
Many other enhancers have a similarly flexible structure. For instance, in C.
elegans, three factors act to specify dopaminergic neuron fate (Doitsidou et al. 2013).
Examples like these have led to the proposal of a “Billboard model” for enhancer
function in which TF binding spacing and orientation are not critical to the enhancer's
function (Kulkarni and Arnosti 2003). An extension of this termed a “TF collective” was
proposed for five factors, in which only a subset of the factors needed to be present to
specify the dorsal mesoderm cell fate (Junion et al. 2012).
In contrast, some enhancers are bound by many TFs in a less flexible way, such that
the spacing and orientation of the TF binding sites is crucial to the enhancer's function.
For instance, eight TFs bind to a 44-bp enhancer near the interferon-β transcription start
site (Panne 2008). Changing the spacing between these sites disrupts enhancer function
because factors all bind simultaneously as a single complex, termed the “enhanceosome.”
Most recent genome-wide developmental studies suggest “billboard” enhancers are more
common than enhanceosomes, but both mechanisms, or hybrids between them, are likely
used in different situations.
In all of these cases, the activity of an individual enhancer is a complicated function
of the expression level of individual TFs, which can vary between cells, and the
enhancer's sequence, which is the same in each cell (although differences in chromatin
accessibility can affect TF binding). Furthermore, a given gene can be regulated by many
enhancers, providing an additional level of integration. For instance, distinct enhancers
expression profile (Fujioka et al. 1999). This illustrates the complexity of understanding
fully how any single gene is regulated in different tissues.
Chromatin structure and TF binding
In eukaryotes, DNA is usually compactly stored by being wrapped around
nucleosomes. Much of it is tightly compacted in heterochromatin or “closed” chromatin,
but some parts of it, termed euchromatin or “open” chromatin, are less tightly packaged,
allowing contact with TFs and RNA polymerases. The “state” of chromatin being open or
closed can affect transcription, and act as a sort of “memory”. The histone tails of
nucleosomes can have various modifications, which affect chromatin structure, TF
binding, and transcription. In most cases these modifications are placed by protein
complexes that are recruited by TFs: for instance, the CBP complex activates expression
by acetylating H3K27 (Tie et al. 2009), while the Polycomb complex represses
expression by methylating H3 (Schwartz and Pirrotta 2007). In general, TFs don't bind to
DNA in compacted chromatin as effectively because the free energy of DNA associated
with a nucleosome is much lower than that of DNA bound to a single TF. This raises the
question of how enhancers can form in the context of closed chromatin. This occurs in
part through regulation by a class of TFs, known as “pioneer factors”, that can bind DNA
even when that DNA is tightly associated with nucleosomes (reviewed in (Zaret and
Carroll 2011)), and recruit additional factors that can alter local chromatin structure (Hsu
If a TF binds near a particular gene, then that TF may be a regulator of that gene.
However, large-scale ChIP studies of C. elegans and Drosophila TF binding found many
regions which were bound by most of the ChIP factors being assayed. These “Highly
Occupied Target (HOT) sites” tended to be upstream of broadly-expressed genes
(Gerstein et al. 2010, The modENCODE Consortium et al. 2010) and the individual TFs
are generally not required for those genes’ expression. Similarly, a study of factors
regulating different muscle fates in C. elegans found that binding of HLH-1, a master
muscle regulator, was not strongly predictive of regulation (Kuntz et al. 2012). Thus, TF
binding does not in itself imply regulation.
Tradeoffs in measuring tissue-specific expression
Ideally, we would like to measure the expression of every gene, in every cell, at
every developmental time, under different experimental conditions. Such a dataset would
provide a “parts list” of regulators expressed in each cell, as well as a complete list of
genes that increase or decrease in expression in each developmental context. Integrating
these pieces of information could then be used to infer regulatory networks. Many
methods have been developed to measure cell specific expression. In general, current
methods either provide high spatial resolution or complete genomic coverage, but not
both. Recent developments in single-cell sequencing have the potential to measure
expression patterns with single-cell spatial resolution and genome-wide coverage; I
Imaging methods
Genes are usually not individually distinguishable, as mRNA or protein. Rendering
genes visible to microscopy is perhaps the most intuitive way to understand where they're
expressed. Proteins can be made visible by staining with antibodies coupled to
fluorescent dyes (Coons and Kaplan 1950). Similarly, RNA (and DNA) can be labeled by
fluorescence in situ hybridization (FISH) (Raj et al. 2008).
Many methods of visualizing a gene require fixed tissue. The introduction of GFP
(green fluorescent protein) reporters removed this restriction, as GFP is a relatively small
protein, visible as a monomer, which can be expressed and seen in a living organism,
mostly without toxicity or other effects (Chalfie et al. 1994). It can be added as a “tag” to
an existing protein, or used as a “reporter” of how much a given promoter and enhancer
drives expression. More recently, methods have been developed to use GFP fused to
specific RNA binding proteins to visualize the expression of mRNA molecules in live
cells (Bertrand et al. 1998). Microscopic imaging methods of tissues labeled in these
ways can identify not only cell specific expression, but also subcellular localization of a
given gene’s mRNA or encoded protein.
Large-scale expression atlases
Imaging methods only reveal the expression pattern of a few genes in one
experiment, using multiple colors of fluorescent markers. This limits their ability to
determine relationships between genes, such as correlation, genome-wide. However, by
including common reference markers in many images, individual images can be aligned
such an atlas of the Drosophila blastoderm allowed finding regulatory relationships using
regression (Fowlkes et al. 2008). Alternatively, data from individual genes can be aligned
using image processing methods; this has been done for the mouse and human brain (Su
et al. 2004). In C. elegans, the identity of each cell is given by the invariant lineage,
allowing assigning expression to a reference model at single-cell resolution (Murray et al.
2008).
As they only include a few genes at a time, such atlases are labor-intensive to
construct. However, once built, they allow powerful inference of regulatory networks
(indeed, the worm and fly atlases focus on imaging the expression of all embryonic TFs,
for this reason). For example, comparing such atlases for many similar species of
Drosophila showed divergent transcriptional networks (Fowlkes et al. 2011). Thus, such
atlases of related or mutant organisms can be useful, even when they lack genomic
coverage.
Approaches with genome-wide coverage
Imaging methods provide high spatiotemporal resolution, but are harder to apply
genome-wide. In contrast, microarrays and RNA-seq measure expresson genome-wide,
but are not inherently tissue-specific. However, expression can be measured in tissues
that have been dissected, or purified by FACS-sorting. This has been done for many
tissues in humans (The GTEx Consortium et al. 2015) and model organisms, including C.
elegans (Spencer et al. 2011). Most of the available datasets measure expression in
ideally like to see the tissue- and lineage-specific processes which give rise to a particular
cell type, which requires profiling of progenitor cells at different stages of development.
The worm
Faced with the complexity of understanding development, biologists have turned to
studying model organisms. This is a tradeoff: although results in such organisms may not
transfer readily to more complex organisms, results may be easier to obtain.
The model organism we study in this work is Caenorhabditis elegans, or the
“worm”. It is transparent, and can be observed under a microscope. Such observations
revealed that the worm develops from one cell into an embryo in a highly consistent
pattern: cell divisions always occur at essentially the same place and time in the embryo.
This process results in exactly 671 cells, of which 113 die, leaving 558 cells in first-stage
(L1) larvae; further divisions result in 959 cells in the adult hermaphrodite (Sulston et al.
1983). This “invariant lineage” differs from how many organisms (such as mammals)
develop; however, it allows naming individual cells, based on which divisions gave rise
to that cell.
The worm was the first multicellular organism to have its genome sequenced (The
C. elegans Sequencing Consortium 1998). It has a smaller genome (100 Mb) than
humans (3 Gb), but a similar number of protein-coding genes (about 19,000), although
these are expressed in fewer alternatively spliced forms. This means the search space for
regulatory sequences for a given gene is greatly reduced (~30-fold) compared to
mammals. Since the worm grows as a self-fertilizing hermaphrodite with rare males, it is
plates of bacteria, which the worm eats. Strains can nonetheless be bred, as males occur
naturally at a low frequency, which can be increased using RNAi or other means.
Many tools are available which show where an individual gene is expressed. The
worm's transparency motivated development of fluorescent reporter strains, which are
available for many genes (Hunt-Newbury et al. 2007). Furthermore, the invariant lineage
allows determining the identity of a cell, by tracing how it divided. Using 4-D imaging of
fluorescently-labelled nuclei, this process can be automated. By including a fluorescent
reporter (of a different color), the expression of a gene can be measured, with single-cell
resolution, in the embryo (Murray et al. 2008). This has resulted in an atlas of embryonic
expression for hundreds of C. elegans transcription factors (Murray et al. 2012). Similar
ideas have produced an atlas of expression in L1 larvae (Liu et al. 2009).
Expression can be perturbed in many ways. Many mutant strains are available,
which provide a range of alleles from weak alleles to loss-of-function knockouts (The C.
elegans Deletion Mutant Consortium 2012; Thompson et al. 2013). Another means of
perturbing gene expression is RNAi, which was discovered in the worm (Fire et al.
1998). Libraries covering most of the worm's genes are available (Rual et al. 2004) and
RNAi knockdown can be achieved by feeding the worms bacteria expressing double
stranded RNA.
Being able to see, and alter, where genes are expressed has enabled dissecting
several tissue-specific regulators. The primary regulators have been found for many
broad tissue types, including pharynx (Gaudet et al. 2004), intestine (McGhee et al.
found for many more restricted cell types (such as pharyngeal gland cells (Smit,
Schnabel, and Gaudet 2008), coelomocytes (Amin, Shi, and Liu 2010), and ciliated
neurons (Swoboda, Adler, and Thomas 2000), the ASE neurons (Etchberger et al. 2007),
and many others. C. elegans' compact genome means that intergenic regions are shorter,
and so there is simply less sequence to look for enhancers in, compared with higher
eukaryotes such as mammals.
Deconvolution strategies for measuring expression
Many methods for measuring expression patterns genome-wide rely on dissociating
cells into individual samples, and then measuring expression in individual samples. By
contrast, deconvolution methods estimate expression in a large number of tissues, using a
smaller number of measurements. This adds uncertainty to the estimates, but has the
advantage of scalability. It has been applied to the Arabidopsis root (Cartwright et al.
2009) and the zebrafish D. rerio (Junker et al. 2014). These approaches are reminiscent of
“compressed sensing” approaches which estimate a large number of unknowns from a
much smaller number of measurements (Candès, Romberg, and Tao 2006).
The Arabidopsis and D. rerio studies rely on measurements of the marginal sums of
expression in a grid arrangement (although the Arabidopsis grid is not rectilinear). In our
case, there aren't completely orthogonal reporters available in the C. elegans embryo, and
so we needed to develop methods that could deal with expression patterns which
Methods for finding tissue-specific targets of TFs
As described above, individual TFs often bind with low specificity, but enhancers
can concentrate the effect of many overlapping TF patterns to specify expression and cell
fate consistently. We thus expect that the effect of any individual TF on some gene to be
weak, and dependent on the effects of many other TFs as well. In order to understand
how TFs affect expression, we would like many different examples of regulatory
sequences which drive expression in the presence of a particular combination of TFs.
Ideally, we would like to trace the entire process of a TF being expressed, binding to
DNA, and activating expression of target genes. Perturbing different parts of this process
can give stronger evidence of regulation.
Suppose we wish to find which TFs drive expression in a particular set of cells.
Clearly, it would be useful to know which TFs are expressed in those cells; we would
guess that a TF only expressed in those cells affects expression there. We would also like
to know many examples of genes expressed in those cells; these candidate targets could
then be queried for evidence of binding of the candidate regulator.
Inferring regulation from motifs in nearby sequence
Transcription factors bind to DNA and regulate transcription. It might seem that if
complete genome sequence is available and TF binding preferences are known, then
determining the regulators of a given gene's expression should be as simple as reading off
the motifs from the DNA near to the gene.
This is naïve for several reasons. One difficulty is that the sites where transcription
apparent binding sites. Furthermore, in a eukaryotic genome, there are many places to
look for putative regulators. An enhancer can be very far from the gene it regulates (in the
case of the mouse gene Shh, as much as a megabase (Sagai et al. 2005)). Certain histone
marks, such as H3K27ac (Creyghton et al. 2010), are often associated with enhancers. We
can use such marks, as well as conservation (Siepel et al. 2005; Kuntz et al. 2008), to
filter more probable motif occurrences. Another strategy is to consider model organisms;
for instance, the compact genome of C. elegans is an asset, as there is simply less
potential regulatory sequence to look at.
Another challenge is that the motifs bound by all TFs are not known (and many
TFs bind to similar motifs). However, several methods are available to determine TF
binding specificities in vitro. Protein-binding microarrays (PBMs) are tiled with short
strands of known DNA; by fluorescently labelling a TF, we can see which DNA
sequences it binds to preferentially (Berger et al. 2008). A newer approach, HT-SELEX,
first selects DNA fragments bound by a TF, then finds enriched motifs by sequencing
(Jolma et al. 2013). Furthermore, the sequences bound by TFs are often highly conserved.
For instance, the motif bound by the C. elegans forkhead factor pha-4 is very similar to
that bound by its mammalian ortholog, FOXA1. The amount of orthology need to
reliably determine when an ortholog's binding motif is conserved has been calibrated,
reducing the number of in vitro motifs that need to be determined. This scalable approach
has allowed inference of motifs for many eukaryotic TFs (Weirauch et al. 2014),
Motifs can also be found de novo, by searching for patterns in the upstream
sequences of coexpressed genes (Bailey and Elkan 1994; Liu, Brutlag, and Liu 2001;
Hartmann et al. 2013). These methods don't require experimentally determined motifs.
One disadvantage of such methods is that they don't suggest which TF is binding at a
given site. Nonetheless, they have the advantage of only requiring the DNA sequence.
Experimentally assaying binding
The presence of a motif is only indirect evidence that a given TF might bind at a
given site. We can also experimentally determine where in the genome a given TF is
binding. This can be measured by crosslinking protein to DNA, and immunoprecipitating
the protein of interest. The resulting DNA can be quantified using microarrays
(“ChIP-chip”) or, more recently, using high throughput sequencing (“ChIP-seq”). A newer
protocol, ChIP-exo, can resolve the binding site of a TF at essentially single-nucleotide
resolution .
Studying tissue-specific expression, information about the tissues in which a TF is
binding should be useful. Tissue-specific ChIP-seq experiments have been performed for
a large number of human tissues and transcription factors (The ENCODE Project
Consortium 2012). Such measurements can show differences in regulation under different
conditions (Zhong et al. 2010).
Measuring TF binding in particular tissues genome-wide using ChIP-seq is more
difficult in smaller model organisms such as C. elegans, because of the amount of starting
material required by ChIP-seq. However, if we assume that TFs are bound in the cells in
interpreted as tissue-specific, by considering the expression pattern of the TF (Araya et al.
2014).
At even higher spatiotemporal resolution, the “nuclear spot assay” can measure the
binding of a specific TF to artificial chromatin, in individual C. elegans embryonic cells
(Fakhouri et al. 2010). This showed that the “pioneer factor” pha-4 bound specifically to
chromatin in pharyngeal cells, but not in intestinal cells. The authors then found
modifiers of pha-4 binding, specifically in the pharynx, using a small RNAi screen. This
shows the utility of seeing chromatin state (even at only one locus) in specific cells;
presumably, being able to see this genomewide would be even more useful. Emerging
single-cell sequencing-based approaches for measuring chromatin state and TF binding
are described further in Chapter 4.
We can also indirectly detect a TF bound to DNA, by measuring the accessibility of
DNA. The original DNAse footprinting method used a DNAse to degrade DNA which
wasn't protected by any protein (Galas and Schmitz 1978). This measured accessibility at
one locus, and could resolve where an individual protein was binding. With the advent of
high-throughput sequencing, that method was generalized to provide genome-wide
coverage (Hesselberth et al. 2009). A newer method, ATAC-seq (Buenrostro et al. 2013),
has similar resolution, and measures accessibility genome-wide, but has increased
sensitivity. Using accessibility data to measure TF binding entails a tradeoff. If we find
that a particular region is inaccessible (and therefore presumably bound by a TF), we
won't necessarily know precisely what motif is being bound. Furthermore, even if we do
similar motifs.) However, the data reflects the binding of all TFs. By contrast, a binding
peak from a method such as ChIP-seq is known to correspond to the TF which we used
for immunoprecipitation; the drawback is that we only get information about one TF at a
time.
Assaying enhancer function
Genes are often expressed in specific tissues in response to combinations of TFs.
Furthermore, the sequences bound by TFs are often fairly degenerate. Therefore, we
expect that tissue-specific regulation is often the result of many weak influences, acting
in combination. In order to obtain statistical power to find these effects, we need as many
examples of genes (or reporters) expressed in particular tissues as possible. Two
prominent alternatives are to measure the expression of many endogenous genes, or to
measure expression of artificial enhancer constructs.
If we measure the expression of many different genes, the different endogenous
regulatory sequences provide examples of what a TF regulates. For instance, we can
perturb a TF's expression, and look for changes in expression genome-wide, using
microarrays or RNA-seq. Some of the genes whose expression changes presumably may
be direct targets of that TF; we can compare the upstream sequences of perturbed genes
to look for what might be affecting expression. Given the difficulties of measuring
tissue-specific expression, such experiments don't often include information about where the
experimental perturbation changes expression. However, such a strategy has been used to
measure expression patterns of regulators in Drosophila embryos with bicoid (bcd)
“no new combinations of gap and terminal gene expression patterns”, a phenomenon
known as canalization (Staller et al. 2015). Such an approach can uncover novel
developmental mechanisms, by showing the effect of arbitrary perturbations, combined
with the intrinsic effects of differing levels of TFs and other regulators in different cells.
Alternatively, we can assay the activity of endogenous, mutated, or synthetic
enhancers in a specific tissue. These approaches are limited by the rate of transgenesis,
but allow testing arbitrary enhancers. A standard approach to determining if a DNA site is
functional is to mutate it, and measure the activity of an expression reporter. This
“promoter bashing” has been applied to numerous genes and, when applied exhaustively,
can identify the functionally relevant binding sites within an enhancer. The tradeoffs
involved in this mirror the tradeoffs in measuring expression patterns. At one extreme, we
can measure the precise expression pattern a given enhancer drives. For instance, the
activity of hundreds of enhancers has been mapped at high spatial resolution in the mouse
(Visel et al. 2013). The complex expression patterns observed there were not explainable
by single upstream sequence motifs, but were predicted with 80% accuracy by a random
forest classifier based on multiple motifs. This supports the hypothesis that combinatorial
regulation underlies much tissue-specific expression. Since different tissues express
different TFs, that approach tests the effects of enhancers in a variety of different
regulatory contexts, in parallel.
However, that approach is limited in throughput, as it measures one enhancer at a
time. Another approach is to synthesize thousands of enhancers in vitro, with precisely
al. 2012). This has been applied to several liver-specific TFs, where it allowed testing the
effects of motif combinations, quantity, and spacing (Smith et al. 2013). A related
approach, STARR-seq (Arnold et al. 2013), tests the enhancer activity of endogenous
fragments of DNA in a high-throughput way. STARR-seq avoids the costly synthesis
step, by simply using fragmented genomic DNA. These methods are limited to testing
enhancer activity in one cell line or tissue at a time; however, they can test the activity of
millions of sequences in parallel.
Conclusions
To understand development, ideally we would like to trace every step as it
proceeds. This includes knowing when and where each gene is expressed. Such
information should be helpful in understanding what regulates tissue-specific expression.
However, expression (including tissue-specific expression) is regulated by the
combination of a large number of factors. Even given precise spatiotemporal expression
information, inferring regulatory relationships is challenging. I have described the
approaches that have been taken thus far. In the following two chapters I describe two
approaches to comprehensive spatiotemporal expression profiling in the C. elegans
embryo, and the use of these data for regulatory inference. In the final chapter, I provide
2. Deconvolution of gene expression from cell
populations across the
C. elegans
lineage
Adapted from: Burdick, Joshua T., and John I. Murray. 2013. “Deconvolution of
Gene Expression from Cell Populations across the C. Elegans Lineage.” BMC
Bioinformatics 14 (1): 204. doi:10.1186/1471-2105-14-204.
Abstract
Knowledge of when and in which cells each gene is expressed across multicellular
organisms is critical in understanding both gene function and regulation of cell type
diversity. However, methods for measuring expression typically involve a trade-off
between imaging-based methods, which give the precise location of a limited number of
genes, and higher throughput methods such as RNA-seq, which include all genes, but are
more limited in their resolution to apply to many tissues. We propose an intermediate
method, which estimates expression in individual cells, based on high-throughput
measurements of expression from multiple overlapping groups of cells. This approach
has particular benefits in organisms such as C. elegans where invariant developmental
patterns make it possible to define these overlapping populations of cells at single-cell
resolution. We implement several methods to deconvolve the gene expression in
individual cells from population-level data and determine the accuracy of these estimates
on simulated data from the C. elegans embryo. These simulations suggest that a
high-resolution map of expression in the C. elegans embryo may be possible with expression
Background
Multicellular organisms contain many different cell types, each requiring
expression of a distinct repertoire of genes. The transcriptome of each cell is regulated by
many factors, including signals from neighboring cells (Neves and Priess 2005),
long-range gradients of proteins (Arnosti et al. 1996), lineage history (Sulston et al. 1983), or
environmental conditions. In addition to providing information about cell fate regulation,
a gene’s spatial expression pattern may provide clues as to its function. Knowing the
timing of gene expression within a cell or lineage provides additional information, such
as placing limits on the direction of regulatory relationships between genes. A
high-resolution compendium of tissue-specific expression can be used directly to infer
regulatory networks, as was done recently for the human hematopoietic lineage
(Novershtern et al. 2011). Thus, it would be useful to be able to measure the expression
of every gene, in every cell of a multicellular organism, at every developmental time,
with different genetic or environmental perturbations.
Existing expression profiling methods have intrinsic tradeoffs; in general, methods
that measure expression of more genes have lower spatial or temporal resolution or are
less comprehensive in their annotation of distinct tissues. One can measure gene
expression with very high spatial resolution in fixed tissues, by staining protein or RNA
with affinity reagents. The resulting images can be manually curated to describe where
genes are expressed (Frise, Hammonds, and Celniker 2010). If the images can be aligned
at high resolution, then we get a measure of co-expression in individual tissues,
prediction of expression regulation (Fowlkes et al. 2008). At the highest spatial
resolution, methods such as RNA-FISH allow counting of individual mRNA molecules in
fixed tissues (Raj et al. 2008). Fluorescent reporters provide a proxy for precisely where
and when a given gene is expressed in living cells in vivo, and have been used in a wide
variety of animal models (Fowlkes et al. 2008; Liu et al. 2009; Murray et al. 2012).
Despite better scalability than affinity probe methods, reporter methods are limited by the
rate of transgenesis.
A genome-wide alternative is to isolate tissues or populations of cells from an
organism at particular times, and to measure gene expression in each population, using
techniques such as microarrays or RNA-seq. This approach has been applied across a
wide variety of systems including tissues from human, mouse (Su et al. 2004) and C.
elegans (Spencer et al. 2011). This approach has the advantage of full transcriptome
analysis, but spatiotemporal resolution depends on the feasibility of purifying specific
cell populations. In addition, the requirement that each tissue or cell population be
purified and analyzed separately limits the number of distinct cell types for which
expression can be mapped at high resolution across whole organisms.
One strategy to extract high-resolution expression information genome-wide across
full organisms or tissues is to integrate data from multiple individual lower-resolution
experiments by computational inference. Inference methods take advantage of the fact
that genes expressed in a particular tissue or cell population will show expression
changes correlated with (possibly subtle) changes in the distribution of cell types in
location-specific (e.g. (Tomancak et al. 2007)). However, these predictions are limited in
resolution by the spatial resolution of the training data, and the amount of inherent spatial
information present in available datasets.
Deconvolution methods can be used to determine cell or tissue-specific gene
expression patterns from measurements of gene expression in partially overlapping
populations of an organism’s cells. One approach is to infer expression in tissues from
measurements of mixed tissues, but this typically requires an overdetermined design with
at least as many measurements as there are tissues [13]. Others have attempted to use an
underdetermined design by combining genome-wide expression measurements from 13
temporal and 14 spatial samples to predict expression in groups of cells in the
Arabadopsis root (Cartwright et al. 2009). This successfully inferred tissue-specific
expression of genes, even in some tissues that hadn't been explicitly measured. This
method requires spatial and temporal measurements, such that the spatial measurements
are not mutually overlapping (and similarly for the temporal measurements.)
Advantages of deconvolution in the C. elegans embryo
The nematode worm C. elegans is an extensively studied model organism with
several experimental advantages that make it an ideal animal developmental system for
comprehensive gene expression mapping. Each C. elegans embryo produces 671 cells
through an identical pattern of cell divisions, known as an “invariant lineage” (Sulston et
al. 1983) and hatches as a L1 larval worm ~14 hours after fertilization. The invariant
lineage means that each embryo of a given stage has an essentially identical cellular
position in the organism and what tissue identity that cell will adopt. Despite this, the
basic body plan, tissue types, and molecular pathways specifying those tissues are
frequently conserved with other animals, including humans (e.g. (Krause et al. 1990)
(Horner et al. 1998).) Furthermore, C. elegans embryonic cells can be dissociated, and
cells expressing a fluorescent reporter purified by FACS. The resulting samples can then
be analyzed genome-wide for expression by methods such as microarray hybridization or
RNA-seq (Spencer et al. 2011; Fox et al. 2005a) and the results related back to the
lineage if the identity of the FACS-sorted cells is known.
Many reporter strains are available in C. elegans in which cells expressing a
particular gene are labeled with a fluorescent protein, allowing visualization of that gene's
expression throughout development. We and others have used automated lineage tracing
(Murray et al. 2008; Santella et al. 2010) to determine the expression of 127 C. elegans
fluorescent reporter strains across each cell in the lineage (Murray et al. 2012;
Abdus-Saboor et al. 2012). This lineage tracing approach allowed us to identify all cells
expressing each of these reporters. While none of these reporters uniquely identify a
single cell, in combination they can distinguish most of the 671 terminal cells in the
lineage from each other. This collection of reporters provides a large set of overlapping
cell populations that could be analyzed by RNA-seq and used for deconvolution at
resolutions approaching single cells. Here, we describe computational methods to infer
expression across each cell in the C. elegans embryo from FACS sorted cell populations,
and we test these methods on simulated data to define the accuracy bounds for the
developing C. elegans embryo, the methods are general and may be applicable in other
stages of C. elegans development (Liu et al. 2009), or in other organisms where reporter
overlap can be defined at similarly high resolution, such as Drosophila (Fowlkes et al.
2008).
Results
In this study, we test the feasibility of deconvolving expression patterns from
genome-wide expression measurements in sorted cells from C. elegans reporter strains.
We propose to sort cells using the collection of reporters for which we previously
determined the identity of all expressing cells using lineage analysis. In the remainder of
the paper we use the term “fraction” to describe one population of cells that has been
purified in this manner and whose constituent cells are known. The overall strategy is
then to deconvolve the expression patterns from several fractions to infer the expression
patterns at higher resolution, either in individual cells or small groups of cells.
We address a number of questions. How well do different possible methods work
for this deconvolution? How accurately can expression be inferred? How many fractions
need to be sorted for a given level of accuracy? Can we accurately predict not only the
expression levels of a gene across cells, but also the confidence of the predictions? How
would experimental noise influence the accuracy of the predictions? We addressed these
questions by comparing the performance of several deconvolution methods on synthetic
datasets.
Given a reporter expressed in a known pattern, we can sort cells expressing (or not
expressing) that reporter and can then measure the total expression of all genes in that
fraction (Figure 2-1). Because each fraction contains a mixture of cells, the measured
expression of a gene in a fraction is a linear combination of the expression if that gene in
the fraction’s constituent cells.
Suppose there are n cells, and the expression of some gene in cell j is xj . We
wish to estimate xj from measurements of the gene’s expression in sorted fractions from
m different reporters. Let Aij be a number between 0 and 1: 0 if sample i doesn't
contain cell j , and 1 if it does; we refer to this as the sort matrix. Let bi be the total
expression of a gene in fraction i. Then we can cast this as an (underdetermined)
constrained linear regression problem:
Ax=b , where x≥0
Given that the expression values also were constrained to be positive, the possible
expression values form a convex region in a linear space; the size of this space represents
confidence in the expression levels in each cell. For example, the reporters shown in
Figure 1 correspond to the system of linear equations:
[
1 1 1 1 1 1 1 1 1 1 1 1 1 1 1 11 1 1 1 1 1 1 1 0 0 0 0 0 0 0 0 1 1 1 1 0 0 0 0 1 1 1 1 0 0 0 0 0 0 1 1 0 0 1 1 0 0 1 1 0 0 1 1
1 0 0 0 1 0 0 0 1 0 0 0 1 0 0 0
]
x =
[
all fraction1fraction2
fraction3
fraction4
]
, where x≥0 .
Depending on the available reporters and the expression pattern of the gene under
consideration, such data may indicate the exact expression pattern. For example, if a gene
log2(1,341) < 11 sorted fractions would be enough to distinguish which is the expressing
cell, as each fraction could potentially “rule out” expression in half of the cells. While
expression in a single cell does occur (e.g. (Chang, Johnston, and Hobert 2003)), most
genes are expressed in broad collections of cells rather than individual cells, and in
practice, the reporters available for sorting do not match this ideal set.
Simulations
We tested the performance of different deconvolution algorithms on several
synthetic expression datasets. Each dataset contained from 123 to 371 synthetic genes for
which the true expression across all embryonic cells was known. We then generated
simulated expression measurments for each of these genes in each fraction, by summing
expression in the fractions containing the cells positive or negative for reporters whose
expression pattern across all cells we determined previously (Murray et al. 2012).
We wanted to test whether methods could correctly deconvolve expression of
patterns similar to those seen previously, as well as novel patterns. We expect the
accuracy of a method for deconvolution to depend on the expression pattern being
predicted, with simple patterns or patterns similar to the sort markers being easier to
predict. We therefore measured accuracy on an expression dataset including 123 of the
known reporter expression patterns (Murray et al. 2012), augmented with several
synthetic patterns (Figure 2-2). One collection was designed to have a random expression
pattern, such that the overall correlation between cells was similar to the correlation
structure of the known expression patterns. For example, in real expression patterns, cells
equivalents are more correlated in their expression than random cells. We also generated
a collection containing each pattern corresponding to expression in a single cell or
lineage. Finally, because most C. elegans cells exist as left-right symmetric pairs (Sulston
et al. 1983), we also generated patterns with expression in each left-right lineage pair.
While we cannot simulate every possible expression pattern, these data sets should be
representative of the diversity of expression patterns that may exist.
Choice of fractions
The performance of a deconvolution method likely depends on both the total
number of fractions assayed, and which fractions are analyzed. While accuracy may be
highest if all 127 fractions were analyzed, assaying that many fractions would be
expensive and time-consuming. Ideally, we would like to identify collections of fractions
that maximize the accuracy of deconvolution. Compressive sensing theory suggests that
any orthogonal set of expression patterns should perform well (Candès, Romberg, and
Tao 2006). To select such a set, we designed a greedy approach to iteratively choose
fractions to analyze from the reporters with known expression patterns (Murray et al.
2012). We chose reporters based on which maximizes the accuracy of predictions, as
defined by correlation coefficient, on the collection of 371 patterns with expression in
one lineage. A single set was selected using the simplest deconvolution algorithm, the
naïve pseudoinverse (see below). The reporters chosen for sorting by this method tended
to be orthogonal; of the first 30 reporters chosen, the mean absolute correlation between
pairs was 0.15 (very similar to 0.17, for all pairs of reporters). Reporters chosen by this
reporters (data not shown). We used this same ordered list of reporters in evaluating all of
the deconvolution methods on all of the simulated datasets.
Methods for deconvolution
We tested deconvolution methods based on two general approaches: the
pseudoinverse and expectation propagation (EP). We describe each strategy and their
variations below, then overview the performance of the different methods on the
simulated data.
The pseudoinverse
In our simulations, the expression of each gene in each fraction is described by a
potentially underdetermined linear system of equations as there are more cells than
available fractions. The Moore-Penrose pseudoinverse provides a single solution to such
a system based on a minimal least-squares fit. However the solution obtained by
calculating the pseudoinverse may contain negative entries, corresponding to the
biologically unmeaningful “negative expression.” We thus tested two variants of the
pseudoinverse that produce only positive solutions. We either replaced negative numbers
with zero, referred to as the “naïve pseudoinverse,” or incorporated the constraint that
expression is positive along with the linear constraint, referred to as the “constrained
pseudoinverse.”
Compressed sensing theory states that it can be possible to reconstruct a signal
from fewer measurements if there is some regularity to that signal (Candès, Romberg,
and Tao 2006). In existing data, cells sharing similar lineage histories, symmetry
al. 2012). To take advantage of this, we tested an additional variant of the pseudoinverse
which weights potential solutions based on the covariance between each pair of cells, as
estimated from the known gene expression patterns.
Expectation Propagation
We also deconvolved expression by using Expectation Propagation (or “EP”),
which is an iterative strategy for approximating a probability distribution (T. Minka
2001). Unlike the pseudoinverse, EP predicts a range of possible expression patterns
compatible with the data, and thus provides an intrinsic estimation of the confidence of
the prediction. When comparing accuracy between EP and pseudoinverse-based
methods, we used the mean of the EP solution. Although the iterative steps in EP usually
converge, they sometimes diverge, resulting in numerical problems, and no prediction.
For instance, predictions for 10 of 127 genes failed to converge when predicting the real
expression patterns with 75 fractions, and 27 genes failed to converge when predicting
with 100 fractions (Table 2-1). In general, EP's convergence is difficult to prove; failure
to converge may indicate that the approximating distribution doesn't fit the posterior well
(T. P. Minka 2001). Many of the cases in which convergence failed were cases in which
only a few cells were expressing; suggesting that these cases may be poorly fit by the
approximating distribution. We found that we could increase the convergence rate by
adding a damping step, and modifying the algorithm to report the expression predictions
of the last iteration irrespective of convergence. This produced an answer in all cases, but
resulted in slightly lower accuracy (about 5% lower correlation on the actual expression
version. Computing the EP prediction required more CPU time than the naïve
pseudoinverse, but was faster than the other methods when accounting for the time
required to estimate the confidence of deconvolution (Table 2-2.)
Accuracy of deconvolution increases with number of fractions
We measured the accuracy of each algorithm's predictions both in quantitative
terms, and as classification accuracy of on-off predictions. For each of the simulated data
sets, we simulated the measurements from each FACS-sorted fraction. We then applied
each deconvolution algorithm, and compared the simulated expression patterns with the
predicted pattern from deconvolution. When deconvolving expression for a gene in the
known expression pattern set, we excluded that gene from also being used as a sort
marker for a fraction, replacing it with the next fraction on the list if necessary. We
observed that in many cases, the deconvolved pattern was visually similar to the true
pattern, and that the precision of the prediction increased with the number of fractions.
For example, Figure 2-3 shows a measured expression pattern (for the gene lin-32), and
expression predicted by the constrained pseudoinverse method, using either 20 or 30
fractions.
We first assessed which methods most accurately determine which cells are on or
off, without regard for level. We made binary predictions by thresholding the
quantitative predictions, and compared these by using the area under the
receiver-operating-characteristic (ROC) curve (Area Under Curve (AUC); Figure 2-4a). This
measures the sensitivity-specificity tradeoff for different thresholds of the predictions. An
than all non-expressing cells, while an AUC of 0.5 would be expected from completely
random predictions. By this metric, EP performed slightly better than all of the other
methods on each simulated dataset.
To quantify this similarity of expression levels between real and deconvolved
patterns, we calculated the Pearson correlation between the original pattern and the
deconvolved prediction (Figure 2-4b). By this measure, the constrained pseudoinverse
gave the highest accuracy on the “measured expression” and “simulated patterns based on
correlation” datasets, although the differences with EP were not statistically significant.
In contrast, the mean of the EP prediction performed significantly better on the simulated
one- and two-lineage datasets. In these experiments, adding the covariance constraint to
the pseudoinverse predictions didn't improve accuracy; instead it reduced accuracy for
one- and two-lineage patterns, possibly because these patterns are fairly different from
the patterns used to compute the correlation matrix. The constrained pseudoinverse (with
or without the correlation-based prior) performed best when predicting the random
patterns generated from the correlation distribution calculated for real genes.
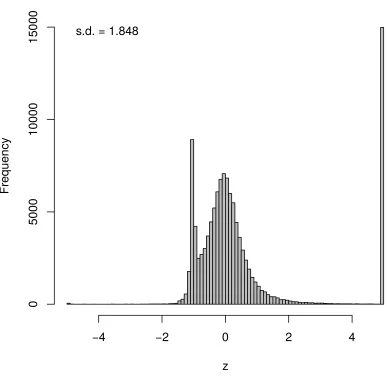
The one- and two-lineage datasets were simulated with a low level of
normally-distributed noise. To test accuracy with non-normal distributions, we repeated the EP
simulations, with “on” and “off” levels randomly drawn from gamma distributions
(Figure 2-5.) The results from this with lower levels of noise were comparable to results
using normally-distributed noise, although higher levels of noise decreased accuracy