R E S E A R C H
Open Access
Catastrophic health care expenditure in
Myanmar: policy implications in leading
progress towards universal health coverage
Chaw-Yin Myint
1,2*, Milena Pavlova
1and Wim Groot
1,3Abstract
Background:Around the world, millions of people are impoverished due to health care spending. The highest catastrophic health expenditures are found in countries in transition. Our study analyzes the extent of financial protection by estimating the incidence of catastrophic health care expenditure in Myanmar and its association with sociodemographic factors.
Methods:We performed a secondary analysis of data from the household surveys conducted by the Livelihoods and Food Security Trust Fund (LIFT) in 2013 and 2015 in Myanmar. To estimate the magnitude of catastrophic health care expenditure, we applied the definition of catastrophic payment proposed by the World Health Organization (WHO); a household’s out-of-pocket payment for health care is considered catastrophic if it exceeds 40% of the household capacity to pay. We also examined the changes in catastrophic payments at three different threshold levels (20, 30, 40%) with one equation allowing for a negative capacity to pay (modified WHO approach) and another equation with adjusted negative capacity to pay (standard WHO approach).
Results:In 2013, the incidence of catastrophic expenditure was 21, 13, 7% (standard WHO approach) and 48, 43, 41% (modified WHO approach) at the 20, 30, 40% threshold level respectively, while in 2015, these estimates were 18, 8, 6% (standard WHO approach) and 47, 41, 39% (modified WHO approach) respectively. Geographical location, gender of the household head, total number of household members, number of children under 5, and number of disabled persons in the household were statistically significantly associated with catastrophic health care expenditures in both studied years 2013 and 2015. Education of household head was statistically significantly associated with catastrophic health expenditure in 2013. We found that the incidence of catastrophic expenditures varied by the approach used to estimate expenditures.
Conclusions:Although the level of catastrophic health care expenditure varies depending on the approach and threshold used, the problem of catastrophic expenditures in Myanmar cannot be denied. The government of Myanmar needs to scale up the current Social Security Scheme (SSS) or establish a new financial protection mechanism for the population. Vulnerable groups, such as households with a household head with a low-level of education, households with children under the age of 5 years or disabled persons, and low-income households should be prioritized by policymakers to improve access to essential health care.
© The Author(s). 2019Open AccessThis article is distributed under the terms of the Creative Commons Attribution 4.0
International License (http://creativecommons.org/licenses/by/4.0/), which permits unrestricted use, distribution, and reproduction in any medium, provided you give appropriate credit to the original author(s) and the source, provide a link to the Creative Commons license, and indicate if changes were made. The Creative Commons Public Domain Dedication waiver (http://creativecommons.org/publicdomain/zero/1.0/) applies to the data made available in this article, unless otherwise stated. * Correspondence:[email protected];[email protected]
1
Introduction
Around the world, millions of people are impoverished due to health care spending or have to spend cata-strophic amounts of money for health care. Catacata-strophic payments impede access to health care. Catastrophic ex-penditure can occur in every country at all stages of de-velopment, even in countries with well-developed financial risk protection mechanisms, e.g., in Australia, the lowest income group had a 15 times higher chance of having catastrophic health expenditure compared to the highest income group [1, 2]. However, the highest catastrophic health expenditures are found in countries in transition. According to a study published in 2003, the proportion of households facing catastrophic health expenditure varies across countries, ranging from 0.01 to 11.4% [3]. A more recent study on 99 countries shows that the global incidence of catastrophic spending at the 10% threshold of household consumption has slightly in-creased from 9.7% in 2000 to 11.4% in 2005 and to 11.7% in 2010 [4].
In Myanmar, out-of-pocket payments (OOPPs) are the main source of health care financing, representing 74% of the total health expenditures in 2015. This percentage ranks Myanmar as the country with the highest OOPPs for health care among the Association of Southeast Asian Nations (ASEAN) [5]. Xu, Evans, et al. 2003 find that the higher the OOPP contribution to the total health expenditure is, the higher the chance of cata-strophic payments is [3]. OOPPs for using health ser-vices can impact equity in accessing health care as well as the economic status at the population. In particular, some household members may choose to forego health care use if the household is not able to make the related OOPPs. Alternatively, households may experience cata-strophic spending if they choose to seek services beyond their ability to pay. At the same time, wealthier house-holds may not be affected by this as they are more able to afford OOPPs [3]. Generally, countries with a prepay-ment system or social protection system provide better access to care and are less burdened by catastrophic health care expenditures [6, 7]. However, such protec-tion mechanisms are largely missing in Myanmar. The Social Security Scheme (SSS) in Myanmar was estab-lished in 1957, but at present, it protects only 1% of the population. The SSS is not yet ready to expand its cover-age because of low capacity of the supply-side.
There are only a small number of studies that have esti-mated catastrophic health care expenditure in Myanmar. The studies that have investigated this expenditure find that cata-strophic payments range between 10 and 40%, depending on the method applied [8–12]. However, these studies have been unable to disaggregate the OOPPs amount for specific health care services, such as pharmaceuticals, medical products, out-patient care, dental, travel, and inout-patient care.
Our study explores not only the extent of financial pro-tection conferred by estimating the incidence of cata-strophic health care expenditure in Myanmar and its association with sociodemographic factors but also high-lights the share of OOPPs that is spent on each type of service such as pharmaceuticals, outpatient care, and others. We performed a secondary analysis of data from the household surveys conducted by the Livelihoods and Food Security Trust Fund (LIFT) in 2013 and 2015 in Myanmar. The LIFT was initiated in 2010 to assist the poor with food availability and income. The LIFT program provides inputs for agriculture (e.g., seed, credit, and equipment) and non-agricultural livelihood (e.g., capital investments, credit, training, technical assistance, and marketing support), as well as advice on natural resource management (e.g., community forestry and mangrove rehabilitation and embankments against flooding) and support to develop effective social protection measures, especially for the chronically poor. The LIFT household survey was conducted among all population groups (i.e., those covered and not covered by the LIFT) in the coun-try’s main agro-ecological zones: Hilly zone, Dry zone, and Delta zone.
Our study is important because it examines the level of financial protection, which is one of the monitoring indicators for health financing arrangements in a coun-try. We use regionally representative data provided by the LIFT survey [13]. Evidence on the association be-tween sociodemographic factors and catastrophic health care expenditures highlights vulnerable groups who should be the priority in social protection policy in Myanmar. We also use two different approaches to check the robustness of our findings, which may be of interest for countries conducting similar studies. Thus, our results are relevant for Myanmar as well as for other low-income countries dealing with high OOPPs.
Data and methods Data sources
The expenditure survey questions were adapted from the 2009–2010 Integrated Household Living Conditions Assessment survey conducted in Myanmar, which was based on the World Bank’s Living Standards Measure-ment Study surveys. The questions were adapted to the Myanmar context by replacing local foods and other goods consumed in the country. We did not participate in the design of the survey and in the data collection process. The data from the expenditure module that we used for our analysis were anonymized before being pro-vided to us.
The expenditure dataset is divided into six sections:
Food consumption expenditures over the last 7 days at home: pulses, beans, nuts, and seeds; meat, dairy, eggs; fish and other seafood; roots and tubers; vegetables; fruits; spices and condiments; other food products except tobacco and alcohol.
Other food consumption expenditures during the last 7 days: alcoholic beverages consumed at home or outside of home; food and beverages taken outside home
Food consumption expenditures during the last 30 days: rice and cereals; oil and fats; milk products; other food items
Nonfood consumption expenditures during the last 30 days: Energy for household use (e.g., firewood, charcoal, kerosene, diesel, gas, electricity, candles, battery charging, and other energy sources); water; personal apparel; medicines/drugs (including traditional medicine); local transport (daily travel excluding that for health and education); other nonfood items
Nonfood consumption expenditures during the last 6 months: clothing and other apparel; home equipment; house rent and repair; health (including traditional medicine); education (including preschool and adult education); travel/trips (overnight travel excluding health and education); other
Value of assets: household items; agricultural items
The estimation of total expenditures was done based on the daily expenditures after recalculating the various timeframes. The variables used in the calculations and their definitions are described in Table1.
Analytical approach
To measure financial protection, two main indicators, namely, catastrophic spending and the impoverishing ef-fects of payment for health care, are used in the litera-ture [4].
Two definitions are widely used to estimate cata-strophic health care expenditure:
1) The sustainable development goal method: when a household’s OOPPs for receiving health care exceeds certain share of household income or consumption [15].
2) The method proposed by the World Health Organization (WHO): when a household’s OOPPs for health care exceeds certain share of household’s capacity to pay [16].
The impoverishing effects of health care spending was defined as total expenditures falling below the poverty line after paying for receiving health care [17]. In our study, we only focused on catastrophic spending because the choice of the poverty line required for the estimation of impoverishment is sensitive in Myanmar.
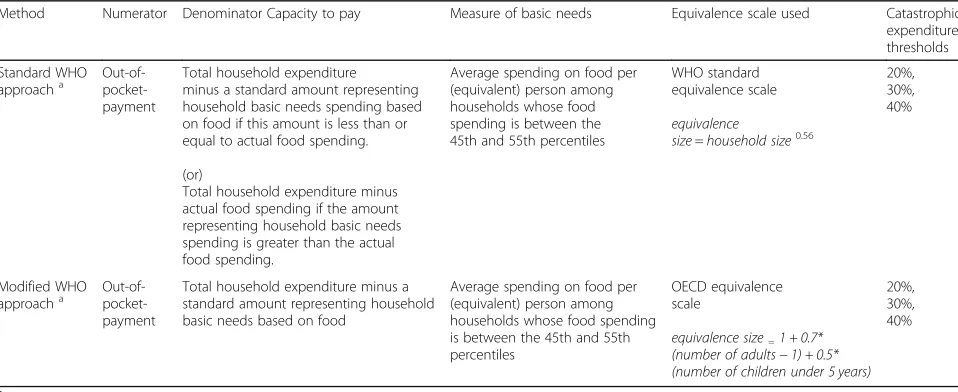
To identify households with catastrophic health care spending, we applied the WHO method mentioned above, which is based on a food-based basic need line to estimate household’s capacity to pay. We used the standard WHO approach and the modified WHO approach [16]. The two approaches differ in the calculation of the basic need line and in the predefined thresholds, which leads to differ-ences in the estimated incidence of catastrophic expendi-tures. Both approaches use OOPPs as the numerator, including both the formal and informal payments made by household for health services. The denominator is the capacity to pay, which is calculated as total household ex-penditures minus subsistence exex-penditures, i.e., the expen-ditures necessary for basic needs. Where food expenditures are regarded as basic needs, then the average spending on food per person by households (food spend-ing between the 45th and 55th percentiles) is used as the standard amount for subsistence expenditures. However, when food expenditures are less than subsistence expendi-tures, the capacity to pay is defined as total household ex-penditures minus food exex-penditures in the WHO standard method. The modified WHO approach, on the other hand, does not require this correction and allows for a negative capacity to pay. Another difference is in the equivalence scales used. The standard WHO equivalence scale is used for the standard WHO approach, and the Organization for Economic Cooperation and Develop-ment (OECD) equivalence scale is used for the modified WHO approach [3,4]. A comparison of estimates of cata-strophic health care expenditures using these two approaches can be found in Table2. Details on the calcu-lation of catastrophic expenditures [16] is presented in Additional file1.
Statistical methods
counted the number of households that exceeded the given thresholds. Results are presented for the total sam-ple in 2013 and 2015. We also present the distribution of catastrophic OOPPs by consumption quintiles: poor-est, second, third, fourth, and the richest quintile. In addition, regression analyses were carried out to identify the relation between sociodemographic characteristics and catastrophic health care expenditures at all three thresholds using both approaches. Sociodemographic characteristics included households’ LIFT intervention
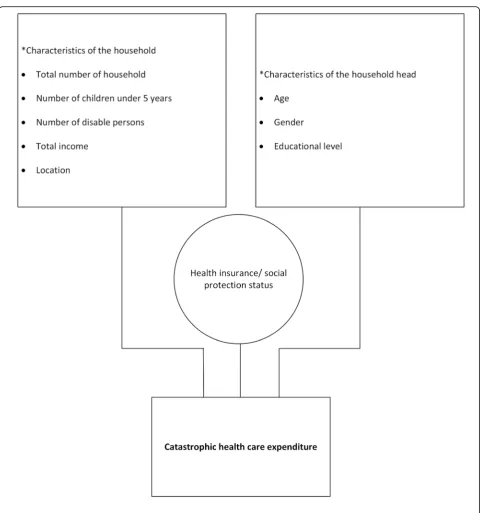
status; region; age, gender, and education of the house-hold head; total number of househouse-hold members; number of children under 5 years old; number of disabled per-sons in the household; and the total monthly household income. These sociodemographic variables are in line with the determinants of catastrophic health care ex-penditure described in the background paper of the Bul-letin of the WHO [18]. The conceptual framework of our analysis is provided in Fig. 1. All analyses were car-ried out using the software package STATA 14.
Table 1Definitions used for creating variables
Out-of-pocket health expenditure
OOPPs refer to the net payment made by households for receiving health care which include the cost of medicines, medical products, outpatient care, dental, travel cost for receiving health care (although it is not included in WHO method, we added traveling cost as one of the burdens to Myanmar people in seeking health care), and inpatient care.
Household consumption expenditure
Household total consumption, either monetary or in-kind payment for all expenditure.
Food expenditure Total expenditure on all foodstuffs except alcoholic beverages, tobacco, and food consumption outside the home. The local median value at the time of survey used as a reference value of nonpurchased food items.
Rent expenditure Expenditure on house rent and repaired are included under rent expenditure.
Utility expenditure Expenditure on energy, including firewood, charcoal, kerosene, diesel, gas (propane or other gases), public electricity, electricity from private sources, candles, and battery charging; and water are included.
Medicines (drugs) Expenditure on traditional medicines, medicines obtained with vouchers (e.g., prescriptions from doctors or other health professionals), other medicines/drugs (e.g., cold remedies and vitamins), and other health care nondurables (e.g., bandages and birth spacing methods) are included.
Medical products and equipment
Expenditure on medical devices (e.g., eye glasses and hearing aids).
Outpatient care (outpatient) Expenditure on out-patient care at public hospitals/health centers/clinics, out-patient care at private hospitals/health centers/clinics, home visits by doctors or other health professionals, care from traditional healer and other health care.
Dental Expenditure on dental care.
Travel Expenditure on health-related transportation costs.
Inpatient care Expenditure on in patient stays/long-term care in public hospitals and in patient stay/long-term care in private clinics.
Income Daily average income to be consistent with expenditure unit.
Children Number of children under 5 years.
Household size Household size.
Table 2Comparison of the two methods used in the estimation of catastrophic health care expenditure
Method Numerator Denominator Capacity to pay Measure of basic needs Equivalence scale used Catastrophic expenditure thresholds
Standard WHO approacha
Out-of- pocket-payment
Total household expenditure minus a standard amount representing household basic needs spending based on food if this amount is less than or equal to actual food spending.
(or)
Total household expenditure minus actual food spending if the amount representing household basic needs spending is greater than the actual food spending.
Average spending on food per (equivalent) person among households whose food spending is between the 45th and 55th percentiles
WHO standard equivalence scale
equivalence
size=household size0.56
20%, 30%, 40%
Modified WHO approacha Out-of-
pocket-payment
Total household expenditure minus a standard amount representing household basic needs based on food
Average spending on food per (equivalent) person among households whose food spending is between the 45th and 55th percentiles
OECD equivalence scale
equivalence size=1 + 0.7*
(number of adults−1) + 0.5* (number of children under 5 years)
20%, 30%, 40%
Results
The incidence of catastrophic expenditures for the two approaches at the 20, 30, and 40% threshold levels is shown in Table3. In 2013, the incidence of catastrophic expenditure was 7% (standard WHO approach) and 41% (modified WHO approach) at the 40% threshold level,
while in 2015, it was slightly lower than 6% (standard WHO approach) and 39% (modified WHO approach). The mean OOPPs expenditure per capita per day in 2013 was 526 MMK (approximately 0.6 USD) (standard WHO approach) and 138 MMK (approximately 0.2 USD) (modified WHO approach), while in 2015, it was
1074 MMK (approximately 1 USD) (standard WHO ap-proach) and 247 MMK (approximately 0.2 USD) (modi-fied WHO approach). Thus, in the standard WHO approach, the incidence of catastrophic expenditure was slightly lower in 2015 than in 2013, although mean OOPPs expenditures nearly doubled in 2015.
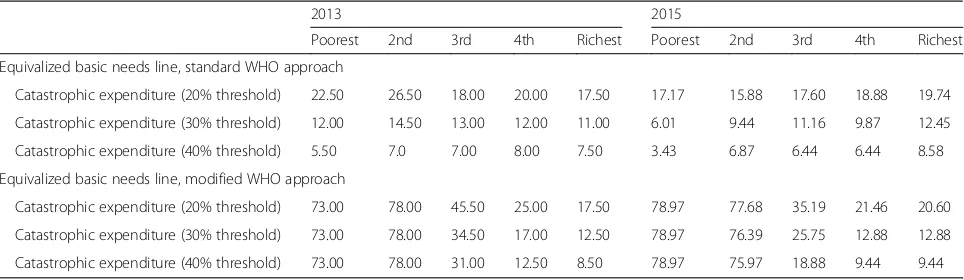
The distribution of catastrophic expenditures by in-come quintiles are shown in Table 4. For both ap-proaches, we found that catastrophic expenditures were lower than or similar to levels when the threshold was increased. Using the standard WHO approach, cata-strophic expenditures were highest within the second quintile at 20 and 30% threshold levels, while in the fourth quintile, it was highest at the 40% threshold level in 2013. In 2015, the highest levels of catastrophic ex-penditures were observed in the richest income quintile at all threshold levels. The modified WHO approach found that catastrophic expenditures were highest in the second quintile in 2013 and the poorest quintile in 2015 at all four threshold levels in both years.
The average levels of OOPPs in each income quintile are shown in Table5. Using the standard WHO approach, there was a six times difference in the average OOPPs value be-tween the poorest and richest quintiles in 2013 (0.2 USD vs.
1.2 USD per capita per day at the 40% threshold level). In 2015, this difference was 10 times greater in the richest quin-tile (0.2 USD vs. 2.1 USD per capita per day). Using the modified WHO approach, the average OOPPs in the richest quintile was 12 times higher than the poorest quintile in 2013 and 20 times higher in 2015 at the 40% threshold level.
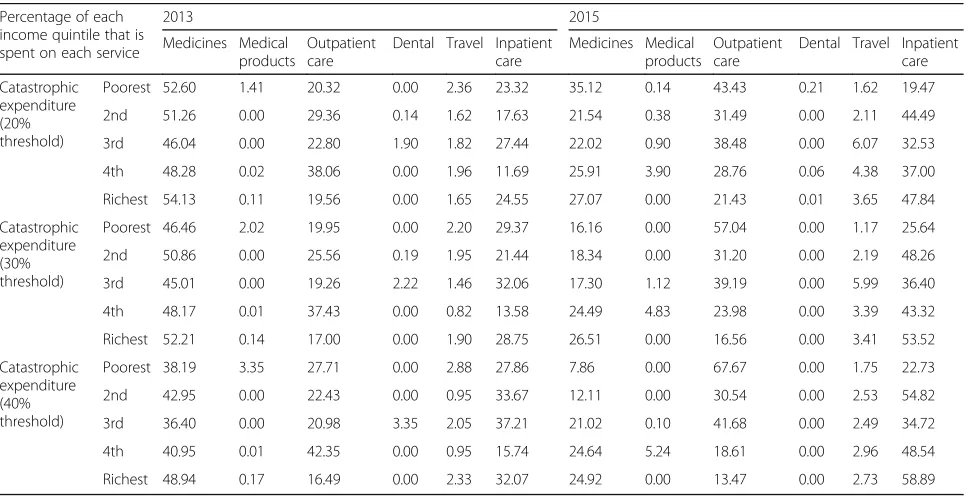
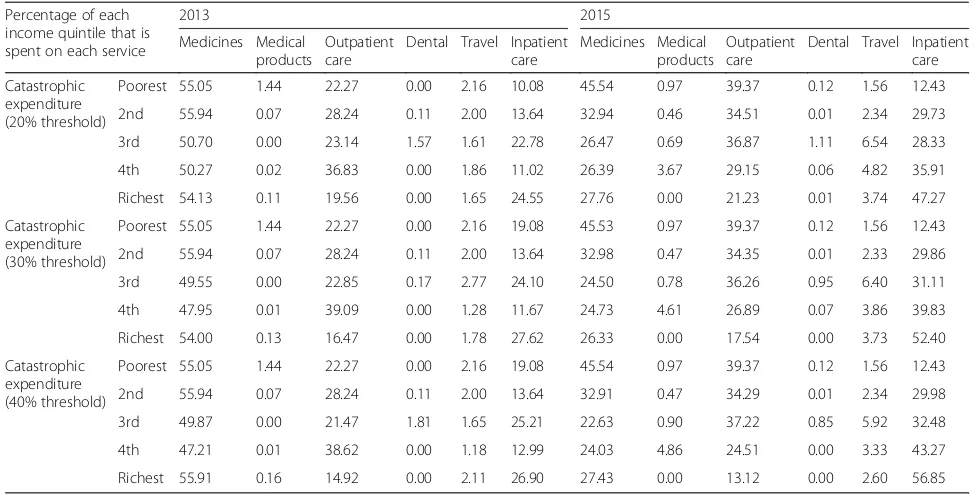
The percentage of daily health expenditures per capita in each income quintile that was spent on each service (i.e., pharmaceuticals, medical products, outpatient care, dental, travel, and inpatient care) based on the two WHO approaches are shown in Tables 6 and 7. Using both approaches, we found that OOPPs for pharmaceu-ticals, outpatient, and inpatient care were the three main areas of payments for services among all income quin-tiles in both years. In all income quinquin-tiles in 2013, the highest share of OOPPs were spent on pharmaceuticals (38–49% using the standard WHO approach, 47–56% using the modified WHO approach). In 2015, the poor-est quintile (68%) and the third quintile (42%) spent most on outpatient care while the other three income quintiles spent most (55–59%) on inpatient care based on estimates calculated using the standard WHO ap-proach. The modified WHO approach shows that the poorest quintile spent approximately 80% of OOPPs on
Table 3Catastrophic health care expenditure, and mean OOPP expenditure (daily per capita) at different levels of threshold by different approaches
Share of respondents who experienced catastrophic health care expenditure
Mean OOPP expenditure, in MMK / in USD
2013 2015 2013
1 USD = 858 MMK 2015
1 USD = 1050 MMK
Equivalized basic needs line, standard WHO approach:
Catastrophic expenditure (20% threshold) 20.90 17.85 291/0.3 603/0.6
Catastrophic expenditure (30% threshold) 12.50 9.79 385/0.4 855/0.8
Catastrophic expenditure (40% threshold) 7.00 6.35 526/0.6 1074/1.0
Equivalized basic needs line, modified WHO approach:
Catastrophic expenditure (20% threshold) 47.80 46.78 142/0.2 263/0.3
Catastrophic expenditure (30% threshold) 43.00 41.37 142/0.2 255/0.2
Catastrophic expenditure (40% threshold) 40.60 38.54 138/0.2 247/0.2
Table 4Share of respondents who experienced catastrophic health care expenditure, in each income quintile
2013 2015
Poorest 2nd 3rd 4th Richest Poorest 2nd 3rd 4th Richest
Equivalized basic needs line, standard WHO approach
Catastrophic expenditure (20% threshold) 22.50 26.50 18.00 20.00 17.50 17.17 15.88 17.60 18.88 19.74
Catastrophic expenditure (30% threshold) 12.00 14.50 13.00 12.00 11.00 6.01 9.44 11.16 9.87 12.45
Catastrophic expenditure (40% threshold) 5.50 7.0 7.00 8.00 7.50 3.43 6.87 6.44 6.44 8.58
Equivalized basic needs line, modified WHO approach
Catastrophic expenditure (20% threshold) 73.00 78.00 45.50 25.00 17.50 78.97 77.68 35.19 21.46 20.60
Catastrophic expenditure (30% threshold) 73.00 78.00 34.50 17.00 12.50 78.97 76.39 25.75 12.88 12.88
medicines and outpatient care in both years. In 2015, the fourth and richest quintiles spent most OOPPs on inpatient care.
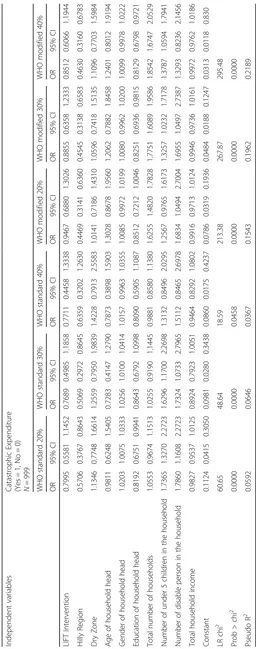
The data on catastrophic health care expenditures were further analyzed by logistic regression analysis to determine the association between sociodemographic characteristics and catastrophic health care expenditures at the three threshold levels using both approaches for data from 2013 and 2015.
Geographical location, gender and education of the household head, total number of household members, number of children under 5, and number of disabled persons in the household were statistically significantly associated with catastrophic health care expenditures in 2013. In 2013, the geographical location of households
was significantly associated with catastrophic health care expenditures at the 20% (OR = 0.57) and 30% (OR = 0.51) thresholds using the WHO standard approach and among all three thresholds levels using the WHO modi-fied approach (20% OR = 0.45, 30% OR = 0.45, and 40% OR = 0.46. In other words, people living in the Hilly zone were approximately 50% less likely to face cata-strophic expenditures than those living in the Delta zone. Female-headed households were 1.02 times more likely to face catastrophic expenditures at 20 and 30% threshold levels using the WHO standard method. Higher levels of education of the household head low-ered the chance of catastrophic expenditure at the 20% threshold level (OR = 0.82) using the WHO standard ap-proach, and at the 30% (OR = 0.83) and 40% (OR = 0.81)
Table 5Mean level of OOPPs household expenditure (daily per capita) in each income quintile
2013 MMK/USD (1 USD = 858 MMK)
2015 MMK/USD (1 USD = 1050 MMK)
Poorest 2nd 3rd 4th Richest Poorest 2nd 3rd 4th Richest
Equivalized basic needs line, standard WHO approach
Catastrophic expenditure (20% threshold) 124/0.1 145/0.2 201/0.2 393/0.5 699/0.8 142/0.1 316/0.3 396/0.4 658/0.6 1367/1.3
Catastrophic expenditure (30% threshold) 163/0.2 199/0.2 238/0.3 534/0.6 884/1.0 174/0.2 442/0.4 503/0.5 924/0.9 1758/1.7
Catastrophic expenditure (40% threshold) 213/0.2 245/0.3 293/0.3 691/0.8 1058/1.2 186/0.2 504/0.5 590/0.6 1164/1.1 2180/2.1
Equivalized basic needs line, modified WHO approach
Catastrophic expenditure (20% threshold) 48/0.1 65/0.1 101/0.1 340/0.4 699/0.8 54/0.1 98/0.1 257/0.2 615/0.6 1326/1.3
Catastrophic expenditure (30% threshold) 48/0.1 65/0.1 121/0.1 438/0.5 829/1.0 54/0.1 100/0.1 312/0.3 811/0.8 1735/1.7
Catastrophic expenditure (40% threshold) 48/0.1 65/0.1 128/0.1 536/0.6 1032/1.2 54/0.1 100/0.1 369/0.4 960/0.9 2082/2.0
Table 6Share of OOPPs in each income quintile that is spent on each service: equivalized basic needs line, standard WHO approach (Partial normative food spending method)
Percentage of each income quintile that is spent on each service
2013 2015
Medicines Medical products
Outpatient care
Dental Travel Inpatient care
Medicines Medical products
Outpatient care
Dental Travel Inpatient care
Catastrophic expenditure (20% threshold)
Poorest 52.60 1.41 20.32 0.00 2.36 23.32 35.12 0.14 43.43 0.21 1.62 19.47
2nd 51.26 0.00 29.36 0.14 1.62 17.63 21.54 0.38 31.49 0.00 2.11 44.49
3rd 46.04 0.00 22.80 1.90 1.82 27.44 22.02 0.90 38.48 0.00 6.07 32.53
4th 48.28 0.02 38.06 0.00 1.96 11.69 25.91 3.90 28.76 0.06 4.38 37.00
Richest 54.13 0.11 19.56 0.00 1.65 24.55 27.07 0.00 21.43 0.01 3.65 47.84
Catastrophic expenditure (30% threshold)
Poorest 46.46 2.02 19.95 0.00 2.20 29.37 16.16 0.00 57.04 0.00 1.17 25.64
2nd 50.86 0.00 25.56 0.19 1.95 21.44 18.34 0.00 31.20 0.00 2.19 48.26
3rd 45.01 0.00 19.26 2.22 1.46 32.06 17.30 1.12 39.19 0.00 5.99 36.40
4th 48.17 0.01 37.43 0.00 0.82 13.58 24.49 4.83 23.98 0.00 3.39 43.32
Richest 52.21 0.14 17.00 0.00 1.90 28.75 26.51 0.00 16.56 0.00 3.41 53.52
Catastrophic expenditure (40% threshold)
Poorest 38.19 3.35 27.71 0.00 2.88 27.86 7.86 0.00 67.67 0.00 1.75 22.73
2nd 42.95 0.00 22.43 0.00 0.95 33.67 12.11 0.00 30.54 0.00 2.53 54.82
3rd 36.40 0.00 20.98 3.35 2.05 37.21 21.02 0.10 41.68 0.00 2.49 34.72
4th 40.95 0.01 42.35 0.00 0.95 15.74 24.64 5.24 18.61 0.00 2.96 48.54
threshold levels using the WHO modified approach. Lar-ger household sizes were associated with greater likeli-hood of facing catastrophic expenditures at all three threshold levels (OR = 1.63, 1.78, 1.85) using the WHO modified approach. Having more children in the family under 5 years old was associated with a greater the likeli-hood of catastrophic expenditures, with odds ratios ran-ging from 1.3 to 1.7 times at the 20 and 30% threshold levels using the WHO standard approach and the 30 and 40% threshold levels using the WHO modified approach. The number of disabled persons living in the household also increased the chance of catastrophic ex-penditures by 1.78 to 1.73 times and 1.68 to 1.70 times at the 20 and 30% threshold levels using the WHO standard and modified approaches, respectively. Detailed results are provided in Table8.
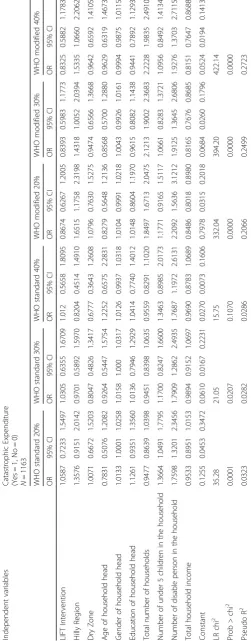
Geographical location, gender of the household head, total number of the household members, the number of children under 5, the number of disabled persons in the household, and total household income were signifi-cantly associated with catastrophic health care expendi-tures in 2015. Using the WHO modified approach, households living in the hilly region were nearly two times (OR = 1.65, 1.43, 1.53) more likely to have cata-strophic expenditures at the 20, 30, and 40% threshold levels. Female-headed households had a 1–2% greater likelihood of catastrophic expenditures at the 20 and 30% threshold levels using the WHO standard method. Larger households were associated with a 1.85, 2.12, and 2.22 times greater likelihood of having catastrophic
expenditures at the 20, 30, and 40% threshold levels using the WHO modified approach. Having more chil-dren under 5 was associated with a 37% increased likeli-hood of having catastrophic expenditures at the 20% threshold level using the WHO standard approach. Hav-ing disabled persons in the household increased the odds of catastrophic payments by 1.76, 1.79, and 1.77 at 20, 30, and 40% threshold levels using the WHO standard approach, and by 2.21, 1.91, and 1.93 using the WHO modified approach. Finally, higher household incomes were associated with a reduced likelihood of catastrophic expenditures, with OR = 0.85, 0.82, and 0.81 at 20, 30, and 40% threshold levels using the WHO modified ap-proach. Detailed results are provided in Table9.
Discussion
Using the standard WHO approach, our findings show that the incidence of catastrophic health care expend-iture ranged from 7 to 21% in 2013 and from 6 to 18% in 2015, depending on the threshold used. This inci-dence is lower than what was observed in previous Myanmar studies conducted in Magway region (23.6%), selected states and regions (32.9%), and among poor families living in two mountainous states (26%), all of which applied the 40% threshold and the WHO standard approach [8,10,11]. These differences may be observed because the studies were conducted across different geo-graphic locations. Additionally, access to high cost facil-ities varied across the studies, since such facilfacil-ities are only located in large cities. The incidence of catastrophic
Table 7Share of OOPPs in each income quintile that is spent on each service: equivalized basic needs line, modified WHO approach (continued)
Percentage of each income quintile that is spent on each service
2013 2015
Medicines Medical products
Outpatient care
Dental Travel Inpatient care
Medicines Medical products
Outpatient care
Dental Travel Inpatient care
Catastrophic expenditure (20% threshold)
Poorest 55.05 1.44 22.27 0.00 2.16 10.08 45.54 0.97 39.37 0.12 1.56 12.43
2nd 55.94 0.07 28.24 0.11 2.00 13.64 32.94 0.46 34.51 0.01 2.34 29.73
3rd 50.70 0.00 23.14 1.57 1.61 22.78 26.47 0.69 36.87 1.11 6.54 28.33
4th 50.27 0.02 36.83 0.00 1.86 11.02 26.39 3.67 29.15 0.06 4.82 35.91
Richest 54.13 0.11 19.56 0.00 1.65 24.55 27.76 0.00 21.23 0.01 3.74 47.27
Catastrophic expenditure (30% threshold)
Poorest 55.05 1.44 22.27 0.00 2.16 19.08 45.53 0.97 39.37 0.12 1.56 12.43
2nd 55.94 0.07 28.24 0.11 2.00 13.64 32.98 0.47 34.35 0.01 2.33 29.86
3rd 49.55 0.00 22.85 0.17 2.77 24.10 24.50 0.78 36.26 0.95 6.40 31.11
4th 47.95 0.01 39.09 0.00 1.28 11.67 24.73 4.61 26.89 0.07 3.86 39.83
Richest 54.00 0.13 16.47 0.00 1.78 27.62 26.33 0.00 17.54 0.00 3.73 52.40
Catastrophic expenditure (40% threshold)
Poorest 55.05 1.44 22.27 0.00 2.16 19.08 45.54 0.97 39.37 0.12 1.56 12.43
2nd 55.94 0.07 28.24 0.11 2.00 13.64 32.91 0.47 34.29 0.01 2.34 29.98
3rd 49.87 0.00 21.47 1.81 1.65 25.21 22.63 0.90 37.22 0.85 5.92 32.48
4th 47.21 0.01 38.62 0.00 1.18 12.99 24.03 4.86 24.51 0.00 3.33 43.27
expenditures in 2013 found in our study were similar to that observed in the Philippines (7.7%) in the same year using the same WHO standard approach and the same threshold level of 40% [19]. In Indonesia and Thailand in 2013, the incidence of catastrophic health care expen-ditures was much lower (4.4 and 2.3%, respectively) based on the Sustainable Development Goal approach. This approach considers health care expenditures to be those that exceed 10% of the household’s total expend-iture on health care [20,21].
Overall, our findings show that in Myanmar, the inci-dence of catastrophic health care expenditure was lower in 2015 compared to that in 2013, although the percent contribution of OOPPs to the total health expenditure was higher in 2015 (74%) than in 2013 (64%) [5]. This finding contradicts what was observed in a previous study by Xu, Evans et al. (2003), which found a positive relationship between the proportion of households with catastrophic health expenditures and the share of OOPPs in total health expenditures. The reasons for this trend may be that household incomes increased during those years (a decline in poverty is observed over the period 2004–2015), or it could be because poor house-holds were more likely to forgo treatment [3, 22]. The issue of forgoing treatments was not captured by a cata-strophic expenditure analysis.
Our study also found that the mean OOPPs expend-iture per capita per day in 2015 was nearly double that observed in 2013. There was 1.2 times inflation of the exchange rate between the two studied years, but alone this trend does not explain the increase in mean OOPPs. Rather, this may have been due to increases in health care costs other than inflation since mean OOPPs ex-penditures increased in USD value at this time as well. Alternatively, it could be due to increased household wealth. In addition, country level data show that OOPPs per capita was increased from 15 USD in 2013 to 44 USD in 2015,although the percent contribution of OOPPs to total health expenditures decreased [5]. This also suggests that health care costs were increasing. However, it should be noted that other potential causes may also exist, such as a reduction in free health care provided through public services and changes in the in-cidence of diseases towards more chronic illnesses.
Analyses of the distribution of catastrophic health care expenditures across income quintiles found that the share of catastrophic expenditures among the poorest households decreased with increasing thresholds in both studied years. Moreover, the share of catastrophic expen-ditures in the poorest quintile was at the lowest across all income quintiles at the 40% threshold using the WHO standard approach. This finding was similar to that reported in a study conducted in China and another study conducted in 8 countries (Bangladesh, Bhutan,
India, Maldives, Nepal, Sri Lanka, Thailand, and Temor-Leste). However, it differs from trends observed in Thailand, where the share of catastrophic OOPPs did not vary by income quintile [18, 23]. In contrast, the highest proportion of catastrophic expenditures were ob-served among the lowest income group in Georgia and Nigeria [24,25]. Our finding of lower incidences of cata-strophic health care expenditures and lower levels of mean OOPPs in the poorest quintile is in line with prior findings of a lower level of health care expenditure in lower income countries and poor households [6]. House-holds facing high health care costs might forgo receiving care because of unaffordable charges. However, this issue requires further investigation because we were not able to examine the reason for the lower incidence of cata-strophic health expenditures observed among poor households in Myanmar.
We found that pharmaceutical costs are the highest spending area for both the poorest and the richest quintile using the WHO standard approach and across all income quintiles using on the WHO modified approach. This finding is consistent with a study of eight countries in the WHO South-East Asia Region, which found that the pro-portion of total OOPPs attributable to pharmaceutical costs is 34.05–81.89% [23]. One study in the Philippines also found that pharmaceutical costs are the main driver of health spending and is as high as two-thirds of the total health spending [19]. Wegner, Graves et al. 2011 also found that between 41 and 56% of households from low-and middle income countries make major OOPPs for pharmaceuticals [6]. The financial burden due to pharma-ceutical cost is not only found in countries that lack a pre-payment system. But also in countries with a well-established health insurance system that require OOPPs for most pharmaceuticals [26, 27]. To control the higher spending on pharmaceuticals, it is important to consider the expansion of pharmaceutical coverage policies, the proper evaluation of essential drug policy on access, use, and affordability, promotion of standard quality generic drugs and active purchasing strategies, and monitoring of medicines utilization [6,28].
social insurance schemes, geographical location and house-hold size [29,30]. One study in India found that the type of village is correlated with catastrophic health care expenditure [31]. This study additionally found that households without insurance faced a greater risk of catastrophic expenditures. However, our study did not include information on the health insurance status of participants because it was not available. Additionally, only a small proportion of the popula-tion in Myanmar possesses health insurance.
We found that the incidence of catastrophic tures varied by the approach used to estimate expendi-tures. These variations emphasize the importance of being consistent in catastrophic health care expenditure ana-lyses. Specifically, our study applied two different ap-proaches, which yielded considerably different incidence rates. The standard WHO approach controls for negative results in calculating capacity to pay. Therefore, it pro-duces a lower incidence of catastrophic expenditures than the modified WHO approach. However, the standard WHO approach better reflects the real-world situation be-cause it uses the actual food-spending costs if the repre-senting household basic needs spending is greater than the actual food spending. The choice of the threshold in a catastrophic expenditure study is also important. As shown by our results, the lower threshold level of 20% of capacity to pay captures up to three times more cata-strophic expenditure cases than those captured at the 40% threshold level. There are also other approaches for esti-mating catastrophic health care expenditures. For ex-ample, the WHO European regional office considers not only food but also rent and utilities spending as a basic need [32]. However, this approach is not recommended for lower-income countries because the inclusion of more spending categories may cause a negative result in calcu-lating the capacity to pay, leading to an overestimation of catastrophic expenditures. This confirms that a cata-strophic expenditure study should be carefully designed to provide meaningful evidence for policy.
Our study has some limitations. First, data were only available for the LIFT intervention area for two rounds of the LIFT survey, which means that these are subna-tional data and also that they cannot be used to study trends. Therefore, the results are not nationally repre-sentative and can not be used for causal inferences. Sec-ond, no information about the insurance or social protection status of the studied population was available, which could have been an important explanatory vari-ables as suggested in other studies [18, 30, 31]. Third, most of the expenditure data retrieved from the LIFT survey capture daily expenditures, and therefore we had to also transform other data (such as income) into daily expenditures. Lastly, the LIFT intervention area is rural, which means that health care utilization patterns and costs might be different from those in urban areas. More
studies are needed to collect and analyze catastrophic health care expenditure data at the national level.
Conclusion
Our study findings provide a base for key policy conclusions as the magnitude of the catastrophic health expenditure is an indicator of the effectiveness of the current health financing arrangements. Although the level of catastrophic health care expenditure varies depending on the approach and threshold used, the problem of catastrophic expenditures in Myanmar cannot be denied. The government of Myanmar needs to scale up the current SSS or establish a new financial protec-tion mechanism for the populaprotec-tion. Vulnerable groups, such as households with a low educated household head, house-holds with children under the age of 5 years or disabled per-sons, and low-income households should be a priority in the improvement of access to essential health care. The inci-dence of catastrophic expenditures that we captured in our study, might only be the tip of the iceberg as our data only represent subnational trends. Additionally, the uneven distri-bution of catastrophic expenditures across wealth quintiles may also show another major problem: individuals not seek-ing needed care because of OOPPs. This problem is not vis-ible in catastrophic health care expenditure research and requires a separate investigation.
Additional file
Additional file 1:Calculation of catastrophic health expenditure. (DOCX 23 kb)
Abbreviations
ASEAN:Association of Southeast Asian Nations; LIFT: Livelihoods and Food Security Trust Fund; MMK: Myanmar Kyat; OECD: Organization for Economic Cooperation and Development; OOPPs: Out-of-pocket payments; SSS: The Social Security Scheme; USD: Unites State Dollar; WHO: World Health Organization
Acknowledgements
The authors received funding from Netherlands Fellowship Programmes (NFP). NUFFIC grant - NFP-PHD 14/15/0007. The authors would like to thank the anonymous reviewers for their helpful comments that greatly contrib-uted to enhancing the quality of this manuscript.
Authors’contributions
CYM–formulation of research question; design of methodology; data analysis; preparation of manuscript specifically writing the initial draft and revision; MP–design of methodology, data analysis, preparation of manuscript specifically critical review; WG–design of methodology, preparation of manuscript specifically validation and critical review.
Authors’information
Chaw-Yin Myint.
Chaw-Yin Myint is a PhD researcher at the department of Health Services Research, CAPHRI school of Public Health, Maastricht University, the Netherlands. Her thesis tile is“Burden of Health Care Expenditure and Feasibility of Implementation of Nationwide Health Insurance in Myanmar”. Her interest is Health financing, Health insurance, Health Care Management and Health policy.
Dr. Milena Pavlova is an Associate Professor of Health Economics at the department of Health Services Research, CAPHRI school of Public Health, Maastricht University, the Netherlands. Her interest includes Health Care Management, Health Economics, Health Policy, Equity, Health Care Services, Health Insurance, and Health Care Financing.
Prof. Wim Groot.
Prof. Wim Groot is the Professor of Health Economics at the department of Health Services Research, CAPHRI school of Public Health, Maastricht University, the Netherlands and Top Institute Evidence-Based Education Re-search (TIER), Maastricht University, the Netherlands. His interest include Health Care Management, Health Economics, Health Policy, Equity, Health Care Services, Health Insurance, and Health Care Financing.
Funding
The main author received funding from Netherlands Fellowship Programmes (NFP). NUFFIC grant - NFP-PHD 14/15/0007.
Availability of data and materials
The datasets generated during and analyzed during the current study are available from the corresponding author on reasonable request.
Ethics approval and consent to participate
Not applicable.
Consent for publication
All authors have seen and approved the final version of the manuscript being submitted. All authors warrant that the article is the authors’original work, has not received prior publication and is not under consideration for publication elsewhere.
Competing interests
The authors declare that they have no competing interests among the authors.
Author details
1Department of Health Services Research, CAPHRI, Maastricht University Medical Center, Faculty of Health, Medicine and Life Sciences, Maastricht University, P.O. Box 616, 6200, MD, Maastricht, The Netherlands.2Water, Research and Training Center (WRTC), Yangon, Myanmar.3Top Institute Evidence-Based Education Research (TIER), Maastricht University, Maastricht, The Netherlands.
Received: 11 March 2019 Accepted: 14 July 2019
References
1. World Health Organization. Designing health financing system to reduce catastrophic health expenditure; 2005.
2. Callander EJ, Fox H, Lindsay D. Out-of-pocket healthcare expenditure in Australia: trends, inequalities and the impact on household living standards in a high-income country with a universal health care system. Heal Econ Rev. 2019;9(1):10.
3. Xu K, Evans DB, Kawabata K, Zeramdini R, Klavus J, Murray CJ. Household catastrophic health expenditure: a multicountry analysis. Lancet. 2003; 362(9378):111–7.https://doi.org/10.1016/S0140-6736(03)13861-5. 4. Wagstaff A, Flores G, Hsu J, Smitz MF, Chepynoga K, Buisman LR, et al.
Progress on catastrophic health spending in 133 countries: a retrospective observational study. Lancet Glob Health. 2018;6(2):e169–e79.https://doi. org/10.1016/S2214-109X(17)30429-1Epub 2017 Dec 13.
5. Global Health Observatory data repository. 2015 [cited Nov 2018]. Available from:http://apps.who.int/gho/data/node.main.75.
6. Wagner AK, Graves AJ, Reiss SK, Lecates R, Zhang F, Ross-Degnan D. Access to care and medicines, burden of health care expenditures, and risk protection: results from the world health survey. Health policy (Amsterdam, Netherlands). 2011;100(2–3):151–8.
7. Xu K, Evans DB, Carrin G, Aguilar-Rivera AM, Musgrove P, Evans T. Protecting households from catastrophic health spending. Health Aff (Project Hope). 2007;26(4):972–83.
8. Khaing IK, Malik A, Oo M, Hamajima N. Health care expenditure of households in Magway, Myanmar. Nagoya J Med Sci. 2015;77(1–2):203–12.
9. Lwin TZ, Sillabutra J, Kongsin S. Household catastrophic health expenditures in selected townships of lower Myanmar. In: Conference on interdisciplinary business research: Society of Interdisciplinary Business Research (SIBR); 2011. 10. Mohanty SK, Agrawal NK, Mahapatra B, Choudhury D, Tuladhar S, Holmgren
EV. Multidimensional poverty and catastrophic health spending in the mountainous regions of Myanmar, Nepal and India. Int J Equity Health. 2017;16(1):21.https://doi.org/10.1186/s12939-016-0514-6.
11. Oo WM, Lwin KT, Soe PP, Bo TZ, Lwin SH, Win MO, et al. Catastrophic expenditure for health care in Myanmar. Burma Med J. 2015;57(2):15–21. 12. Ministry of Health, World Health Organization. Health care financing
methods and access to health care in Myanmar 2007; 2008.
13. Hsu J, Flores G, Evans D, Mills A, Hanson K. Measuring financial protection against catastrophic health expenditures: methodological challenges for global monitoring. Int J Equity Health. 2018;17(1):69.
14. UNOPS. Household survey 2013. Livelihoods and food security trust fund; 2013.
15. World Health Organization and International Bank for Reconstruction and Development / The World Bank. Tracking universal health coverage: 2017 global monitoring report; 2017.
16. Xu K. Distribution of healh payments and catastrophic expenditures: methodology. Geneva: World Health Organization; 2005.
17. Wagstaff A, Flores G, Smitz MF, Hsu J, Chepynoga K, Eozenou P. Progress on impoverishing health spending in 122 countries: a retrospective
observational study. Lancet Glob Health. 2018;6(2):e180–e92.https://doi. org/10.1016/S2214-109X(17)30486-2Epub 2017 Dec 13.
18. Li Y, Wu Q, Xu L, Legge D, Hao Y, Gao L, et al. Factors affecting catastrophic health expenditure and impoverishment from medical expenses in China: policy implications of universal health insurance. Bull World Health Organ. 2012;90(9):664–71.
19. Bredenkamp C, Buisman LR. Financial protection from health spending in the Philippines: policies and progress. Health Policy Plan. 2016;31(7):919–27. 20. Health SDG Profile: Indonesia. 2017 [cited 28 Nov 2018]. Available from:http://
www.searo.who.int/entity/health_situation_trends/countryprofile_ino.pdf?ua=1. 21. Health SDG Profile: Thailand. 2017 [cited 28 Nov 2018]. Available from:http://
www.searo.who.int/entity/health_situation_trends/countryprofile_tha.pdf. 22. Ministry of Planning and Finance and World Bank Group. An analysis of
poverty in Myanmar part 01; 2017.
23. Wang H, Torres LV, Travis P. Financial protection analysis in eight countries in the WHO South-East Asia region. Bull World Health Organ. 2018;96(9):610–20e. 24. Measuring catastrophic health care expenditures in Nigeria: implications for financial risk protection. The consortium for research on equitable health systems (CREHS), DFID. 2010.
25. Gotsadze G, Zoidze A, Rukhadze N. Household catastrophic health expenditure: evidence from Georgia and its policy implications. BMC Health Serv Res. 2009;9:69.
26. van Doorslaer E, O'Donnell O, Rannan-Eliya RP, Somanathan A, Adhikari SR, Garg CC, et al. Catastrophic payments for health care in Asia. Health Econ. 2007;16(11):1159–84.
27. Wagner AK, Valera M, Graves AJ, Lavina S, Ross-Degnan D. Costs of hospital care for hypertension in an insured population without an outpatient medicines benefit: an observational study in the Philippines. BMC Health Serv Res. 2008;8:161.
28. Kaplan WA, Ashigbie PG, Brooks MI, Wirtz VJ. Comparison of medicines management strategies in insurance schemes in middle-income countries: four case studies. J Pharmaceut Policy Pract. 2017;10:17.
29. Njagi P, Arsenijevic J, Groot W. Understanding variations in catastrophic health expenditure, its underlying determinants and impoverishment in sub-Saharan African countries: a scoping review. Syst Rev. 2018;7(1):136.
30. Aregbeshola BS, Khan SM. Determinants of catastrophic health expenditure in Nigeria. Eur J Health Econ. 2018;19(4):521–32.
31. Loganathan K, Deshmukh PR, Raut AV. Socio-demographic determinants of out-of-pocket health expenditure in a rural area of Wardha district of Maharashtra, India. Indian J Med Res. 2017;146(5):654–61.
32. Cylus J, Thomson S, Evetovits T. Catastrophic health spending in Europe: equity and policy implications of different calculation methods. Bull World Health Organ. 2018;96(9):599–609.
Publisher’s Note