R E S E A R C H A R T I C L E
Open Access
Combined effect of unsaturated fatty acids
and saturated fatty acids on the metabolic
syndrome: tehran lipid and glucose study
Somayeh Hosseinpour-Niazi
1, Parvin Mirmiran
2*, Arefeh Fallah-ghohroudi
1and Fereidoun Azizi
3Abstract
Aims:The aim of this study was to investigate whether the background intakes of total dietary fat, monounsaturated fatty acids (MUFA) and polyunsaturated fatty acids (PUFA) modulate the effects of dietary saturated fatty acids (SFA) on metabolic syndrome (MetS).
Material and methods:This population-based cross-sectional study was conducted on a representative sample of 4 677 adults, aged 19 to 84 years. MetS was defined according to the ATP III criteria.
Results:Median intakes of SFA, MUFA and PUFA were 9.5, 9.6 and 5.6% of total energy. High SFA intakes were associated with higher prevalence of MetS, in both individuals with higher and lower median intakes of total fat, MUFA and PUFA.
Conclusions:Our findings indicate that SFA intakes were positively associated with the prevalence of MetS, independent of total dietary fat, MUFA and PUFA intake.
Keywords:Metabolic syndrome, Monounsaturated fatty acid, Polyunsaturated fatty acid, Saturated fatty acid, Interaction
Background
Metabolic syndrome (MetS), a constellation of metabolic abnormalities including glucose intolerance, abdominal obesity, dyslipidemia and hypertension [1], is highly prevalent in Iran. With a prevalence of over 30 % in the adult population, this epidemic is foreseen to continue to escalate over the next decade [2]. Health problems as-sociated with this syndrome include diabetes and cardio-vascular disease [3]. Although the optimal dietary pattern to reduce progression of MetS has not been well established, a reduction in the proportion of calories from fat, particularly saturated fatty acids (SFA) is gener-ally recommended [4]. Previous studies suggest that re-ducing the consumption of SFA may be more effective in the prevention of cardiometabolic risk factors [5, 6]. However, the results of recent studies have been
conflicting regarding the relative effect of SFA intake on cardiometabolic risk factors; some report no effect [7, 8], while others found a beneficial effect [9, 10]. Background intake of dietary monounsaturated fatty acids (MUFA) and polyunsaturated fatty acids (PUFA) may affect these associations [10, 11]. A recent prospective study investi-gating the interaction between nutrients and risk of cor-onary atherosclerosis found that intake of SFA was associated with less progression of coronary atheroscler-osis, an association that was significant only among sub-jects consuming less MUFA [10]. Also in a clinical trial, after categorizing the subjects by the median energy fat percentage, no significant difference was found in high fat diets compared with low fat diets, between the effect of the high SFA and high MUFA diets on insulin sensi-tivity [12]. An experimental study showed that dietary unsaturated fatty acids interfere with SFA in expression of inflammatory markers [13].
However, previous studies have shown no significant interaction between dietary SFA and PUFA on cardio-metabolic risk factors [10, 11]. In a clinical trial study, * Correspondence:mirmiran@endocrine.ac.ir
2
Department of Clinical Nutrition and Dietetics, Faculty of Nutrition Sciences and Food Technology, National Nutrition and Food Technology Research Institute, Shahid Beheshti University of Medical Sciences, Tehran, Iran Full list of author information is available at the end of the article
fish oil had a beneficial effect on some lipid profiles, re-gardless of whether the diet contained high or low amounts of SFA [11]. Considering the limited data avail-able on the association between interaction of SFA, MUFA, PUFA and MetS, the aim of this study was to in-vestigate whether background intakes of total dietary fat, MUFA and PUFA modulate the effects of dietary SFA on the MetS and its components, among 19–84 year old subjects, participants of the Tehran Lipid and Glucose Study (TLGS).
Methods
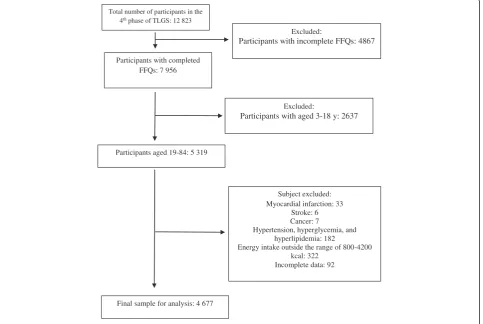
This population based cross-sectional study, conducted within the framework of the TLGS, an ongoing community-based prospective investigation, included a sample of residents under the coverage of 3 medical health centers in District No. 13 of Tehran, the capital city of Iran. The design of the study has been described previously [14]. Briefly, using multistage cluster random sampling methods, 15 005 people, aged≥3 years, were selected and followed up every 3 years. During the fourth phase of the TLGS (2008–2011), a total of 12 823 subjects completed the examinations and were invited to complete the food frequency questionnaire (FFQ); of the
7 956 who agreed to participate and completed the FFQ, 5 319 were aged 19–84 years. Participants were excluded if they were on any specific diets due to medical history of myocardial infarction (n= 33), stroke (n = 6), cancer (n = 7), reported daily energy intakes outside the range of 800–4200 kcal/d (n= 322) and for missing data on physical activity, or any of anthropometrical measure-ments, and biochemical variables (n= 92). Also excluded were participants with hyperlipidemia, hyperglycemia and hypertension that had changed their dietary intake (n= 182). Finally, data for 4677 individuals (2075 males and 2602 females) were analyzed (Fig. 1). The design of the study was approved by the ethical committee of the Research Institute for Endocrine Sciences, Shahid Beheshti University of Medical Sciences, and informed written consent was obtained from all participants.
Dietary assessment
Usual dietary intake was assessed using a 147-item vali-dated semi-quantitative FFQ. The validity and reliability of the FFQ have been described in detail elsewhere [15]. The FFQ consists of a list of foods with a standard serv-ing size, commonly consumed by Iranians. Trained dieti-cians with at least 5 years of experience in the TLGS
Total number of participants in the 4th phase of TLGS: 12 823
Participants with completed FFQs: 7 956
Participants aged 19-84: 5 319
Excluded:
Participants with aged 3-18 y: 2637
Subject excluded: Myocardial infarction: 33
Stroke: 6 Cancer: 7
Hypertension, hyperglycemia, and hyperlipidemia: 182
Energy intake outside the range of 800-4200 kcal: 322
Incomplete data: 92
Final sample for analysis: 4 677
Excluded:
Participants with incomplete FFQs: 4867
survey completed the FFQ during face-to-face inter-views, asking participants to report their frequency of consumption of a given serving of each food item during the previous year on a daily, weekly, or monthly basis [16]. Details on dietary fat intakes, i.e. type of foods con-sumed e.g. full fat vs. fat free were obtained. The re-ported frequency for each food item was converted to a daily intake. Portion sizes of consumed food were then converted to grams using household measures [17]. En-ergy of each gram of food was obtained from the US De-partment of Agriculture’s (USDA) Food Composition Table (FCT) by multiplying the gram of consumption of each food by the content of energy per 100 g and total energy intake was calculated by summing up energy in-takes from all foods. Composition values for SFA, MUFA and PUFA were obtained from the USDA FCT, because the Iranian FCT with regard to fatty acid intakes is in-complete. Among food items in the FFQ, only ‘kashk’ was not listed in the USDA FCT, and its content of total fatty acid and SFA was determined from the nutritional facts given for this product.
Validity and reliability of the FFQ were assessed in a random sample of 132 subjects, aged 20 y and over. The validity and reliability of the FFQ for total dietary fat was acceptable [18]; correlation coefficient between the FFQ and multiple 24-h recalls was 0.59 and 0.38; and between the two FFQs was 0.43 and 0.42, in males and females, respectively [15]. Also intraclass correlations be-tween the two FFQs and bebe-tween multiple 24 recalls and the FFQ for SFA, MUFA and PUFA were acceptable in both genders (range 0.51 to 0.74).
Biochemical assessment
After 12 to 14 h of overnight fasting, blood samples were drawn into vacutainer tubes in a sitting position, from all study participants. All blood analyses were done at the TLGS research laboratory on the day of blood collec-tion, using a Selectra 2 autoanalyzer (Vita; Scientific, Spankeren, the Netherlands). Serum triglyceride concen-trations were measured using triglyceride kits (Pars Azmoon Inc., Tehran, Iran) by the enzymatic calorimetric test with glycerol phosphate oxidase. HDL cholesterol was measured after precipitation of the apolipoprotein B-containing lipoproteins with phosphotungistic acid. Serum fasting glucose concentration was assayed using an en-zymatic colorimetric method with the glucose oxidase technique. Inter- and intra-assay coefficients of variations were both 2.2 % for serum glucose, 2 and 0.5 % for HDL-C and 1.6 and 0.6 % for triglycerides, respectively.
Assessment of other variables
Weight was measured while the subjects were minimally clothed and not wearing shoes, using digital scale and was recorded to the nearest 100 g. Height was measured
while subjects were standing without shoes, with their shoulders in a normal position, using a tape fixed to the wall and was recorded to the nearest 0.5 cm. Body mass index (BMI) was calculated as weight (kg) divided by square of height (m2). Waist circumference (WC) was measured at the level of the umbilicus site, using an out-stretched tape meter, without pressure to body surfaces and was recorded to the nearest 0.5 cm.
Systolic and diastolic blood pressure was measured using a standard mercury sphygmomanometer, on the right arm after a 15-min rest in a sitting position. Two measurements were taken at 1-min intervals and the average of measurement was recorded as the partici-pant’s blood pressure. Physical activity was assessed using a questionnaire, including a list of common activ-ities of daily life; the frequency and amount of time of activities spent per week over the past 12 month were documented [19]. Levels of physical activity were expressed as metabolic equivalent hours per week (METs h/week) [20] and were categorized as light (>3 METs h/week), moderate (3–6 METs h/week) and heavy (≥6 METs h/week) [20]. Cigarette smoking status was categorized as current smoker, non-smoker and ex-smoker. Additional covariate information including age, medical history, and current use of medications was ob-tained using an interview questionnaire.
Definition of MetS
MetS was defined as the presence of≥3 of the following 5 components, as recommended by the Adult Treatment Panel III [1]: 1. Low serum HDL cholesterol (<40 mg/dl in men and < 50 mg/dl in women); 2. High serum triglyceride concentrations (≥150 mg/dl); 3. Elevated blood pressure (≥130/85 mmHg); 4. Impaired fasting glucose (fasting plasma glucose concentrations≥110 mg/dl), and 5. En-larged waist circumference. The cutoff for waist circumfer-ence was adopted from the new description of abdominal obesity for Iranian adults, i.e. 95 cm for both genders [21].
Statistical analysis
The Statistical Package for Social Science (version 15.0; SPSS Inc, Chicago IL) was used for all statistical analyses. Significant differences in characteristics and dietary intakes in the categories of total fat intake and SFA using joint cat-egories of higher (≥ median) versus lower (< median) in-takes were evaluated using one-way analysis of variance for continuous variables and values were reported as Mean (SD). Chi-square test was used to detect any significant dif-ferences in the distribution of participants across quartile categories with regard to qualitative variables.
intake versus lower median intakes [22], by multivari-able logistic regression models. In all multivariate models, subjects with lower median intakes of both un-saturated fatty acids (MUFA and PUFA) and SFA were considered as the reference.
Result
Of 4677 study participants, 44.4 % were male and 55.6 % were female, with a mean age (SD) of 41.7 (13.9) years
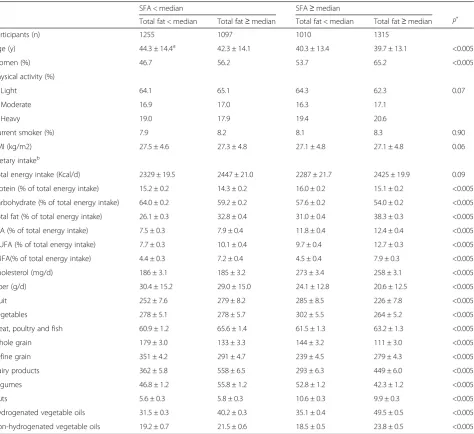
and had mean BMI of 27.2 (4.7) kg/m2. The reported mean (SD) daily intakes were: Total fat 29.9 (6.1) % of total energy intake; SFA 10.2 (2.8) % of total energy in-take; MUFA 10.2 (2.8) % of total energy intake and PUFA 6.1 (1.9) % of total energy intake. Baseline charac-teristics and dietary intakes of the participants according to both total fat and SFA intakes are shown in Table 1. Compared to participants with lower intakes of both SFA and total fat, those with high intake of both SFA
Table 1Characteristics and dietary intakes of participants of the Tehran Lipid and Glucose study, according to Total fat and SFA intakes
SFA < median SFA≥median
Total fat < median Total fat≥median Total fat < median Total fat≥median P*
Participants (n) 1255 1097 1010 1315
Age (y) 44.3 ± 14.4a 42.3 ± 14.1 40.3 ± 13.4 39.7 ± 13.1 <0.005
Women (%) 46.7 56.2 53.7 65.2 <0.005
Physical activity (%)
Light 64.1 65.1 64.3 62.3 0.07
Moderate 16.9 17.0 16.3 17.1
Heavy 19.0 17.9 19.4 20.6
Current smoker (%) 7.9 8.2 8.1 8.3 0.90
BMI (kg/m2) 27.5 ± 4.6 27.3 ± 4.8 27.1 ± 4.8 27.1 ± 4.8 0.06
Dietary intakeb
Total energy intake (Kcal/d) 2329 ± 19.5 2447 ± 21.0 2287 ± 21.7 2425 ± 19.9 0.09
Protein (% of total energy intake) 15.2 ± 0.2 14.3 ± 0.2 16.0 ± 0.2 15.1 ± 0.2 <0.005
Carbohydrate (% of total energy intake) 64.0 ± 0.2 59.2 ± 0.2 57.6 ± 0.2 54.0 ± 0.2 <0.005
Total fat (% of total energy intake) 26.1 ± 0.3 32.8 ± 0.4 31.0 ± 0.4 38.3 ± 0.3 <0.005
SFA (% of total energy intake) 7.5 ± 0.3 7.9 ± 0.4 11.8 ± 0.4 12.4 ± 0.4 <0.005
MUFA (% of total energy intake) 7.7 ± 0.3 10.1 ± 0.4 9.7 ± 0.4 12.7 ± 0.3 <0.005
PUFA(% of total energy intake) 4.4 ± 0.3 7.2 ± 0.4 4.5 ± 0.4 7.9 ± 0.3 <0.005
Cholesterol (mg/d) 186 ± 3.1 185 ± 3.2 273 ± 3.4 258 ± 3.1 <0.005
Fiber (g/d) 30.4 ± 15.2 29.0 ± 15.0 24.1 ± 12.8 20.6 ± 12.5 <0.005
Fruit 252 ± 7.6 279 ± 8.2 285 ± 8.5 226 ± 7.8 <0.005
Vegetables 278 ± 5.1 278 ± 5.7 302 ± 5.5 264 ± 5.2 <0.005
Meat, poultry and fish 60.9 ± 1.2 65.6 ± 1.4 61.5 ± 1.3 63.2 ± 1.3 <0.005
Whole grain 179 ± 3.0 133 ± 3.3 144 ± 3.2 111 ± 3.0 <0.005
Refine grain 351 ± 4.2 291 ± 4.7 239 ± 4.5 279 ± 4.3 <0.005
Dairy products 362 ± 5.8 558 ± 6.5 293 ± 6.3 449 ± 6.0 <0.005
Legumes 46.8 ± 1.2 55.8 ± 1.2 52.8 ± 1.2 42.3 ± 1.2 <0.005
Nuts 5.6 ± 0.3 5.8 ± 0.3 10.6 ± 0.3 9.9 ± 0.3 <0.005
Hydrogenated vegetable oils 31.5 ± 0.3 40.2 ± 0.3 35.1 ± 0.4 49.5 ± 0.5 <0.005
Non-hydrogenated vegetable oils 19.2 ± 0.7 21.5 ± 0.6 18.5 ± 0.5 23.8 ± 0.5 <0.005
Levels of physical activity were expressed as metabolic equivalent hours per week (METs h/week) and categorized as light (<3 METs h/week), moderate (3–6 METs h/week) and heavy (>6 METs h/week)
Grouped according to < or≥median of both Total fat (29.5 % of total energy) and SFA (9.5 % of total energy), with the reference group intake being < median intakes of both MUFA and SFA
BMIbody mass index,SFAsaturated fatty acid,MUFAmonounsaturated fatty acid
*
Pvalue was compared the characteristics across quartiles, using analysis of ANOVA (for age, BMI and dietary intake) and chi-square test (for categorized variables)
a
Values are Mean (SE), except for variables determined
b
and total fat were slightly younger, while there were no significant differences in the physical activity, smoking status, and BMI. Those subjects with high intakes of both SFA and total fat, consumed less carbohydrate, fiber, fruit, vegetable, whole grain, legume and more total fat and SFA, hydrogenated vegetable oils and non hydrogenated vegetable oils (Table 1).
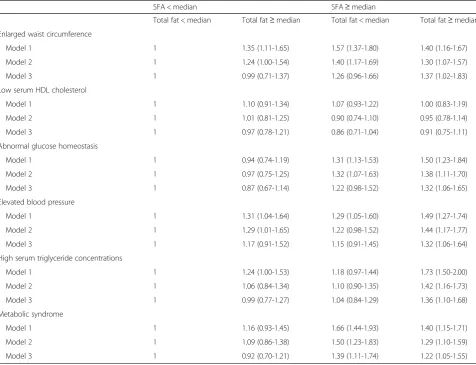
Table 2 showed the odds ratio of the MetS and its components according to intakes of both SFA and total fat intakes. After adjustment for lifestyle and dietary confounders, high SFA intake (≥9.5 % of total energy) was associated with a 39 % higher prevalence of MetS, among subjects with lower total fat intake (95 % CI: 1.11-1.74) and22% higher among subjects with a higher total fat intake (95 % CI: 1.05-1.55), compared with sub-jects with lower intakes of both. Also the combination
of a high SFA and total fat intakes was associated with abnormal glucose homeostasis, elevated blood pressure, and high serum triglyceride concentrations after adjust-ment for confounding factors.
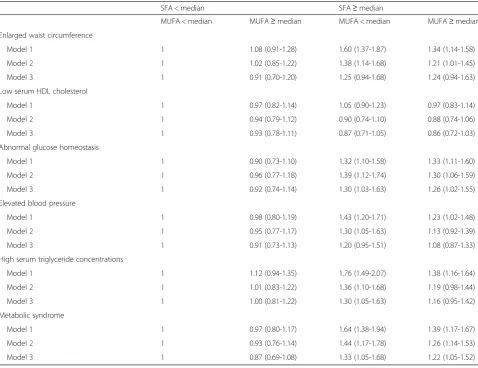
ORs of the MetS and its components according to in-takes of both MUFA and SFA is shown in Table 3. After adjustment for confounding factors, high SFA intake (≥9.5 % of total energy) was associated with higher prevalence of abnormal glucose homeostasis and MetS, whether MUFA intakes was lower or higher than the median intake. Also the combination of a high SFA in-takes and a low MUFA inin-takes was associated with high serum triglyceride concentrations, after adjustment for confounding factors.
Table 4 showed the odds ratio of MetS and its compo-nents according to both PUFA and SFA intakes. After
Table 2Odds ratio and 95 % confidence interval for metabolic syndrome and its components according to total fat and SFA intakes among participants of the Tehran Lipid and Glucose studya
SFA < median SFA≥median
Total fat < median Total fat≥median Total fat < median Total fat≥median
Enlarged waist circumference
Model 1 1 1.35 (1.11-1.65) 1.57 (1.37-1.80) 1.40 (1.16-1.67)
Model 2 1 1.24 (1.00-1.54) 1.40 (1.17-1.69) 1.30 (1.07-1.57)
Model 3 1 0.99 (0.71-1.37) 1.26 (0.96-1.66) 1.37 (1.02-1.83)
Low serum HDL cholesterol
Model 1 1 1.10 (0.91-1.34) 1.07 (0.93-1.22) 1.00 (0.83-1.19)
Model 2 1 1.01 (0.81-1.25) 0.90 (0.74-1.10) 0.95 (0.78-1.14)
Model 3 1 0.97 (0.78-1.21) 0.86 (0.71-1.04) 0.91 (0.75-1.11)
Abnormal glucose homeostasis
Model 1 1 0.94 (0.74-1.19) 1.31 (1.13-1.53) 1.50 (1.23-1.84)
Model 2 1 0.97 (0.75-1.25) 1.32 (1.07-1.63) 1.38 (1.11-1.70)
Model 3 1 0.87 (0.67-1.14) 1.22 (0.98-1.52) 1.32 (1.06-1.65)
Elevated blood pressure
Model 1 1 1.31 (1.04-1.64) 1.29 (1.05-1.60) 1.49 (1.27-1.74)
Model 2 1 1.29 (1.01-1.65) 1.22 (0.98-1.52) 1.44 (1.17-1.77)
Model 3 1 1.17 (0.91-1.52) 1.15 (0.91-1.45) 1.32 (1.06-1.64)
High serum triglyceride concentrations
Model 1 1 1.24 (1.00-1.53) 1.18 (0.97-1.44) 1.73 (1.50-2.00)
Model 2 1 1.06 (0.84-1.34) 1.10 (0.90-1.35) 1.42 (1.16-1.73)
Model 3 1 0.99 (0.77-1.27) 1.04 (0.84-1.29) 1.36 (1.10-1.68)
Metabolic syndrome
Model 1 1 1.16 (0.93-1.45) 1.66 (1.44-1.93) 1.40 (1.15-1.71)
Model 2 1 1.09 (0.86-1.38) 1.50 (1.23-1.83) 1.29 (1.10-1.59)
Model 3 1 0.92 (0.70-1.21) 1.39 (1.11-1.74) 1.22 (1.05-1.55)
Model 1 was crude
Model 2 was adjusted for gender, age, smoking status, physical activity, total energy intake, percentage of energy from carbohydrate, percentage of energy from protein, percentage of energy from polyunsaturated fatty acid, total fiber, and cholesterol
Model 3 was further adjusted for BMI
SFAsaturated fatty acid
a
adjustment for lifestyle and dietary confounders, higher SFA intake (≥9.5 % of total energy) was associated with higher prevalence of MetS, in both participants with higher and lower median intakes of PUFA. Also high SFA intake (≥9.5 % of total energy) was associated with higher prevalence of abnormal glucose homeostasis, whether PUFA intakes was lower or higher.
Discussion
The aim of the current study was to investigate whether the background intake of total dietary fat, MUFA and PUFA modulates the effects of SFA on the MetS and its components. Our findings showed that among Tehra-nian adults, dietary SFA was associated with high preva-lence of the MetS and intake of total dietary fat, MUFA and PUFA (higher or lower than the median) did not
affect the this association. Also the combination of a high SFA and total fat intakes was associated with ab-normal glucose homeostasis, elevated blood pressure, and high serum triglyceride concentrations after adjust-ment for confounding factors.
In prospective studies, dietary SFA has been consid-ered a cardiometabolic risk factors [5, 6], but review of the current evidence indicates surprisingly controversial findings; some report no effect [7, 8], while a few found beneficial effects of dietary SFA on chronic disease [9, 10]. Types of dietary fats tend to be intercorrelated and therefore background intakes of dietary MUFA and PUFA may affect the association between dietary SFA and cardiometabolic risk factors [13, 23]. In the only large cohort study with a 14 year follow up, SFA intake was positively associated with chronic heart disease, but Table 3Odds ratio and 95 % confidence interval for metabolic syndrome and its components according to MUFA and SFA intakes among participants of the Tehran Lipid and Glucose studya
SFA < median SFA≥median
MUFA < median MUFA≥median MUFA < median MUFA≥median
Enlarged waist circumference
Model 1 1 1.08 (0.91-1.28) 1.60 (1.37-1.87) 1.34 (1.14-1.58)
Model 2 1 1.02 (0.85-1.22) 1.38 (1.14-1.68) 1.21 (1.01-1.45)
Model 3 1 0.91 (0.70-1.20) 1.25 (0.94-1.68) 1.24 (0.94-1.63)
Low serum HDL cholesterol
Model 1 1 0.97 (0.82-1.14) 1.05 (0.90-1.23) 0.97 (0.83-1.14)
Model 2 1 0.94 (0.79-1.12) 0.90 (0.74-1.10) 0.88 (0.74-1.06)
Model 3 1 0.93 (0.78-1.11) 0.87 (0.71-1.05) 0.86 (0.72-1.03)
Abnormal glucose homeostasis
Model 1 1 0.90 (0.73-1.10) 1.32 (1.10-1.58) 1.33 (1.11-1.60)
Model 2 1 0.96 (0.77-1.18) 1.39 (1.12-1.74) 1.30 (1.06-1.59)
Model 3 1 0.92 (0.74-1.14) 1.30 (1.03-1.63) 1.26 (1.02-1.55)
Elevated blood pressure
Model 1 1 0.98 (0.80-1.19) 1.43 (1.20-1.71) 1.23 (1.02-1.48)
Model 2 1 0.95 (0.77-1.17) 1.30 (1.05-1.63) 1.13 (0.92-1.39)
Model 3 1 0.91 (0.73-1.13) 1.20 (0.95-1.51) 1.08 (0.87-1.33)
High serum triglyceride concentrations
Model 1 1 1.12 (0.94-1.35) 1.76 (1.49-2.07) 1.38 (1.16-1.64)
Model 2 1 1.01 (0.83-1.22) 1.36 (1.10-1.68) 1.19 (0.98-1.44)
Model 3 1 1.00 (0.81-1.22) 1.30 (1.05-1.63) 1.16 (0.95-1.42)
Metabolic syndrome
Model 1 1 0.97 (0.80-1.17) 1.64 (1.38-1.94) 1.39 (1.17-1.67)
Model 2 1 0.93 (0.76-1.14) 1.44 (1.17-1.78) 1.26 (1.14-1.53)
Model 3 1 0.87 (0.69-1.08) 1.33 (1.05-1.68) 1.22 (1.05-1.52)
Model 1 was crude
Model 2 was adjusted for gender, age, smoking status, physical activity, total energy intake, percentage of energy from carbohydrate, percentage of energy from protein, percentage of energy from polyunsaturated fatty acid, total fiber, and cholesterol
Model 3 was further adjusted for BMI
SFAsaturated fatty acid,MUFAmonounsaturated fatty acid
a
this association was attenuated and was no longer sig-nificant after adjustment for intakes of polyunsaturated fat [23]. A recent prospective study, which investigated the interaction between nutrients and risk of progression of coronary atherosclerosis, found SFA intake to be asso-ciated with less progression of coronary atherosclerosis, only significant among subjects consuming less MUFA [10]; the finding was contrary to ours showing that in-take of SFA increased the risk of MetS, independent of total dietary fat and MUFA and PUFA [10, 23].
Results on the replacement of MUFA with SFA on car-diometabolic risk factors were inconsistent [12, 24–26]. The effect of substation of SFA by MUFA on cardiomet-abolic risk factors may be modulated by total dietary fat [12]. In the KANWN multicenter study, after categoriz-ing the subjects by the median energy fat percentage, in
the low fat intake group, high MUFA diet increased insu-lin sensitivity by 20 %, compared to the high SFA diet; however in the high fat diet, no significant difference was found between the effect of the high SFA and high MUFA diet on insulin sensitivity [12]. An observational study also found that changes in insulin resistance were modified by total fat intake, with an improvement in subjects with total fat intake < 35.5% of total energy and no association in subjects with total fat intake > 35.5% of total energy [27], findings consistent with our results. Our findings was showed dietary SFA to be associated with a higher preva-lence of abnormal glucose homeostasis, elevated blood pressure, and high serum triglyceride concentrations, only among subject with high intake of total dietary fat.
Our findings show high prevalence of MetS and ab-normal glucose homeostasis among subjects with high Table 4Odds ratio and 95 % confidence interval for metabolic syndrome and its components according to PUFA and SFA intakes among participants of the Tehran Lipid and Glucose studya
SFA < median SFA≥median
PUFA < median PUFA≥median PUFA < median PUFA≥median
Enlarged waist circumference
Model 1 1 1.08 (0.91-1.28) 1.06 (0.71-1.27) 1.24 (0.94-1.63)
Model 2 1 1.02 (0.85-1.22) 1.04 (0.70-1.25) 1.21 (0.88-1.45)
Model 3 1 0.91 (0.70-1.20) 0.99 (0.69-1.22) 1.04 (0.70-1.58)
Low serum HDL cholesterol
Model 1 1 0.97 (0.83-1.14) 1.05 (0.90-1.23) 0.97 (0.82-1.14)
Model 2 1 0.88 (0.74-1.06) 0.90 (0.74-1.10) 0.94 (0.79-1.12)
Model 3 1 0.86 (0.72-1.03) 0.87 (0.71-1.05) 0.93 (0.78-1.11)
Abnormal glucose homeostasis
Model 1 1 0.90 (0.73-1.10) 1.32 (1.15-1.58) 1.37 (1.11-1.60)
Model 2 1 0.96 (0.77-1.18) 1.26 (1.09-1.44) 1.30 (1.06-1.59)
Model 3 1 0.92 (0.74-1.14) 1.15 (1.06-1.33) 1.26 (1.02-1.55)
Elevated blood pressure
Model 1 1 1.23 (0.98-1.48) 1.43 (1.20-1.71) 0.98 (0.80-1.19)
Model 2 1 1.13 (0.92-1.39) 1.30 (0.95-1.63) 0.95 (0.77-1.17)
Model 3 1 1.08 (0.87-1.33) 1.20 (0.85-1.51) 0.91 (0.73-1.13)
High serum triglyceride concentrations
Model 1 1 1.38 (1.16-1.64) 1.26 (0.79-2.07) 1.12 (0.94-1.35)
Model 2 1 1.19 (0.98-1.44) 1.16 (0.70-1.68) 1.01 (0.83-1.22)
Model 3 1 1.16 (0.95-1.42) 1.10 (0.55-1.63) 1.00 (0.81-1.22)
Metabolic syndrome
Model 1 1 0.97 (0.80-1.17) 1.64 (1.38-1.94) 1.39 (1.17-1.67)
Model 2 1 0.93 (0.76-1.14) 1.44 (1.17-1.78) 1.26 (1.10-1.53)
Model 3 1 0.87 (0.69-1.08) 1.33 (1.05-1.68) 1.22 (1.05-1.52)
Model 1 was crude
Model 2 was adjusted for gender, age, smoking status, physical activity, total energy intake, percentage of energy from carbohydrate, percentage of energy from protein, percentage of energy from polyunsaturated fatty acid, total fiber, and cholesterol
Model 3 was further adjusted for BMI
SFAsaturated fatty acid,PUFApolyunsaturated fatty acid
a
intake of SFA, independent of dietary PUFA. Consistent with our results, epidemiologic and experimental stud-ies have shown no significant interaction between SFA and PUFA [10, 11]. In a clinical trial study, fish oil had a beneficial effect on some lipid profiles, regardless of whether the diet containing high or low amounts of SFA [11].
Our study has several strengths. In the current study, we evaluate whether total dietary fat, PUFA and MUFA intakes influence relations between SFA and Mets and its components. We found that the association between the SFA intake and some components of MetS is modu-lated by total dietary fat, as suggested by some previous studies [12, 27]. Also, our findings suggest that dietary SFA was associated with MetS, independent of PUFA and MUFA intake, which may have important implica-tions for MetS prevention in populaimplica-tions.
Some limitations should be considered, one being the use of UASD FCT to determine the intakes of PUFA, MUFA and SFA, because of not having a complete Iran-ian FCT. Given the cross-sectional design, we could not determine causality between interaction of different type of fatty acids and the MetS and its components. Future studies using longitudinal data are needed to determine these effects. In addition, this study included only healthy adults, and our findings cannot be extrapolated to other populations.
Conclusion
Our findings indicate that SFA intakes were positively associated with the prevalence of MetS, independent of total dietary fat, MUFA and PUFA intake. However total dietary fat may modulate the association between SFA and some components of MetS, results emphasizing that both the quality and quantity of dietary fat are relevant with Mets and cardiometabolic risk factors.
Competing interests
The authors declare that they have no competing interests.
Authors’contributions
(SH-N, PM, AF-G) conception and design, analysis and interpretation of data; (SH-N) drafting the article; (FA) critical revision. (SH-N, PM, AF-G, FA) final approval of the version to be published. All authors read and approved the final manuscript.
Acknowledgment
The authors wish to acknowledge to Ms N. Shiva for critical editing of English grammar and syntax of the manuscript.
This study was funded by the Research Institute of Endocrine Sciences, Shahid Beheshti University of Medical Sciences, Tehran, Iran (grant 750).
Author details
1Nutrition and Endocrine Research center, Research Institute for Endocrine
Sciences, Shahid Beheshti University of Medical Sciences, Tehran, Iran. 2Department of Clinical Nutrition and Dietetics, Faculty of Nutrition Sciences
and Food Technology, National Nutrition and Food Technology Research Institute, Shahid Beheshti University of Medical Sciences, Tehran, Iran. 3
Endocrine Research Center, Research Institute for Endocrine Sciences, Shahid Beheshti University of Medical Sciences, Tehran, Iran.
Received: 15 June 2015 Accepted: 26 June 2015
References
1. Grundy SM, Cleeman JI, Daniels SR, Donato KA, Franklin BA, Gordon DJ, et al. Diagnosis and management of the metabolic syndrome. An American Heart Association/National Heart, Lung, and Blood Institute Scientific Statement. Circulation. 2005;112:2735–52.
2. Azizi F, Salehi P, Etemadi A, Zahedi-Asl S. Prevalence of metabolic syndrome in an urban population: Tehran Lipid and Glucose Study. Diabetes Res Clin Pract. 2003;61:29–37.
3. Zarich SW. Metabolic syndrome, diabetes and cardiovascular events: current controversies and recommendations. Minerva Cardioangiol. 2006;54:195–214. 4. Krauss RM, Eckel RH, Howard B, Appel LJ, Daniels SR, Deckelbaum RJ, et al. American heart Association’s dietary guidelines: revision 2000: a statement for healthcare professionals from the nutrition committee of the american heart association. Circulation. 2000;102:2284–99.
5. Chiuve SE, Rimm EB, Sandhu RK, Bernstein AM, Rexrode KM, Manson JE, et al. Dietary fat quality and risk of sudden cardiac death in women. Am J Clin Nutr. 2012;96:498–507.
6. Trichopoulou A, Psaltopoulou T, Orfanos P, Trichopoulos D. Diet and physical activity in relation to overall mortality amongst adult diabetics in a general population cohort. J Intern Med. 2006;259:583–91.
7. Harding AH, Day NE, Khaw KT, Bingham S, Luben R, Welsh A, et al. Dietary fat and the risk of clinical type 2 diabetes: the European prospective investigation of Cancer-Norfolk study. Am J Epidemiol. 2004;159:73–82. 8. Meyer KA, Kushi LH, Jacobs Jr DR, Folsom AR. Dietary fat and incidence of
type 2 diabetes in older Iowa women. Diabetes Care. 2001;24:1528–35. 9. Soinio M, Laakso M, Lehto S, Hakala P, Rönnemaa T. Dietary fat predicts
coronary heart disease events in subjects with type 2 diabetes. Diabetes Care. 2003;26:619–24.
10. Mozaffarian D, Rimm EB, Herrington DM. Dietary fats, carbohydrate, and progression of coronary atherosclerosis in postmenopausal women. Am J Clin Nutr. 2004;80:1175–84.
11. Nordöy A, Hatcher LF, Ullmann DL, Connor WE. Individual effects of dietary saturated fatty acids and fish oil on plasma lipids and lipoproteins in normal men. Am J Clin Nutr. 1993;57:634–9.
12. Vessby B, Unsitupa M, Hermansen K, Riccardi G, Rivellese AA, Tapsell LC, et al. Substituting dietary saturated for monounsaturated fat impairs insulin sensitivity in healthy men and women: the KANWU study. Diabetologia. 2001;44:312–9.
13. Lee JY, Sohn KH, Rhee SH, Hwang D. Saturated fatty acids, but not unsaturated fatty acids, induce the expression of cyclooxygenase-2 mediated through Toll-like receptors 4. J Biol Chem. 2001;276:16683–9.
14. Azizi F, Ghanbarian A, Momenan AA, Hadaegh F, Mirmiran P, Hedayati M, et al. Prevention of non-communicable disease in a population in nutrition transition: Tehran Lipid and Glucose Study phase II. Trials. 2009;10:5. 15. Mirmiran P, Hosseini-Esfahani F, Mehrabi Y, Hedayati M, Azizi F. Reliability
and relative validity of an FFQ for nutrients in the Tehran Lipid and Glucose Study. Public Health Nutr. 2009;13:645–62.
16. Willett W. Food frequency methods. In: Nutritional Epidemiology. 2nd ed. New York, PA: Oxford University Press; 1998. p. 74–94.
17. Ghafarpour M, Houshiar-Rad A, Kianfar H. The manual for household measures, cooking yields factors and edible portion of food. Tehran: Keshavarzi Press; 1999.
18. Willett W. Reproducibility and validity of food-frequency questionnaire. In: Nutritional Epidemiology. 2nd ed. New York, PA: Oxford University Press; 1998. p. 101–47.
19. Krishka AM, Knowler WC, Laprte RE, Drash AL, Wing RR, Blair SN, et al. Development of questionnaire to examine relationship of physical activity and diabetes in Prima Indians. Diabetes Care. 1999;13:401–11.
20. Ainsworth BE, Haskell WL, Leon AS, Jacobs DRJR, Montoye HJ, Sallis JF, et al. Compendium of physical activities: classification of energy costs of human physical activities. Med Sci Sports Exerc. 1993;25:71–80.
21. Azizi F, Hadaegh F, Khalili D, Esteghamati A, Hosseinpanah F, Delavari A, et al. Appropriate definition of metabolic syndrome among Iranian adults: report of the Iranian National Committee of Obesity. Arch Iran Med. 2010;13:426–8.
23. Hu FB, Stampfer MJ, Manson JE, Rimm E, Colditz GA, Rosner BA, et al. Dietary fat intake and the risk of coronary heart disease in women. N Engl J Med. 1997;337:1491–9.
24. Hodson L, Skeaff CM, Chisholm WA. The effect of replacing dietary saturated fat with polyunsaturated or monounsaturated fat on plasma lipids in free-living young adults. Eur J Clin Nutr. 2001;55:908–15.
25. Tierney AC, McMonagle J, Shaw DI, Gulseth HL, Helal O, Saris WH, et al. Effects of dietary fat modification on insulin sensitivity and on other risk factors of the metabolic syndrome–LIPGENE: a European randomized dietary intervention study. Int J Obes (Lond). 2011;35:800–9.
26. Bos MB, de Vries JH, Feskens EJ, van Dijk SJ, Hoelen DW, Siebelink E, et al. Effect of a high monounsaturated fatty acids diet and a Mediterranean diet on serum lipids and insulin sensitivity in adults with mild abdominal obesity. Nutr Metab Cardiovasc Dis. 2010;20:591–8.
27. Corpeleijn E, Feskens EJ, Jansen EH, Mensink M, Saris WH, de Bruin TW, et al. Improvements in glucose tolerance and insulin sensitivity after lifestyle intervention are related to changes in serum fatty acid profile and desaturase activities: the SLIM study. Diabetologia. 2006;49:2392–41.
Submit your next manuscript to BioMed Central and take full advantage of:
• Convenient online submission
• Thorough peer review
• No space constraints or color figure charges
• Immediate publication on acceptance
• Inclusion in PubMed, CAS, Scopus and Google Scholar
• Research which is freely available for redistribution