Convergence of Accounting Standards Does Not
Always Lead to Convergence of Accounting
Practices: The Case of China
Karin Olesen* and Fiona Cheng
Abstract
This paper explores the extent to which the adoption of the 2006 Accounting Standards for Business Enterprises (ASBE) in China has resulted in a closer alignment of the Chinese Generally Accepted Accounting Practices (GAAP) with the International Financial Reporting Standards (IFRS). We examine the annual reports of forty seven (47) companies listed on the Shanghai and Shenzhen Stock Exchanges over a two year period between 2006 and 2007. We find that the gap in the profit and equity values between the IFRS and the Chinese GAAP shrunk in absolute terms and that differences between the two sets of accounts disappear following the introduction of the ASBE 2006. In addition, we examine the source of the continued differences between the IFRS and the Chinese GAAP values following the introduction of the 2006 ASBE. The results show that the differences still exist in respect of treatments of financial assets and liabilities, revaluation and depreciation of financial assets, business combinations and land use rights, because even though the companies employed the fair value method in their IFRS accounts, they chose to implement cost method for their accounts prepared under the Chinese GAAP. Our results show that the alignment of standards through convergence has not caused an alignment of practices.
Keywords:Chinese GAAP, International financial reporting standards
JEL Classification: M41
1. Introduction
China plans to converge its Generally Accepted Accounting Practices (GAAP) with the International Financial Reporting Standards (IFRS) by
* Corresponding author. Karin Olesen is a Senior Lecturer at the Faculty of Business, AUT University, Private Bag 92006, Auckland New Zealand,
email: [email protected]
2011. However there is limited evidence to date as to whether true convergence is possible (Peng & Bewley, 2010), and this study will contribute towards this question.
Originally, China had decided to merely harmonise its accounting standards with the IFRS. Harmonisation is a gradual process of aligning both regulation and practice such that they are compatible with international accounting standards (Nobes & Parker, 2008). However in 2006, China decided to converge its GAAP with the IFRS, which as defined by officials of the Chinese Ministry of Finance, means that the principles of recognition, measurement, and reporting are the same as those in the IFRS, with the intention of producing the same results in financial statements of enterprises applying either the IFRS or the 2007 GAAP (Li, 2006). This definition implies that Chinese standard setters intended to converge both accounting standards and practice. Therefore convergence is more than just harmonisation as it is not just about increasing the compatibility of financial statements but getting the same results in financial statements whether prepared according to the IFRS or the Chinese GAAP.
also issued B-shares which could be owned by both foreign and local investors, but for the purpose of this study, we limited our analysis to companies which had A- and H-shares during that period.
Secondly, this research investigated the degree of discrepancies in the convergence of the accounting practices in various industries. Lastly, this research identified the major items that contributed to the differences in net profit and total equity figures reported under the IFRS and the Chinese GAAP. Profit and equity were used as measures for this, as Kuan and Noronha (2007) found these items to be the best indicators of differences between accounts prepared following different standards. These items were not examined for the entire sample of twenty (20) identified industries. Rather, the analysis was carried out by examining the four (4) industries (insurance; coal mining; petroleum, oil and gas refiners, and property leasing and development) that showed either the largest size of discrepancies under the IFRS and the Chinese GAAP or the lowest non-comparable figures under the two sets of accounting standards. Accounts having the largest discrepancy were examined in detail.
The motivation of this study was to examine whether there was empirical evidence to support the findings in previous qualitative studies on the IFRS convergence such as by Peng and Bewley (2010), who suggested that accounting standards, even if substantially converged, might not be implemented in practice. Therefore an empirical examination of specific implementation choices in company financial statements is pertinent.
This study also investigated the degree of discrepancies in the convergence of the accounting standards for different industries. This was through an examination of the companies with the highest discrepancies of accounts prepared in accordance with the Chinese GAAP and the IFRS. It was initially believed that these discrepancies were likely to be industry-based. For example, policy acquisition costs, policyholders’ reserves for life insurance, unearned premium reserves and claim reserves are peculiar to the insurance industry. However, it was subsequently found that there were differences in the accounts regardless of industry. There were four (4) main items which caused the differences, namely, financial assets and liabilities, revaluation and depreciation of fixed assets, business combinations, and land-use rights. These four (4) items would be discussed in relation to their effect on the net profit and total equity of the forty seven (47) companies selected for this study. For historical reasons, implementation choices were given under the Chinese GAAP; and this caused the lack of alignment between the Chinese GAAP and the IFRS. As a result, even though there was convergence of accounting standards, there might not be convergence of accounting practices (Archer, Delvaille, & McLeay, 1995; Chen & Cheng, 2007; Emenyonu & Gray, 1992; Evans & Taylor, 1982).
This paper is organised as follows: The next section examines the literature on the progress of accounting harmonisation of the Chinese GAAP with the IFRS. Section 3 discusses the research methodology adopted to analyse the differences in the profit and equity figures reported by the sample companies under the IFRS and the Chinese GAAP. The analysis and discussion of the Chinese companies’ accounts on four (4) areas of general discrepancy, i.e. financial assets and liabilities, revaluation and depreciation of fixed assets, business combinations, and land-use rights, are found in sections 4 and 5 respectively of this paper. Section 6 concludes.
2. The progress of accounting harmonisation in China
This section focuses on previous studies on the progress of accounting harmonisation of the Chinese GAAP with the IFRS1. Though there is
literature on the progress of harmonisation since 1980’s (Qin, 1989; Yu & Zhang, 2007), our focus is on the literature using the 2001 ASBE and 2006 ASBE. This is because we are analysing the financial data of selected companies in the years 2006 (using 2001 ASBE) and 2007 (using 2006
1 Studies prior to 2006 discuss the harmonisation process (as opposed to the convergence)
ASBE). Thus, the studies by Kuan and Noronha (2007), Hussain et al. (2008), Peng (2005), Chen et al. (2002), Lin and Wang (2001) and Chen et al. (1999) are the most relevant for the purpose of our study and will be discussed in this section.
Kuan and Noronha (2007) examined the 2001 ASBE; Hussain et al. (2008)’s study was on the 1998 and 2001 ASBE; Peng (2005) on the 1992, 1998 and 2001 ASBE; Chen et al. (2002) studied the 1992 and 1998 ASBE; Lin and Wang (2001) focused on the 1992 and 1998 ASBE; and Chen et al. (1999) analysed the 1992 and 1998 ASBE. These studies compared the financial data reported according to the IFRS and the various ASBE, which were the Chinese GAAP. The researchers reported varying results on the differences between the Chinese GAAP and the IFRS; with substantial improvements in the harmonisation between the Chinese GAAP with the IFRS in recent years.
Chen et al. (1999) examined the earnings reported under the IFRS and 1992 ASBE for the years 1994 and 1997. Financial data was collected from thirty four (34) B-share companies in 1994 and fifty (50) B-share companies in 1997. In general, their findings suggested the earnings reported under the Chinese GAAP (1992 ASBE) were significantly higher than the earnings reported in accounts prepared in accordance with the IFRS. As a result, Chen et al. contended that the Chinese accounting was significantly less conservative than the IFRS, and attributed the differences to four main reasons: the different practices of the two sets of accounting standards; earnings management; non-accounting regulations; and the special events that occurred during the Chinese economic development process. Although the sample data was from the period before the introduction of the 1998 ASBE, Chen et al. also briefly discussed the effects of the 1998 ASBE, which made changes to the standards in relation to the provision of bad debts, inventory and temporary investment valuation. They suggested that the 1998 ASBE might have significantly reduced the gaps between the Chinese GAAP and the IFRS due to the said changes. It must be noted that Chen et al. (1999)’s conclusion was based on the comparison of the 1992 and 1998 ASBE. Nevertheless, there were other researchers who conducted studies on the quantified effects of the 1998 ASBE on the progress of harmonisation with the IFRS.
revenue, income before tax, net income, earnings per share, total assets, net owner’s equity and return on assets of the three (3) companies. In general, similar to the findings in Chen et al. (1999), Lin and Wang found the reporting figures under the Chinese GAAP were higher than those reported under the IFRS and HKFRS (Hong Kong Financial Statements). In fact, the gaps in the reporting figures between the HKFRS and the Chinese GAAP were even larger than those reported between the IFRS and the Chinese GAAP. They also suggested that the discrepancies could be attributed to the lack of standardisation in Chinese accounting practices, which provided a choice of procedures or policies to restate financial figures and, in turn, gave opportunity for earnings management (Lin & Wang, 2001).
Chen et al. (2002) compared the financial data reported according to the 1992 and 1998 ASBE and the IFRS. They used a before-and-after sample design, with financial data collected from 1997 to 1999 of seventy five (75) sample companies which issued both A- and B-shares. With the available data, they compared the earnings reported under both 1992 and 1998 ASBE against the earnings reported under the IFRS. They found the 1998 ASBE did not reduce the gap between the IFRS and the Chinese GAAP. Substantial differences still existed; earnings reported under the Chinese GAAP tended to be higher than those reported according to the IFRS. They suggested that the lack of accounting infrastructure, low quality of auditing, and earnings management were the main reasons for the differences (Chen et al., 2002). Peng (2005) measured the progress of Chinese accounting harmonisation with the IFRS in a different way. Instead of comparing the reported earnings, Peng developed a checklist of seventy seven (77) measurement items and assigned each measurement item a rank of closeness to the IFRS. Using the checklist, Peng compared the 1992, 1998 and 2001 ASBE with the IFRS. Contrary to prior studies, Peng (2005) found progressing improvements in the harmonisation of the Chinese GAAP with the IFRS. There was significant improvement from the 1992 to the 1998 ASBE and also from the 1998 to the 2001 ASBE. According to Peng (2005), out of the seventy seven (77) selected items, fourteen (14), thirty six (36) and fifty three (53) items in the 1992, 1998 and 2001 ASBE respectively were fully harmonised with the IFRS (Peng, 2005). However, it should be noted that Peng (2005) did a qualitative comparison between the Chinese GAAP and the IFRS; she did not quantify the effects on the reported figures according to the respective accounting standards.
B-shares. Hussain et al. examined the reconciliation statements of the fifty one (51) companies and found there was a downward trend in the earnings gap between the Chinese GAAP and the IFRS from 2000 to 2003. More specifically, they found that the gap drops to zero (0) in 2003, which indicated vast progress in the process of harmonisation. Contrary to the findings in Chen et al. (1999), Chen et al. (2002) and Lin and Wang (2001), Hussain et al. (2008) found there was an almost similar number of companies reporting higher Chinese GAAP earnings (23/51) and those reporting higher IFRS earnings (25/51). The different findings could be attributed to the different data set; nevertheless, it indicated the effort to progressively harmonise the Chinese GAAP with the IFRS. However, since Hussain et al. (2008) presented the averaged frequency of overstatement/ understatement between the Chinese GAAP earnings and the IFRS earnings from 2000 to 2003, it was difficult to assess the changing pattern of frequency of overstatement/understatement between the two sets of accounting standards in each sample year.
Kuan and Noronha (2007) collected the 2004 financial data of thirty (30) companies which issued both A- and H-shares and carried out statistical analysis to investigate the progress of accounting harmonisation of the 2001 ASBE with the IFRS. Kuan and Noronha segregated the reporting figures in the financial statements, and focused on six (6) accounting items, namely sales revenue, operating income, income before tax, income after tax, assets, liabilities and equity. They found significant discrepancies only in operating income; no substantial gaps were found in the remaining five tested accounting items. Kuan and Noronha suggested that the accounting harmonisation of the Chinese GAAP with the IFRS had reached an acceptable level after the establishment of the 2001 ASBE which was implemented to improve the transparency and reliability of the reporting company’s financial information (Chen & Lin, 2000) and, to reduce the chances for earnings management (Chen & Cheng, 2007). There were new disclosure requirements under the 2001 ASBE (Deloitte, 2002). For example, the standards provided more details of basic principles with minimum disclosure of information. The standards also required enterprises to provide notes on financial statements as one of the major elements in interim and annual reports (Kuan & Noronha, 2007).
ASBE. The reasons identified for the changes in earnings quality were the lack of developed markets for fair value, and the incentives for earnings management under the new standards.
According to Baker and Moore (2008), there were two (2) main obstacles to align the Chinese GAAP with the IFRS, namely the concept of related parties and the adoption of the fair value method due to the cultural background of China. Baker and Moore also suggested that the lack of accounting professionals in China impeded the progress of the convergence between the Chinese GAAP and the IFRS. Following Norton (2008), Baker and Moore suggested that centralised ownership, short operating history of the market economy, and multiple ownerships in company structure were also factors slowing down the convergence progress. The discussion of the establishment of the 2006 ASBE in Bouvier (2007) and Pacter (2007), found that the new thirty eight (38) specific standards contained in the 2006 ASBE were very similar to the international structure of the IFRS (Bouvier, 2007), but the two sets of accounting standards were still not identical to each other (Pacter, 2007). Nevertheless, none of the above mentioned studies quantified the impacts of the 2006 ASBE on the reported figures.
difference in sales revenue, income before and after tax, assets, liabilities and equity.
These studies examined the harmonisation of the Chinese GAAP and the IFRS by comparing the differences in the reported figures between the Chinese GAAP reports and the IFRS based reports issued between 1992 to 2001. Based on the findings of these studies, it is clear that there was substantial improvement in the harmonisation between the Chinese GAAP and the IFRS in recent years. Subsequent studies by Baker and Moore (2008), Bouvier (2007), and Pacter (2007) have qualitatively compared the standards and measurement requirements contained in the 2006 ASBE against the IFRS. Unfortunately, they did not empirically examine the quantitative impacts of the 2006 ASBE on the reported figures. Although He et al. (2009) conducted an empirical study, their analysis was limited only to the earnings quality reported under both the IFRS and the Chinese GAAP.
Thus, the purpose of this research is to extend the study of He et al. (2009) and report on the progress of accounting convergence of the Chinese GAAP with the IFRS upon the implementation of the 2006 ASBE. This study compares the 2007 accounts of selected Chinese companies (based on the ASBE 2006) with their 2006 accounts (based on the ASBE 2001). The 2006 ASBE covers one (1) basic standard, sixteen (16) revised standards and also twenty two (22) newly issued standards. According to Ernst and Young (2006), the one (1) basic and thirty eight (38) specific standards were implemented to further align the Chinese GAAP with the IFRS.
Peng and Bewley (2010) used qualitative data (official statements, academic materials, media and standards) to examine the changes in fair value accounting in China and showed that China had tried to introduce fair value accounting in the 1997 to 2000 period. However, due to abuses, this method was suspended from 2001 to 2006, and was reinstated only when the 2006 ASBE was implemented. Apart from discussing the changes in fair value accounting, Peng and Bewley also discussed the gap between the standards of the IFRS and Chinese GAAP as an adoption gap, and the different choices made when preparing the accounts as an implementation gap (or practices gap). Peng and Bewley raised the issue whether convergence with the IFRS leads to convergence in practice. However, they did not examine this practices gap empirically which is the aim of this study.
countries in the region that are converging their national accounting standards to the IFRS are Malaysia by January 2012 and Singapore by 2012. China has an increasing impact in many countries and the manner China is adopting and implementing IFRS should be a concern to both academics and practitioners in these countries.
3. Research method
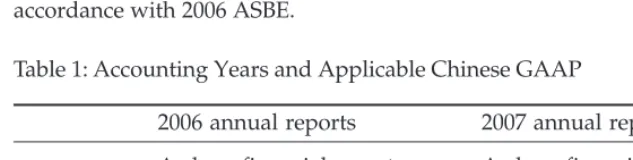
This study analysed the financial accounts of forty seven (47) Chinese companies that had both A-shares (local owned) and H-shares (foreign owned shares listed on the Hong Kong Stock Exchange). Such companies were required to prepare two sets of accounts under the Chinese GAAP and under either the IFRS or the Hong Kong Financial Reporting Standards (HKFRS). The companies were also required to restate the financial data in accordance with either the IFRS or the HKFRS. In 2005, the HKFRS was fully converged with the IFRS. As a result, the comparison of the financial data in the companies’ reports for the years 2006 and 2007 would provide insights into the convergence process between the Chinese GAAP and the IFRS. Furthermore, the financial data for the years 2006 and 2007 were chosen because the 2006 ABSE came into effect from 1 January 2007. The 2006 A-share financial reports were prepared in accordance with the 2001 ASBE, while the 2007 A-share financial reports were prepared in accordance with 2006 ASBE.
Table 1: Accounting Years and Applicable Chinese GAAP
2006 annual reports 2007 annual reports
Standard A-share financial reports A-share financial reports
2001 ASBE 2006 ASBE
Standard H-share financial reports H-share financial reports
IFRS IFRS
3.1 Data collection
H-share reports and A-H-share reports in 2006 and 2007, while two (2) companies provided only H-share reports for 2006 and 2007. Nevertheless, since most of the listed companies provided reconciled statements for the differences of reporting figures under the IFRS/HKFRS and the Chinese GAAP in both 2006 and 2007, the financial data of the two companies was obtained from their respective reconciled statements of the 2006 and 2007 H-share reports.
In addition, five (5) companies provided their H-share reports and A-share reports in 2007, but only their H-A-share reports in 2006 with no reconciled statements. In other words, no 2006 A-share reports could be obtained for these five (5) companies. Nevertheless, the 2006 ASBE standards required the provision of restated statements if the company had made changes in accounting policies or estimates after the adoption of the 2006 ASBE. Thus, for these five (5) companies which did not make available their 2006 A-share reports, the reported figures could be calculated from the 2006 reported figures in the restated statements provided in the 2007 A-share reports. However, it should be noted that nine (9) companies were excluded from the research due to missing A-share reports, or lack of reconciled or restated statements. As a result, of the fifty six (56) Chinese companies which issued both H-shares and A-shares, financial data of only forty seven (47) companies was collected for this research.
3.2 Data analysis
Kuan and Noronha (2007), using the formula developed by Chen et al. (2002) measured the differences of reporting figures between the IFRS and the Chinese GAAP. We adapted the formula to analyse the differences between the 2006 and 2007 net profit and total equity figures reported by the forty seven (47) sample companies under the IFRS and the Chinese GAAP. Our formula is as follows:
Formula 1
(2) sets of accounting standards. Moreover, when the result showed a value zero (0), this also indicated two possible situations; in the first possible situation, there was no gap in the reporting figures under the two (2) sets of accounting standards for both 2006 and 2007. Another possible situation was that the amount of gap in 2006 exactly equaled the amount of gap in 2007; however, this would be a rare situation. Thus, it is important to find the significance of the gap.
The significance of the gap was tested using paired sample t-tests. The t-test would indicate whether there was a significant difference between the two (2) sample means, and would also test whether the difference between the means occurred by chance (Bryman and Bell, 2007)2. A paired
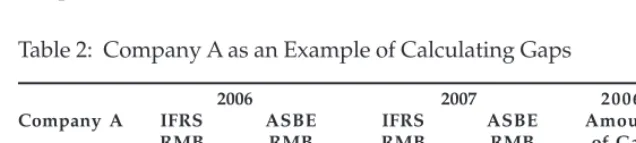
sample t-test would test within-subject data with two (2) or more sets of data collected from the same group under different conditions (Bryman and Bell, 2007). Table 2 illustrates how the gaps were calculated, with Table 3 showing the six (6) pairs of figures that were tested with paired sample t-tests.
2 In this study, the paired sample t-test was used to test whether the net profit and total
equity figures reported under the Chinese GAAP were significantly different from the figures reported under the IFRS.
Table 2: Company A as an Example of Calculating Gaps
2006 2007 2006 2007
Company A IFRS ASBE IFRS ASBE Amount
RMB RMB RMB RMB of Gap
(million) (million) (million) (million) (million) Net Profit 100 (a) 120 (b) 110 (c) 150 (d) 20 (i) 40 (j) Total Equity 200 (e) 240 (f) 220 (g) 300 (h) 40 (k) 80 (l)
Table 3: Company A, showing the six pairs of figures tested with paired sample t-tests
Comparing
Pair 1 100 (a) 120 (b)
Pair 2 110 (c) 150 (d)
Pair 3 020 (i) 040 (j)
Pair 4 200 (e) 240 (f)
Pair 5 220 (g) 300 (h)
For the interpretation of the six (6) pairs of figures, the pairs with less than 5 per cent two-tailed significance indicated that the reported figures in the net profit or total equity under the IFRS were significantly different from that under the Chinese GAAP (the difference could only have occurred by chance less than 5 per cent of the time). It also possibly indicated that further improvements were required to converge the Chinese GAAP with the IFRS.
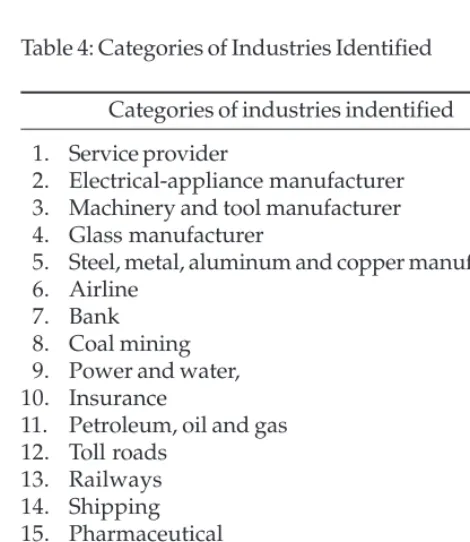
The methods used for analysis by industry were similar to the methods described above. For industries, the focus was on the relationship between the industries and the discrepancies in reporting. The forty seven (47) sample companies were separated into twenty (20) different categories of industries to find the industries with the most significant differences in net profit and total equity under the two sets of accounting standards. The twenty (20) categories of industries identified from the forty seven (47) sample companies are found in Table 4.
Table 4: Categories of Industries Identified
Categories of industries indentified
01. Service provider
02. Electrical-appliance manufacturer 03. Machinery and tool manufacturer 04. Glass manufacturer
05. Steel, metal, aluminum and copper manufacturer 06. Airline
07. Bank 08. Coal mining 09. Power and water, 10. Insurance
11. Petroleum, oil and gas 12. Toll roads
13. Railways 14. Shipping 15. Pharmaceutical 16. Cement
17. Brewing 18. Shipyard
These categories of industries were identified through the analysis of the accounts of the companies. The industries with the greatest discrepancies in reporting under the two sets of accounting standards in 2006 and 2007 were then identified. The method was used to narrow the analysis so that in-depth analysis needed to be carried out on fewer companies. Using the greatest discrepancy method would ensure that there would be discrepancies that could be analysed. These pairs enabled the industries with the highest discrepancies in reporting under the IFRS and the Chinese GAAP to be further analysed using qualitative method. These companies were first analysed for their industry practices.3 This is to
identify the discrepancies in the accounts that were not caused by industry practices.
4. Findings
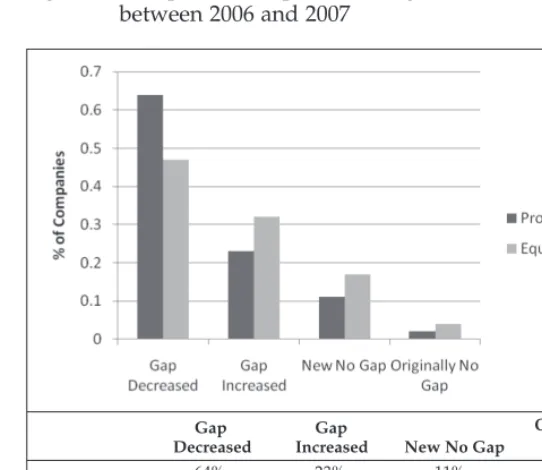
Figure 1 displays a bar graph of the comparison of specific changes in profit and equity figures between 2006 and 2007. Figure 1 suggests that there were fewer changes in total equity gap under the IFRS and the Chinese GAAP during the period, compared to that in the net profit gap. This is possibly due to the fact that the changes in the net profit gap were more significant than the change in the total equity gap as reported under the IFRS and the Chinese GAAP. Sixty four per cent of the companies showed a reduced net profit gap between the IFRS and the Chinese GAAP from 2006 to 2007; however only 47 per cent of the companies showed a reduced total equity gap. By contrast, more companies showed an increased gap in reported total equity (32 per cent) under the IFRS and the Chinese GAAP between 2006 and 2007 than the number of companies that showed an increased gap in the reported net profit (23 per cent). As a result, it was difficult to draw a conclusion on the success of the new 2006 Chinese GAAP in the accounting convergence with the IFRS, and further analysis was required. Therefore, t-test was performed on the same data to examine the significance of the differences between the net profit and equity under the IFRS and the Chinese GAAP between 2006 and 2007.
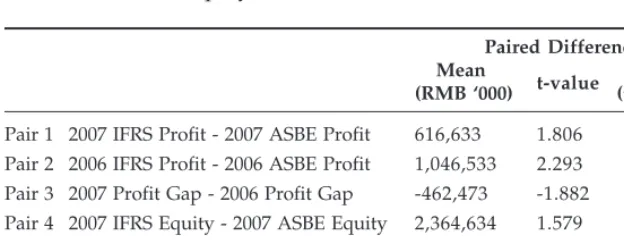
The findings of the paired t-tests are presented in Table 5. Six (6) pairs were tested. Pair 1 tested the significance level of the difference between the amount of net profit reported under the IFRS and the Chinese GAAP in 2007. Pair 2 tested the net profit results reported in 2006 between the two (2) standards. Pair 3 also tested the significance level of the net profit results,
3 The analysis of the industry practices of the sample companies is not within the scope
Figure 1: Comparison of Specific Changes in Profit and Equity between 2006 and 2007
but compared the changes in net profit gap between 2006 and 2007. Similarly, Pair 4 tested the significance level of the differences between the amount of total equity reported under the IFRS and the Chinese GAAP in 2007. Pair 5 tested the total equity results in 2006 between the two (2) standards. Finally, Pair 6 examined the significance level of the gap between the total equity reported in 2006 and 2007.
The aim of the analysis was to find the pairs with less than 5 per cent two-tailed significance. As shown in Table 5, of the six (6) pairs analysed, only two (2) showed a statistically significant difference. Pair 2 (with 2.6 per cent two-tailed significance) showed a significant difference between the amount of net profit reported under the IFRS and the Chinese GAAP in 2006. Pair 5 (with 4.2 per cent of two-tailed significance) showed a significant difference between the total equity reported under the IFRS and the Chinese GAAP in 2006.
with the findings for the net profit and total equity in 2006 were not significant. Indeed, the gaps in the accounting item total equity, reported under the IFRS and the Chinese GAAP in both 2006 and 2007 were frequently smaller than the gaps in the net profit. With regard to the changes in the net profit and total equity gaps under the IFRS and the Chinese GAAP as tested by Pair 3 and Pair 4, the differences were relatively small. An increased number of companies showed no gap in the net profit and total equity after adopting the 2006 ASBE, with 11 per cent (5/47) and 17 per cent (8/47) companies showing no gap in the net profit and total equity respectively. In addition, based on the average reported amounts in 2006 and 2007, the results showed the gaps in net profit and total equity changed from significantly different under the IFRS and the Chinese GAAP in 2006, to a non-significant gap in 2007.
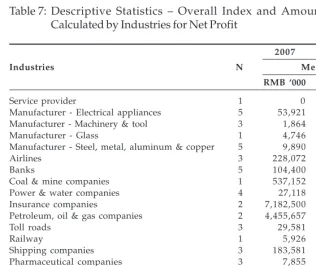
The gap between net profit and equity was calculated for the twenty (20) categories of industries and then examined. There was evidence that companies in the industries of property leasing and development, coal-mining, insurance, and petroleum, oil and gas refiners had relatively large discrepancies in their net profit and total equity reported under the IFRS and the Chinese GAAP. Descriptive results and t-tests are shown in Tables 6 and 7. These results indicated the relationship between type of industry and net profit gap, reported under the two (2) sets of standards, was much higher in 2006 than in 2007. More industries showed fully or almost fully comparable net profit figures between the IFRS and the Chinese GAAP in 2007 than in 2006.
The companies within each of the industries which had large discrepancies were as follows:
Table 5: Paired Samples T-Test – Significance of Differences in Net Profit and Total Equity
Paired Differences Mean
Table 6: Paired Samples T-Test: Significance of the Relationship between Industry and Gaps
Paired Differences
Mean t-value Sig. (two-tailed) Pair 1 Industry - 2007 Profit Gap -654,231 -1.925 0.06 Pair 2 Industry - 2006 Profit Gap -1,116,703 -2.467 0.017 Pair 3 Industry - 2007 Equity Gap -2,725,991 -1.836 0.073 Pair 4 Industry - 2006 Equity Gap -3,975,046 -2.397 0.021 Pair 5 Industry - Change in profit gap -572,235 -2.378 0.022
between 2006 & 2007
Pair 6 Industry - Change in equity gap -1,548,806 -2.473 0.017 between 2006 & 2007
Table 7: Descriptive Statistics – Overall Index and Amount of Gap Calculated by Industries for Net Profit
2007 2006
Industries N Mean
RMB ‘000 RMB ‘000
Service provider 1 0 2,568
Manufacturer - Electrical appliances 5 53,921 8,701
Manufacturer - Machinery & tool 3 1,864 13,596
Manufacturer - Glass 1 4,746 304,491
Manufacturer - Steel, metal, aluminum & copper 5 9,890 316,185
Airlines 3 228,072 368,995
Banks 5 104,400 2,446,400
Coal & mine companies 1 537,152 623,644
Power & water companies 4 27,118 616,117
Insurance companies 2 7,182,500 6,103,654
Petroleum, oil & gas companies 2 4,455,657 6,897,852
Toll roads 3 29,581 82,766
Railway 1 5,926 60,645
Shipping companies 3 183,581 254,180
Pharmaceutical companies 3 7,855 4,658
Cement 1 14,073 54,864
Brewing 1 19,231 12,970
Shipyard 1 2,097 -26,982
Property leasing & development 1 135,022 60,100
Chemical fibre 1 4,495 3,468
o Insurance: China Life Insurance Company Limited (the “China Life Insurance”) and Ping An Insurance (Group) Company of China Limited (the “Ping An Insurance”).
o Coal - mining: Yanzhou Coal Mining Company (“Yanzhou Coal Mining”).
o Petroleum oil and gas: China Petroleum and Chemical Corporation (“China Petroleum”), and PetroChina Company Limited (“PetroChina”).
o Property leasing and development: Beijing North Star Company Limited (Beijing North Star).
These companies were qualitatively analysed to find the cause of the discrepancies between the accounts reported under the Chinese GAAP and the IFRS. The industry-related discrepancies were first reviewed, followed by the analysis on the differences that affected all the accounts. The industry-related discrepancies for the insurance industry, and the petroleum, oil and gas industry are discussed below. Similar to Van de Tas (1992) and Luther (1996), this research found that insurance companies, and the petroleum, oil and gas refiners showed a number of discrepancies specifically related to their industries. For example, the accounting treatments of policy acquisition costs, policyholders’ reserves for life insurance, unearned premium reserves and claim reserves that specifically relate to insurance companies required adjustment in reporting under the IFRS and the Chinese GAAP. However, of the four (4) adjusted items in the insurance industry, only two (2) items, namely the adjustment on policy acquisition cost and claim reserves, account for the actual differences caused by the different accounting treatments required by the two (2) sets of accounting standards. In contrast, the adjustments made on policyholders’ reserves and unearned premium reserves were caused by the specific requirements (prudential regulations) imposed by the non-accounting regulations established by the Chinese Ministry of Finance.
Another non-accounting regulation that might have caused dissimilar reporting figures under the IFRS and the Chinese GAAP relates to safety funds. Safety expenditures were required by businesses engaged in petroleum refining, coal mining or other activities involving the production of dangerous products. These safety expenses caused discrepancies under the IFRS and the Chinese GAAP as they were treated differently under each standard. Under Chinese regulation “Caijian [2004] #119 – Method
coal-mining activities should incur the safety expenses based on the unit of production of coal volume with the purpose of improving safety standards and the maintenance of coal production machinery. The provision for safety expense would be credited to the long-term payables and the provision would be reduced when the expenditure actually occured. However, it would originally be recorded as a safety expense in the accounts. However, according to IFRS, these expenses are regarded as period expenses that would only be recognised when they actually occured and did not fit the recognition of provisions according to IAS 37. Therefore, there were discrepancies in the profit and equity as a result of safety expenses.
In addition, the method used for depreciating oil and gas properties might be a major concern for petroleum, oil and gas refiners. The unit-of-production method was introduced for oil and gas properties depreciation under the new Chinese GAAP (2006 ASBE), which was consistent with the IFRS. However, companies were given the option to either use a straight-line or unit-of-production method for depreciating oil and gas properties under the Chinese GAAP. Similarly, options were also provided for the depreciation of fixed assets, revaluation of investment properties and land-use rights categorised as investments, which could also caland-use discrepancies in the reporting figures under the IFRS and Chinese GAAP. If the companies chose different depreciation methods under the two sets of standards, there would be discrepancies in their accounts.
On the other hand, efforts could be seen in the changes made in relation to the treatment of pre-operating expenditure, gains on debt restructuring, government grants, treatment of financial instruments and business combinations involving companies which were not under common control. The changes in the accounting treatments of these items were generally consistent with the IFRS and further showed the move towards the convergence between the IFRS and the Chinese GAAP.
4.1 Adjustment on financial assets and liabilities
Three (3) companies were found to have common items contributing to the discrepancies under the IFRS and the Chinese GAAP, which required adjustments to be made to their financial assets and liabilities. These companies were Beijing North Star, Ping An Insurance, and China Life Insurance. Under the 2006 ASBE (applicable to the 2007 year accounts), ASBE No. 22 – “Financial Instruments: Recognition and Measurement” was introduced to cover the recognition, measurement and disclosure of accounting requirements for financial assets and liabilities. Generally, the requirements relating to the financial assets and liabilities under the Chinese GAAP were similar and consistent with the standards under the IFRS. The most significant change related to the use of fair value measurement for the initial measurement of financial instruments and the newly introduced types of financial assets (held-to-maturity profits and loss, available-for-sale investments, financial assets measured at fair value in profit and loss, loans and receivables) and financial liabilities (financial liabilities measured at fair value in profit and loss and other financial liabilities measured at amortised cost using the effective interest method). In other words, the Chinese GAAP requirements for the treatment of financial instruments were generally consistent with the IFRS. As a result, this reduced the discrepancies of RMB 15,393 million4 in net profit for
China Life Insurance (see Table 8); RMB 3,096 million in net profit (see Table 9) and RMB 16,935 million in equity for Ping An Insurance (see Table 10); while there was a reduction in discrepancies amounting to RMB 3 million for both net profit (see Table 11) and equity (see Table 12) for Beijing North Star.
4.2 Adjustment on business combination
Three (3) companies, Yanzhou Coal Mining, China Petroleum and Beijing
North Star, had made adjustments in their accounts pertaining to business
combination. China Petroleum made adjustments in their 2006 original reconciled statement in relation to the goodwill arising from long-term equity investments acquired through business combination involving companies which were not under common control. However, no similar adjustment was made in the 2006 restated figures, which might indicate the changes made in the new Chinese GAAP.
Under the old Chinese GAAP (2001 ASBE), the standards only permitted the assets, liabilities and contingent liabilities purchased by the
Table 8: China Life Insurance Company Limited – Profit Adjustments
2007 2006 2006
Restated Original RMB (million)
Net profit reported under Chinese GAAP 28,116 14,384 9,601 Adjusted items:
Policy acquisition costs 4,019 5,653 5,653
Policyholders’ reserves for life insurance 6,366 2,489 (5,803)
Unearned premium reserves 101 8 1 8 1
Claim reserves – – 262
Financial assets & liabilities – – 15,393
Revaluation & depreciation of fixed assets 112 9 3 9 3
Others – – (3)
Deferred tax 165 (2,744) (5,321)
Net profit reported under HKFRS 38,879 19,956 19,956
Table 9: Ping An Insurance (Group) Company of China Limited – Profit Adjustments
2007 2006 2006
Restated Original RMB (million)
Net profit reported under Chinese GAAP 15,086 7,342 5,986 Adjusted items:
Policy acquisition costs 9,373 5,480 5,480
Policyholders’ reserves for life insurance (4,988) (4,723) (6,544)
Unearned premium reserves 113 (16) (16)
Claim reserves – – 149
Financial assets & liabilities – – 3,096
Others (13) (33) 100
Deferred tax (883) (212) (413)
Table 10: Ping An Insurance (Group) Company of China Limited – Equity Adjustments
2007 2006 2006
Restated Original RMB (million)
Total equity reported under Chinese GAAP 107,234 45,260 36,668 Adjusted items:
Policy acquisition costs 41,305 31,866 31,866
Policyholders’ reserves for life insurance (35,262) (30,023) (35,762)
Unearned premium reserves 199 8 6 8 6
Claim reserves – – (1,401)
Financial assets & liabilities – – 16,935
Others (107) (127) (177)
Deferred tax (1,547) (687) (1,840)
Total equity reported under IFRS 111,822 46,375 46,375
Table 11: Beijing North Star Company Limited – Profit Adjustments
2007 2006 2006
Restated Original RMB (million)
Net profit reported under Chinese GAAP 328 339 335 Adjusted items:
Revaluation of investment property 11 3 2 3 2
Depreciation of investment properties 3 5 3 8 3 8
Revaluation of fixed assets 2 6 6
Land-use rights (60) (19) (19)
Business combination (3) -
-Financial assets & liabilities - - 3
Effect of change in tax rate 151 -
-Other (1) (1)
Table 12: Beijing North Star Company Limited – Profit Adjustments
2007 2006 2006
Restated Original RMB (million)
Total equity reported under Chinese GAAP 8,232 8,040 8,045 Adjusted items:
Revaluation of investment property 668 656 656
Depreciation of investment properties 551 516 516
Revaluation of fixed assets (282) (284) (284)
Land-use rights (92) (32) (32)
Financial assets & liabilities – – (3)
Effect of change in tax rate 151 – –
Other – 2 –
Total equity reported under HKFRS 9,228 8,898 8,898
investor from the investee to be measured at the carrying amount showed in the investee’s book, with any excess of the cost of investment to be recognised as goodwill and subjected to amortisation. However, in a situation where the cost of investment was less than the carrying amount of the investee’s net identifiable assets, negative goodwill was recognised and should be credited to the income statement.
In contrast to the old Chinese GAAP, the new ASBE 20 of the new Chinese GAAP (2006 ASBE) – “Business Combination” required companies to adopt the fair value model for the measurement of the investee’s assets, liabilities and contingent liabilities purchased by the investor at the combination date. ASBE 20.4 further required the differences between the costs of business combination and the interests purchased by the investor over the investee’s net identifiable assets to be recognised as goodwill, which was subject to impairment tests at least once a year, or if there was negative goodwill, it was recognised in the income statement. These treatments were generally consistent with the IFRS 3 – “Business
Combination”.
adjustment of RMB 1,010 million in net profit (see Table 13) and RMB 27,406 million in total equity (see Table 14) that arose from the different accounting policies under the IFRS and the old Chinese GAAP for long-term equity investments acquired through business combinations involving companies not under common control. Furthermore, since the new ASBE 20.4 was generally consistent with the IFRS 3 on this particular issue, there was no similar adjustment made in the 2006 restated amount in the 2007 reconciled statement for China Petroleum.
Table 13: China Petroleum and Chemical Corporation – Profit Adjustments
2007 2006 2006
Restated Original RMB (million)
Net profit reported under Chinese GAAP 57,153 52,983 50,664 Adjusted items:
Depreciation of oil & gas properties 523 2,478 2,478
Land-use rights 3 0 3 0 3 0
Business combination - - 1,010
Pre-operating expenditure - - 703
Gain on Debt restructuring - - 486
Government grants - - 1 2
Deferred tax 1,037 (453) (345)
Net profit reported under IFRS 58,743 55,038 55,038
Table 14: China Petroleum and Chemical Corporation – Equity Adjustments
2007 2006 2006
Restated Original RMB (million)
Total equity reported under Chinese GAAP 326,347 281,799 254,875 Adjusted items:
Depreciation of oil & gas properties 11,339 10,816 10,816
Land use rights (1,042) (1,072) (1,072)
Business combination - - 27,406
Pre-operating expenditure - - (64)
Government grants - - 576
Nevertheless, differences still existed between the IFRS and the new ASBE 20 for Yangzhou Coal Mining and Beijing North Star in the measurement of long-term equity investment purchased through business combination involving companies under common control. Under the IFRS, assets and liabilities purchased by the company during business combination were measured at the fair value of the identifiable assets and liabilities at the date of acquisition regardless of whether the business combination involved companies under common control or not, with the excess of purchasing consideration paid recognised as goodwill.
However, under the ASBE 20 of the Chinese GAAP, assets and liabilities purchased by the company in business combination involving companies under common control were measured at the carrying amount at the date of combination. The excess carrying value of purchase consideration paid by the company, over its share of carrying value of identifiable net assets for business combination that involved companies under common control, reduced the share premium of capital reserve or retained earnings. As a result, there were differences between the two standards for business combination that involved companies under common control. The differences are highlighted in Table 15. Further, Baker and Moore (2008) also identified the concept of related parties as causing a difference between the IFRS and the Chinese GAAP.
Table 15: Yanzhou Coal Mining Company Limited – Profit and Equity Adjustments
Net Profit Total Equity
RMB (million)
Figures reported under Chinese GAAP 2,693 19,616
Adjusted items:
Wei Jian Fei & work safety expense 343 1,001
Reform & specific expense funds 164 612
Business combination (6) 417
Deferred tax 33 (232)
Other 3 4
4.3 Adjustment on revaluation of fixed assets
Two (2) companies, Beijing North Star Company and PetroChina, made adjustments in relation to the revaluation and depreciation of fixed assets. The Chinese GAAP relating to fixed assets were set out in ASBE 4 – “Fixed
Assets”. These issues also affected the adjustment on the revaluation and
depreciation of investment properties. Changes made in ASBE 4 from the old Chinese GAAP (2001 ASBE) were more likely to be the changes to a more detailed description and explanation of applying the standards, rather than changes in the measurement method of fixed assets.
Under the Chinese GAAP, only the cost model was allowed for the subsequent measurement of fixed assets, while the IFRS permitted both the revaluation and cost models. This caused differences in the amount of fixed assets recorded under the two (2) sets of accounting standards. As a result, for the fixed assets carried at the cost model under the Chinese GAAP but revalued under the IFRS, there were differences of RMB 2 million in profit (see Table 11) and RMB 282 million in equity (see Table 12) for Beijing North Star, while PetroChina incurred differences of RMB 457 million in net profit (see Table 16) and RMB 409 million in total equity (see Table 17).
Table 16: PetroChina Company Limited – Profit Adjustments
2007 2006
Restated
RMB (million)
Net profit reported under Chinese GAAP 143,494 142,747
Adjusted items:
Depreciation of oil & gas properties 7,625 9,284
Revaluation of fixed assets 457 81
Impairment of loss – 4
Disposal difference due to impairment loss (142) –
Safety funds 3,559 –
Other 57 14
Deferred tax 179 (2,733)
Table 17: PetroChina Company Limited – Equity Adjustments
2007 2006
Restated
RMB (million)
Total equity reported under Chinese GAAP 715,071 567,595
Adjusted items:
Depreciation of oil & gas properties 79,325 71,700
Revaluation of fixed assets (409) (866)
Impairment of loss & the resulted disposal difference 92 234
Safety funds 3,559 –
Other (135) 263
Deferred tax (21,156) (21,335)
Total equity reported under IFRS 776,347 617,591
4.4 Adjustment on land-use-rights
Two (2) companies, China Petroleum and Beijing North Star Company, made adjustments in relation to land-use rights. Adjustments in relation to land use rights were frequent occurrence due to the unique environment in China. The Chinese government owns all land in China, and therefore, there is no private ownership of lands. As a result, businesses and individuals lease lands from the Chinese government for a maximum period of 75 years.
The new Chinese GAAP (2006 ASBE) had two (2) standards on the recognition and measurement of land-use rights. The ASBE 6 – “Intangible
Assets” covered the land-use right acquired for business or individual
private use, while ASBE 3 – “Investment Properties” applied to the land-use right for the sale or rental of investment properties.
date, until the disposal of properties. In other words, neither amortisation nor impairment of land-use rights was required under the IFRS. As a result, the land-use rights held by China Petroleum and Beijing North Star determined by fair value under the IFRS but measured by the cost model under the Chinese GAAP in both 2006 and 2007, caused a significant difference of RMB 30 million in net profit and RMB 1,042 million in equity for China Petroleum (see Tables 13 and 14 respectively). Beijing North Star incurred differences of RMB 60 million in net profit and RMB 92 million in total equity (see Tables 11 and 12 respectively).
Fifteen (15) out of forty seven (47) companies showed land use rights adjustments. Given the unique features of land use rights in China, this discrepancy should not be taken as empirical evidence of the implementation gap of the IFRS. As discussed above, the Chinese government owns all land in China. The right to land use, which is in the form of a lease, is obtained directly from the government. The lessor who obtained the land use rights from the government, could effect different types of transactions pertaining to the rights. For example, he could sell or transfer the rights. Some companies did not make land rights adjustments because of the different kinds of land use rights in China. It appears that the companies who made land use right adjustments in their financial accounts are the companies who directly obtained the land use rights from the government. Other companies who leased the land use rights from other land use right holders did not show it as land use rights that were individually identifiable in their accounts. Appendix 1 lists the companies in the sample, the official stock exchange company code for each company, its operation description and whether or not land use rights could be identified.
5. Discussion
examination of the differences between the new Chinese GAAP of 2006 ASBE and the IFRS indicated the adoption gap was a lot less than that which existed under previous standards. Peng and Bewley (2009) also found that the greatest divergence was in fair value accounting rules. Therefore, the implementation gap resulting from the different choices made when preparing the accounts should be examined.
The next research objective was to identify the major items that contributed to the differences in net profit and total equity figures reported under the IFRS and the Chinese GAAP. There were two parts to this analysis. We first analysed the discrepancies in terms of rules in the IFRS and the Chinese GAAP (also called de jure harmonisation), and then analysed the extent of implementation of these rules (also called de facto harmonisation). In other words, we first studied the adoption of the IFRS, i.e. whether the Chinese GAAP was the same as the IFRS; and then analysed its implementation, i.e. if given an option, which option was chosen by the companies.
Then again, as some of the accounting discrepancies in the companies’ accounts might be due to the practices peculiar to their industries, and also the features of industry based standards, we next analysed the four (4) industries that showed either the largest amount of discrepancies under the IFRS and the Chinese GAAP or the lowest non-comparable figures under the two sets of accounting standards. However, it was found that general items contributed to the discrepancies regardless of industry. The main items causing the differences were the financial assets and liabilities, revaluation and depreciation of fixed assets, business combinations and land-use rights. This study found that though the requirements under the Chinese GAAP and the IFRS were similar, different options were chosen when implementing the Chinese GAAP and the IFRS. These were discussed in section 4 above.
Business combinations: The requirements under the Chinese GAAP and the IFRS were quite similar. Even though the new ASBE 20 introduced fair value measurement and prohibited the amortisation of goodwill, there were differences in the treatment of assets and liabilities for business combination which involved companies under common control. This issue of related parties was identified in the past literature (Baker and Moore, 2008).
Adjustment on Revaluation of Fixed Assets: The cost method was used under the Chinese GAAP, whereas under the IFRS, either the cost or revaluation method could be used. This resulted in discrepancies if a company used the cost method under Chinese GAAP and the revaluation method under IFRS.
Adjustment on Land-use-rights: ASBE 3 required the land-use rights to be measured by a cost model and subjected to amortisation, unless the fair value of the land-use rights could be obtained. However, both the cost model and the revaluation model were permitted under the IFRS, Discrepancies arose if a company used fair value under IFRS but a cost method under Chinese GAAP.
The reasons for the differing choices, some of which discussed in the literature, were not evident from an analysis of the companies’ accounts. Baker and Moore (2008) had commented on the concept of related party, and the use of the fair value method due to the cultural background of China and the lack of accounting professionals. This is a worthwhile area for future research. Peng and Bewley (2010) discussed reasons for lack of fair value such as underdeveloped capital markets, the language customised to Chinese, earnings management, corporate governance problems, shortage of skilled auditors and accountants, ethics of auditors and accountants, limited tools and guidance to assess fair values, enforcement by the legal system, managers with political patronage to shield them, regulators who are not independent of the state, and insufficient resources for enforcement.
independent of the state, and insufficient resources for enforcement. Other possible reasons for the non-adoption were the historical abuse and subsequent re-adoption of fair value, and Chinese conservatism in the Chinese GAAP accounts.
6. Conclusion
Based on this study, it can be seen that China has made great improvements to align its accounting standards with the IFRS. However, discrepancies still exist between a company’s two (2) sets of accounts prepared under the Chinese GAAP and the IFRS respectively due to its implementation policies. As a result, users of financial reports should exercise caution when analysing the listed Chinese companies’ financial reports. This study used financial data collected from forty seven (47) Chinese-listed companies that have issued both H- and A-shares. These companies were required to provide reconciled statements for the reported differences between the Chinese GAAP and the IFRS which might increase incentives for management to reduce the reporting gaps between the two (2) sets of accounting standards, or simply reduce the gaps through the appointment of international auditors. Furthermore, due to limited sample size for examination, there might be other items which contributed to the differences under the two (2) sets of standards that were not analysed in this study.
Options provided under the accounting standards allowed companies to choose the method of measurement that best reflected their nature of operations. The company could chose the same method for its accounts under the Chinese GAAP and under the IFRS, but this did not occur in many of the companies studied here. Standard setters justified this divergence as characteristic of the Chinese environment. Identifying the reasons for the differing choices by the companies in China when preparing their accounts under the Chinese GAAP and the IFRS is a potential area of research.
government, which may create strong incentives for management to manipulate an entity’s operating results.
The statement by the Chinese Ministry of Finance and the International Accounting Standards Board (IASB) that “a company applying Chinese Accounting Standards should produce financial statements that are the same as those of a company that applies IFRS” (IASB, 2006, pg 1) would not, in fact, be achievable. Therefore as Archer et al. (1995), Chen and Cheng (2007), Emenyonu and Gray (1992) and Evans and Taylor (1982) discuss, and as shown in the current study, convergence of accounting standards does not always lead to the convergence of accounting practices. Issues of culture and practice need further in-depth study.
There is a prior study on the challenges and successes in the implementation of the IFRS and in achieving convergence (IFAC, 2006). According to IFAC (2006), additional emphasis and training need to be undertaken so all stakeholders understand the meaning of convergence, that convergence is not just the standards are the same but getting the same results under both standards. To focus on the implementation gap, additional disclosures may be provided by a company outlining the differences between the IFRS and the local GAAP, and an explanation of these differences for transparency. These differences and these reasons can then be commented on by the auditors as well as monitored over time by policy makers who are promoting convergence. This study supports these recommendations.
References
Archer, S., Delvaille, P., & McLeay, S. (1995). The measurement of harmonisation and the comparability of financial statement items: Within-country and between-country effects. Accounting and Business
Research, 36, 5-27.
Baker, C. A., & Moore, W. B. (2008). Chinese accounting: The new revolution.
The Journal of 21st Century Accounting, 8(1), 1-6.
Bouvier, S. (2007). China’s finance ministry describes goals of IFRS convergence effort. Accounting Policy & Practice, 3(21), 930-932. Bryman, A., & Bell, E. (2007). Business research methods (2nd ed.). Oxford,
UK: Oxford University Press.
Chen, F., & Lin, Z. J. (2000). Asian financial crisis and accounting reforms in China. Managerial Finance, 26(5), 63-79.
Chen, J. J., & Cheng, P. (2007). Corporate governance and the harmonisation of Chinese accounting practices with IFRS practices. Corporate
Governance, 15(2), 284-293.
Chen, S., Sun, Z., & Wang, Y. (2002). Evidence from China on whether harmonized accounting standards harmonize accounting practices.
Accounting Horizons, 16(3), 183-197.
Deloitte (2002). China financial reporting update. Retrieved 10 October 2008, from http://www.iasplus.com/china/01_02-e.pdf
Emenyonu, E. N., & Gray, S. J. (1992). EC accounting harmonisation: An empirical study of measurement practices in France, Germany and the UK. Accounting and Business Research, 23(89), 49-58.
Ernst &Young. (2006). China boardroom briefing: New standards, new era. Special edition on the new Chinese accounting standards, no. 1. Retrieved 10 October 2008, from
http://www.shinnihon.or.jp/knowledge/global/China_ Boardroom_Briefing_PRC_new_accounting_stds_Eng.pdf
Evans, T. G., & Taylor, M. E. (1982). Bottom-line compliance with the IASC: A comparative analysis. The International Journal of Accounting, 18(1), 115-128.
He, X., Wong, T. J. & Young, D. (2009), “Challenges for implementation of fair value accounting in emerging markets: Evidence from IFRS adoption in China”, Working Paper, Shanghai University of Finance and Economics and The Chinese University of Hong Kong, Hong Kong.
Hussain, S., Jiang, R. H., & Liu, L. (2008). Accounting in China. Financial
Management, 50.
International Federation of Accountants (IASB) (2004). Challenges and successes in implementing International Standards: Issues relating to convergence to IFRSs and ISAs. Retrieved 27 April 2011, from www.ifac.org
International Accounting Standards Board (IASB) (2006), China affirms commitment to converge with IFRSs (IASB News: Announcements and Speeches 2006). Retrieved 15 February 2011, from www.iasb.org Kuan, I. C., & Noronha, C. (2007). The progress of accounting harmonization
in China. Managerial Auditing Journal, 22(6), 620-640.
Li, H. (2006). Framework and implementation of Chinese accounting standards system for business enterprises. Retrieved 26 January 2008, from
Lin, Z. J., & Wang, L. (2001). Financial disclosure and accounting harmonization: Cases of three listed companies in China. Managerial
Auditing Journal, 16(5), 263-273.
Luther, R. (1996). The development of accounting regulation in the extractive industries: An international review. The International Journal of
Accounting, 31(1), 67-93.
Nobes, C, & Parker, R. (2008). Comparative international accounting (10th
Ed.). UK: Prentice Hall.
Norton, L. P. (2008). Handcuffing shareholders. Barron’s, 88(4), 10-11. Pacter, P. (2007). An accounting revolution is brewing in China. Financial
Executive, 23(10), 14-17.
Peng, S. (2005). The harmonization of Chinese accounting standards with
international accounting standards: An empirical evaluation. Unpublished
Dissertation for the Degree of Doctor of Philosophy, Virginia Commonwealth University, Virginia.
Peng, S., & Bewley, K. (2010). Adapability to fair value accounting in an emerging economy: A case study of China’s IFRS convergence.
Accounting, Auditing & Accountability Journal, 28(8), 982-1011.
Peng, S., & Bewley, K. (2009, August 10). Adaptability of fair value accounting in China: Assessment of an emerging economy converging with IFRS. Paper presented at the 2009 Annual Meeting of the American Accounting Association (AAA), New York, USA.
Qin, R. S. (1989). From normative to empirical: A reform of accounting research method. Finance and Accounting Communications, 5, 20-35. Rahman, A., Perera, H., & Ganeshanandam, S. (1996). Measurement of
formal harmonisation accounting: an exploratory study. Accounting
and Business Research, 26(4), 325-339.
Van Der Tas, L. (1992). New European insurance accounting rules. European
Accounting Review, 1, 401-406.
Yu, M., & Zhang, W. X. (2007). On Chinese empirical accounting research.
Appendix 1: Land use rights
No. Code Operation Description Land useright?
1 753 Airline N
2 347 Steel Refining Y
3 914 Manufacture and sale of clinkers and cement products Y
4 995 Operation and management of the toll roads N
5 3988 Bank N
6 3328 Bank N
7 588 Property leasing, land and property development Y
8 187 Manufacture and sale of printing press and related
spare parts N
9 939 Bank N
1 0 670 Airline Y
11 2628 Insurance company N
1 2 3968 Bank N
1 3 386 Petroleum Y
1 4 1138 Shipping company Y
1 5 1055 Airline Y
1 6 1053 Iron and steel refining N
1 7 991 Power company N
1 8 1072 Manufacture and sale of main thermal power equipment N
1 9 525 Passenger and cargo transportation N
2 0 874 Manufacture of Chinese Patent Medicine N
2 1 177 Operation and management of the toll roads N
2 2 358 Smelting, protracting and refining of non-ferrous metal mine N
2 3 350 Manufacture and sale of textile machinery N
2 4 1108 Production and sales of float sheet glass Y
2 5 323 Manufacture and sale of iron and steel products N
2 6 553 Manufacture and sale of appliances Y
2 7 4 2 Power company N
No. Code Operation Description Land useright? 2 9 719 Developing, manufacturing, selling pharmaceuticals Y
3 0 300 Production and sale of machine tool N
3 1 548 Operation and management of the toll roads N
3 2 338 Processes crude oil into synthetic fibres, resins Y
3 3 1033 Production and sale of chemical fibre Y
3 4 1065 Sewage water processing, tap water supply N
3 5 168 Production and sale of beer products N
3 6 1171 Coal mining N
3 7 763 Production of remote control switch systems N
3 8 317 Design and construct handy-size oil tanker Y
3 9 921 Manufacture and sale of air conditioning N
4 0 1071 Generation of electricity and heat N
4 1 902 Generation and sale of electric power N
4 2 1398 Bank N
4 3 2600 Aluminium refining N
4 4 1919 Container shipping, dry bulk shipping, container terminal Y
4 5 2883 Providing oilfield services N
4 6 2866 Shipping company Y