Determination of Suitable Operating Conditions of
Fluid Catalytic Cracking Process by Application of
Artificial Neural Network and Firefly Algorithm
Zahedi Abghari, Sorood*
+Department of Upgrading Process, Division of Refinery Process Technology Development, Research Institute of Petroleum Industry (RIPI), Tehran, I.R. IRAN
Imani, Ali
Department of Chemical Engineering, MahshahrBranch, Islamic Azad University. Mahshahr, I.R. IRAN
ABSTRACT:Fluid Catalytic Cracking (FCC) process is a vital unit to produce gasoline. In this research,
a feed forward ANN model was developed and trained with industrial data to investigate the effect of operating variables containing reactor temperature feed flow rate, the temperature of the top of the main column and the temperature of the bottom of the debutanizer tower on quality and quantity of gasoline, LPG flow rate and process conversion. Eventually, validated ANN model and firefly algorithm which is an evolutionary optimization algorithm were applied to optimize the operating conditions. Three different optimization cases including maximization of RON (as the parameter which demonstrates the quality of the gasoline), gasoline flow rate and conversion were investigated. In order to obtain the maximum level of targeted output variables, inlet reactor temperature, temperature of the top of the main column, temperature of the bottom of debutanizer column and feed flow rate should respectively set at 525,138, 169ºC and 43000 bbl/day. Also, sensitivity analysis between the input and output variables were carried out to derive some effective rule-of- thumb to facilitate the operation of the process under unsteady state conditions. The result introduces a methodology to compensate for the negative effect of undesirable variation in some operating variables by manipulating the others.
KEYWORDS: Fluid catalytic cracking; Artificial neural network, firefly algorithm; Optimization;
RON; Gasoline.
INTRODUCTION
For over fifteen years, Fluid Catalytic Cracking (FCC) has been one of the main petroleum refining processes to produce gasoline. This is designed to process a wide range of feed stock including straight run distillates,
atmospheric and vacuum residue and VGO (vacuum Gasoil).Riser-reactor and regenerator are the two main equipment of the process. The oily feed is vaporized and cracks to lighter products as it moves up and contacted
* To whom correspondence should be addressed.
with hot powdered re-circulating catalyst in the riser-reactor. The deactivated coked catalyst is sent to the regenerator to burn off the coke and reactivate.
Same as other chemical processes like catalytic reforming process [1], isomerization [2], hydrodesulfurization [3] and thermal cracking [4], modeling and simulation are directly utilized to monitor the performance, optimize and control of the FCC process [5-12, 23-26]. The applied model contains rigorous models and black box models. Rigorous models are majorly based on kinetic models with different lumps and developed to estimate the effect of different designing or operating variables on conversion or control the FCC process [5-11]. Also, it is used to optimize the quality of produced gasoline [12]. Moreover, like several chemical phenomena and chemical processes [13-24] black box modeling such as Artificial Neural Network (ANN), Fuzzy logic and Adaptive neuro-fuzzy inference system is applied in the field of FCC processes [25, 26]. Also, different evolutionary algorithms [27, 28] were applied to optimize the process.
In this research, to investigate the productivity of the FCC process and the impact of operating conditions, a black box model based on ANN (Artificial Neural Network) is applied. This facilitates analysis of the effect of operating conditions on the quality and quantity of produced gasoline. Moreover, to determine optimum operating conditions for improvement of quality and quantity of gasoline (RON and gasoline flow rate), the adapted developed model together with firefly algorithm (as an evolutionary optimization method) is utilized. The results will demonstrate the ability of the selected optimization algorithm to determine suitable operating conditions. Moreover, the results will apply to figure out certain rules to weaken the negative effects of the variation of operating variables in unsteady state conditions.
THEORITICAL SECTION Specification of the FCC process
The feedstock of the process is Vacuum GasOil (VGO) with the characterization demonstrated in Table. 1. Before feeding to the process; it is preheated to 232ºC to improve the conversion of the process. Then it is injected to the riser-reactor in which the feed is vaporized due to the close proximity to the hot catalyst. The catalyst cracking exothermic reactions have occurred in the effective volume of riser-reactor while the catalyst over oil ratio is between 4 and 9.
Table 1: The characterization of FCC feedstock.
Sp.Gr@ 60ºF 0.906
IBP 290ºC
10% 307ºC
30% 355ºC
70% 440ºC
FBP 570ºC
Carbon Conradson,wt% 0.7%
In addition to main products, the coke is also produced and formed on the catalyst. It is later removed by burning in the regenerator. Indeed, after the riser- reactor the catalyst and product mixture are separated in cyclones. The products are sent to separation section of the process and the catalyst is sent to the regenerator to reactivate and coke removal. The selected FCC process is licensed by UOP. This unit processes 45000 bbl VGO to produce LPG, HCO, LCO and maximum four million liters per day gasoline. Specification of the catalyst which is used in this process is illustrated in Table 2.
Field Data
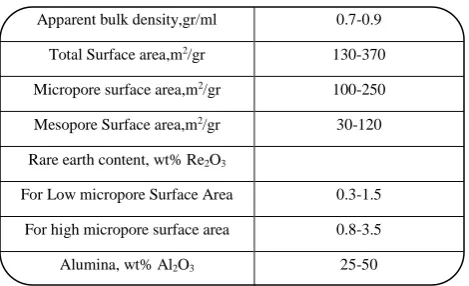
Table 2: Fresh FCC catalyst characteristics.
Apparent bulk density,gr/ml 0.7-0.9
Total Surface area,m2/gr 130-370
Micropore surface area,m2/gr 100-250
Mesopore Surface area,m2/gr 30-120
Rare earth content, wt% Re2O3
For Low micropore Surface Area 0.3-1.5
For high micropore surface area 0.8-3.5
Alumina, wt% Al2O3 25-50
the maximum and minimum observed value of output variables are illustrated in Table 3.
Modeling methodology
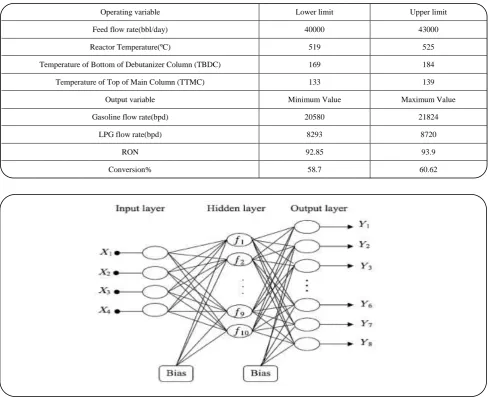
In this research, a model based on the ANN system is developed. This is a parallel structure made up of nonlinear nodes that are related to each other by fixed weights and variables. Since these weights are not based on any physical quantities, this method is known as a black-box model. One of the famous schemes of neural networks for supervised learning is the MultiLayer Perceptron (MLP). This is directly applied for classification and prediction problems. In a feed-forward MLP, neurons contain at least three layers of nodes including input, output and one or more hidden layers (Fig. 1). For this configuration, the information is wide spread in only the forward direction.
The one hidden layer networks are the most widely used kind of MLP_network. In this network each node with in a layer is connected to all of the nodes of the previous layer. This node is constituted of the weighted inputs and a bias. The results are clarified by the following linear function:
m
J i 0 ji i j
A
w x b (1)Wji is a weight that goes from the input (i) to the
hidden neuron (j); b is the bias to the node, and xi is the input unit of the neuron. By applying a function (f), the output of the neuron can be written as follow:
i j
Z f a (2)
This is used to model the nonlinear behavior of the process. Several functions such as the tangent sigmoid, linear
and logarithmic sigmoid functions are tested and applied for designing the artificial neural network. The tangent sigmoid function is demonstrated as following:
eaa e aa f ae e
(3)
Moreover, the logarithmic- sigmoid function is defined as follow:
1 af a
1 e
(4)
After construction of the structure of the ANN, the training procedure is performed by introducing a set of clarified inputs and outputs. Then, the network can learn the trend of these data by manipulating the weights and biases by using backward propagation. Hence, minimization of the following objective function as the mean square error is the key to adjusting the fitting parameters:
2N
k,actual ki,mod el k 1
1
MSE Y Y
N
(5)In which N is the total number of clarified data and k is the output value; actual refers to the measured outputs from the plant, and model refers to the values calculated by ANN. For better validation and analyzes of the results, some other statistical parameters are also used. These are defined as follow:
RMSE MSE (6)
2 N
ki,actual ki,mod el
2 i 1
2 N
ki,actual ki,mod el i 1
Y Y
R 1
Y Y
(7)By using the above parameters for evaluation of the designed neural network, the best and most qualified artificial neural network is determined.
Optimization
Table 3: Upper and lower limits of chosen input; maximum and minimum observed value of output variables.
Operating variable Lower limit Upper limit
Feed flow rate(bbl/day) 40000 43000
Reactor Temperature(ºC) 519 525
Temperature of Bottom of Debutanizer Column (TBDC) 169 184
Temperature of Top of Main Column (TTMC) 133 139
Output variable Minimum Value Maximum Value
Gasoline flow rate(bpd) 20580 21824
LPG flow rate(bpd) 8293 8720
RON 92.85 93.9
Conversion% 58.7 60.62
Fig. 1: Schematic diagram of a three- layer ANN.
are the three different optimization goals. Firefly algorithm as a methaheuristic nature-inspired algorithm is applied to attain the optimum operating conditions. This algorithm is based on the social (flashing) behavior of fireflies or lighting bugs in the summer sky in the tropical regions. It has three exact idealized rules which are based on some of the major flashing characteristics of real fireflies [29]. These are as follow: (1) all fire flies are assumed as unisex; the fireflies move towards more attractive and brighter ones regardless of their sex. (2) The amount of attraction of a firefly is proportional to the brightness of the fireflies. It decreases by increasing the firefly distance from others, regarding the fact that the air absorbs the light. However, the brightest ones move randomly. (3) The brightness or lighting power of a firefly is established
by the value of the objective function of a given problem. To apply this algorithm a computer code that is published by Xin-She Yang, was utilized [29]. Following equations are introduced to obtain maximum RON, gasoline production flow rate and conversion by minimization the difference between the actual and maximum value of the variables:
2
2
2 RON max RON
f 1
max RON
Conversion max(Conversion) min imize f 2
max(Conversion)
gasolineflow max(gasolineflow) f 3
max(gasolineflow)
4 4 519 Re actor Temperature 525
4 10 Feed flowrate 4.3 10 133 Temperature of Top of Main Constra int
Column 139
168 Temperature of Bottom of Debu tan izer Column 184
(9)
Constraint indicates limitations of operating conditions which are determined based on the authentic process. f(1) shows the objective function to minimize the difference between the maximum obtainable and actual RON. Likewise, f(3) introduces an objective function to minimize the difference between the actual and maximum possible gasoline production flow rate. Moreover, f(2) indicates the minimization of the difference between the maximum obtainable and actual conversion.
RESULTS AND DISCUSSIONS
Industrial data were collected in the eighteen-month period. The different neural network was designed to predict the output variables. Tables 4 to 6 demonstrate the accuracy of different studied schemes of artificial neural networks. As stated above R-squared and MSE are effectively utilized to clarify the precision of different alternatives. Different alternatives are formed based on using logarithmic- sigmoid, linear and tangent sigmoid functions in hidden or output layers. Each table illustrates the alternatives for the artificial neural networks which are designed to predict the production rate of gasoline, LPG, the value of RON (Research octane number) of gasoline and conversion of the FCC process.
Between five detected alternatives demonstrated in Table 4, the lowest MSE and the highest R-Squared belong to the network in which the tangent sigmoid and linear functions are respectively applied to form hidden and output layers. The worst alternative network for prediction of LPG flow rate is the one which shows a high value of MSE and low value of R-Squared. However, the best network is respectively constituted of the tangent sigmoid and linear functions for designing of hidden and output layers. Indeed, utilizing Tangent sigmoid and linear function in Hidden and output layers, made precise networks to estimate RON and conversion of the process. Furthermore, to determine the optimum number of neurons in hidden layers, different networks with different neurons were checked. Minimum checked
neurons were two and the maximum neurons are nine. As it is shown in Table 7, seven neurons in hidden layers form the best neural network with minimum MSE and maximum R-Squared.
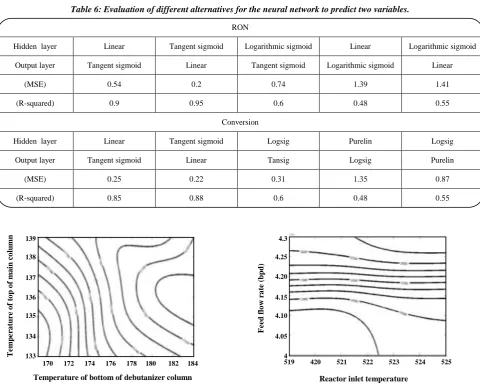
The impact of operating conditions on output variables is clarified by utilizing the verified neural networks. The effect of TTMC and the TBDC on produced gasoline flow rate is demonstrated in Fig. 2 (a). It is cleared that increasing the TTMC at specified TBDC increases the produced gasoline flow rate. While increasing the TBDC at definite TTMC slightly decreases the gasoline flow rate. Increasing the TTMC increases the chance of escaping of higher boiling point components from the collective trays of the column. Consequently, these components accompany the gasoline products easily and will cause increasing the gasoline flow rate. This will increase the end boiling point of produced gasoline. On the other hand, increasing the TBDC will increase the separation of iso and normal butanes from gasoline. Consequently, it decreases the production rate of this product. Fig. 2 (a) reveals that the TTMC has a greater effect than TBDC on the production of gasoline. In fact, each 1ºC increment in TTMC is the cause of sixty barrel per day variation in the production rate of gasoline. However, 1ºC rise in TBDC would yield 18.33 barrel per day variation in the production rate of gasoline.
The impacts of feed flow rate and inlet reactor temperature are elucidated by the exploration of Fig. 2(b). Raising the feed flow rate at stable inlet reactor temperature increases the rate of gasoline production rate. In the operating range, definite rising in feed flow rate yields the same increment in gasoline production rate. Moreover, the minor contribution of inlet reactor temperature is related to the negligible effects of rates of reactions on gasoline production flow rate. Indeed 6ºC rising in reactor temperature, which includes the total operating domain, would only increase the gasoline production flow rate by 1.6% at a low feed flow rate. However, the effect is decreased by increasing the feed flow rate.
Table 4: Evaluation of different alternatives for neural network to gasoline production rate. Logarithmic sigmoid Linear Logarithmic sigmoid Tangent sigmoid Linear Hidden layer
Linear Logarithmic sigmoid Tangent sigmoid Linear Tangent sigmoid Output layer 0.64 1.4 1.34 0.15 0.19 (MSE) 0.55 0.48 0.6 0.93 0.9 (R-squared)
Table 5: Evaluation of different alternativesa for neural network to estimatethe LPG production rate.
Logarithmic sigmoid Linear
Logarithmic sigmoid Tangent sigmoid
Linear Hidden layer
Linear Logarithmic sigmoid Tangent sigmoid Linear Tangent sigmoid Output layer 1.18 0.23 1.12 0.09 0.105 (MSE) 0.55 0.48 0.6 0.92 0.9 (R-squared)
Table 6: Evaluation of different alternatives for the neural network to predict two variables.
RON Logarithmic sigmoid Linear Logarithmic sigmoid Tangent sigmoid Linear Hidden layer
Linear Logarithmic sigmoid Tangent sigmoid Linear Tangent sigmoid Output layer 1.41 1.39 0.74 0.2 0.54 (MSE) 0.55 0.48 0.6 0.95 0.9 (R-squared) Conversion Logsig Purelin Logsig Tangent sigmoid Linear Hidden layer
Purelin Logsig Tansig Linear Tangent sigmoid Output layer 0.87 1.35 0.31 0.22 0.25 (MSE) 0.55 0.48 0.6 0.88 0.85 (R-squared)
Fig. 2: The effect of temperature of the top of the main column, the temperature of the bottom of debutanizer column, feed flow rate
and Inlet reactor temperature on gasoline production rate.
T emp er a tu re o f to p o f m a in c o lu mn 139 138 137 136 135 134 133
Temperature of bottom of debutanizer column
170 172 174 176 178 180 182 184
Fe ed f lo w r a te ( b p d ) 4.3 4.25 4.20 4.15 4.10 4.05 4
Reactor inlet temperature
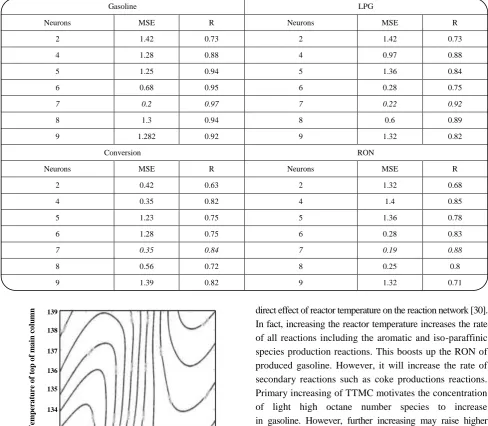
Table 7: MSE and R-Squared of networks for prediction of gasoline, LPG, RON and conversion of process.
Gasoline LPG
Neurons MSE R Neurons MSE R
2 1.42 0.73 2 1.42 0.73
4 1.28 0.88 4 0.97 0.88
5 1.25 0.94 5 1.36 0.84
6 0.68 0.95 6 0.28 0.75
7 0.2 0.97 7 0.22 0.92
8 1.3 0.94 8 0.6 0.89
9 1.282 0.92 9 1.32 0.82
Conversion RON
Neurons MSE R Neurons MSE R
2 0.42 0.63 2 1.32 0.68
4 0.35 0.82 4 1.4 0.85
5 1.23 0.75 5 1.36 0.78
6 1.28 0.75 6 0.28 0.83
7 0.35 0.84 7 0.19 0.88
8 0.56 0.72 8 0.25 0.8
9 1.39 0.82 9 1.32 0.71
Fig. 3: The effect of inlet reactor temperature and temperature of the top of the main column on the gasoline flow rate (bpd).
has a prime effect on the gasoline flow rate in comparison with TTMC.
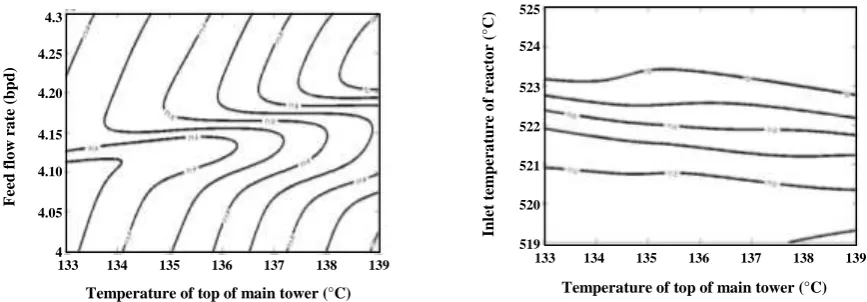
Fig. 4, introduces the effects of input variables on RON. Indeed, increasing the inlet reactor temperature and TTMC raises the RON. However, raising or declining the temperature of the bottom of the debutanizer column has no significant effect on RON. So, the main effect belongs to the reactor temperature. This is rationalized by the
direct effect of reactor temperature on the reaction network [30]. In fact, increasing the reactor temperature increases the rate of all reactions including the aromatic and iso-paraffinic species production reactions. This boosts up the RON of produced gasoline. However, it will increase the rate of secondary reactions such as coke productions reactions. Primary increasing of TTMC motivates the concentration of light high octane number species to increase in gasoline. However, further increasing may raise higher boiling point species which have a lower octane number. This certainly declines the average octane number of gasoline. Due to small changes of the species owing to a variety of temperature of the top of the main column, the domain of variation of RON in this field is very narrow. By briefly exploring of Fig. 4(b), the maximum RON is obtained in a region with TTMC less than 137ºC and reactor temperature higher than 524ºC. Simultaneous increasing of TTMC and reactor temperature stimulates the RON to have an increasing trend. This also approves the greater impact of reactor temperature on RON.
The effect of variation of operating conditions on the conversion of the process is clarified in Fig. 5. Fig. 5(a) illustrates that increasing the TTMC at the stable feed
T
emp
er
a
tu
re
o
f
to
p
o
f
m
a
in
c
o
lu
mn 139
138
137
136
135
134
133
Reactor inlet temperature
Fig. 4: The effect of inlet reactor temperature, TTMC, and TBDC on RON.
Fig. 5: The effect of Feed flow rate(bbl/day), inlet reactor temperature(ºC) and TTMC(ºC) on Conversion.
flow rate raises the conversion. However, based on this figure the feed flow rate has neutralized effects on conversion. Fig. 5(b) declares that high conversion of the FCC process is obtained while the inlet reactor temperature and TTMC have their high value. This is related to the decisive effect of reactor temperature on chemical reactions rate [30].
The influence of input variables on LPG production rate is demonstrated in Fig. 6. Raising Feed flow rate and inlet reactor temperature increases the LPG production rate. However, at the high feed flow rate, the effect of inlet reactor temperature is weakened. This is related to decreasing residence time [30]. Fig. 6(b) illustrates the interaction effects of TTMC and reactor inlet temperature. The predominant effect of reactor inlet temperature on LPG flow rate is related to the dependence of light species formation on reactor inlet temperature. However, increasing the TTMC causes to escape heavy hydrocarbon from liquid phases to LPG,
which certainly has less impact on LPG production rate. This is also approved by a detailed exploration of contours in Fig. 5(b).
Up until now, it has been shown that the sensitivity analysis presented here has facilitated in scrutinizing the results generated from the developed ANN model. Eventually, the validated model can be applied to investigate the optimum operating conditions. So, firefly algorithm is applied to minimize the objective function introduced by equation (1). Table 8 introduces the optimum operating conditions in three different cases. These different cases are respectively maximization of RON, maximization of RON and gasoline flow rate and maximization of RON, gasoline flow rate and conversion.
Table 8 shows that setting the maximum value for the inlet reactor temperature and feed flow rate have a great impact on the maximization of the output variables. However, changing the value of TBDC and TTMC,
T
emp
er
a
tu
re
o
f
to
p
o
f
m
a
in
c
o
lu
mn 139
138
137
136
135
134
133
Reactor inlet temperature
519 420 521 522 523 524 525
In
le
t
te
mper
a
tu
re
o
f
re
a
ct
o
r
(°C)
525
524
523
522
521
520
519
Temperature of bottom of debutanizer (°C)
170 172 174 176 178 180 182 184
Fe
ed
f
lo
w
r
a
te
(
b
p
d
)
4.3
4.25
4.20
4.15
4.10
4.05
4
Temperature of top of main tower (°C)
133 134 135 136 137 138 139
In
le
t
te
mper
a
tu
re
o
f
re
a
ct
o
r
(°C)
525
524
523
522
521
520
519
Temperature of top of main tower (°C)
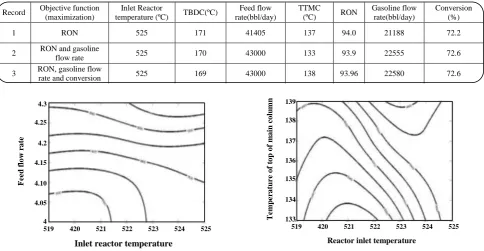
Table 8: The optimum operating conditions for three different cases.
Record Objective function (maximization)
Inlet Reactor
temperature (ºC) TBDC(ºC)
Feed flow rate(bbl/day)
TTMC
(ºC) RON
Gasoline flow rate(bbl/day)
Conversion (%)
1 RON 525 171 41405 137 94.0 21188 72.2
2 RON and gasoline
flow rate 525 170 43000 133 93.9 22555 72.6
3 RON, gasoline flow
rate and conversion 525 169 43000 138 93.96 22580 72.6
Fig. 6: The effect of Reactor inlet temperature (ºC), Feed flow rate(bbl/day) and TTMC(ºC) on LPG production(bbl/day).
affects the number of maximized variables. For example, to maximize the values of RON, conversion, and gasoline flow rate, the value of TBDC should be set at the minimum level and the value of TTMC should be set at 138ºC, which is near the maximum.
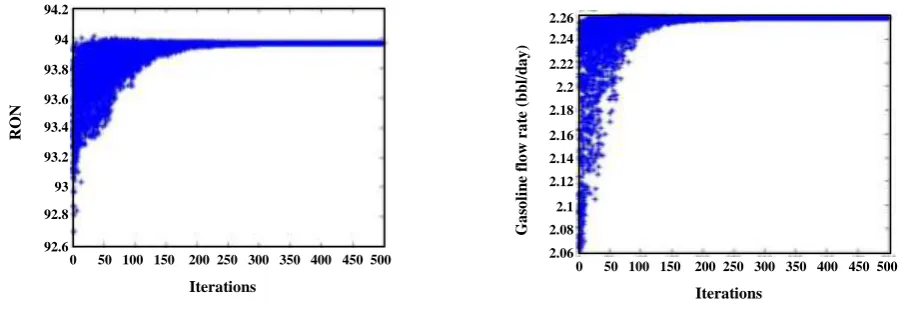
The behavior of the firefly optimization algorithm is illustrated in Fig. 7. The figure shows the RON and Gasoline production rate versus iterations of the firefly algorithm while it runs to approach to optimum conditions. As it is clearly shown the sample population diverges at the primary iterations. But by improving the iterations they converge to the maximum allowable value. It is also declared that after the 300th iteration all the population sample converged to the maximum value. The figure illustrates that the maximum divergence of the sample population is observed in the first iteration. However, rapid declining in the divergence is observed in the later iterations. In fact, by increasing the iterations the sample population converges to the maximum. Indeed, after the 300th iteration no observable changes obtained in the procedure.
CONCLUSIONS
Investigation towards FCC process optimization is studied by analyzing a different range of available collected industrial data. In this study, the selected output variables
were respectively gasoline, LPG, LCO, Gas, and CO production flow rate. However, these variables depend on input variables. Inlet reactor temperature, feed flow rate, TTMC, and TBDC are recognized as the most effective ones. An ANN modeling system was developed and trained by industrial data. The results of model validation illustrated enough accuracy. The sensitivity analysis between input and output variables was carried out by utilizing the validated model. This was yielded in a set of rules to properly run the FCC process in abnormal situations. First of all the effects of decreasing the feed flow rate on gasoline flow rate can be partly compensated by raising the inlet reactor temperature. Indeed, one bbl change in feed flow rate made a variation in gasoline production rate about 0.6 bbl. However, 1ºC variation in inlet reactor temperature will make 83 bbl/day variations in gasoline production flow rate. Since the maximum allowable variation of inlet reactor temperature is 6ºC, the maximum compensable decline in gasoline production rate is 500 bbl/day. This is approximately equal to one third of total declining resulted by decreasing the feed flow rate from the maximum to minimum observable value in the span of operating conditions. In addition, RON can easily be controlled by the reactor inlet temperature. In fact, 1ºC increment in this variable causes
Fe
ed
f
lo
w
r
a
te
4.3
4.25
4.2
4.15
4.10
4.05
4
Inlet reactor temperature
519 420 521 522 523 524 525
T
emp
er
a
tu
re
o
f
to
p
o
f
m
a
in
c
o
lu
mn 139
138
137
136
135
134
133
Reactor inlet temperature
Fig. 7: RON and gasoline production rate versus iterations generated by Firefly algorithm.
approximately 0.15 increasing in RON, while the maximum variation of RON is one unit.
Eventually, to determine the optimum conditions for different objective functions defined about this process, a firefly optimization algorithm is applied. The three defined objective functions are respectively i) Maximization of RON, ii) Maximization of RON and gasoline flow rate and iii) Maximization of RON, Gasoline flow rate, and Conversion. It was shown that maximization of RON, gasoline flow rate and conversion may be obtained when the feed flow rate, inlet reactor temperature, TTMC and TBDC respectively set at 43000 bbl/day, 525ºC, 138ºC, and 169ºC. However, maximization of two variables including RON and gasoline production flow rate is achieved at the operating conditions the same as the conditions mentioned above except some changes in the TBDC and TTMC. In this case, these variables should respectively set at 170ºC and 133ºC.
Acknowledgments
The financial support provided by the Research and Development Center of the National Iranian Oil Company is greatly appreciated.
Received : Apr. 11, 2017 ; Accepted : Dec. 12, 2017
REFERENCES
[1] Zahedi Abghari S., Alizadehdakhel A., Mohaddecy R.S., Alsairafi A.A., Experimental and Modeling Study
of a Catalytic Reforming Unit, J. Taiwan. Inst.
Chem. Eng. (JTICE), 45: 1411-1420 (2014).
[2] Hayati R., Zahedi Abghari S., Sadighi S., Bayat M., Development of a Rule to Maximize the Research Octane Number (RON) of the Isomerization
Production From Light Naphtha, Korean J. Chem.
Eng. (KJChE), 32(4): 629-63 5(2015).
[3] Zahedi Abghari S., Shokri S., Baloochi B., Marvast M.A., Ghanizadeh S., Behroozi A., Analysis of Sulfur Removal in Gasoil Hydrodesulfurization Process by Application of Response Surface
Methodology, Korean J. Chem. Eng. (KJChE),
28(1): 93-98 (2011).
[4] Zahedi Abghari S., Towfighi Darian J., Karimzadeh R., Omidkhah M.R., Determination of Yield Distribution in Olefin Production by Thermal
Cracking of Atmospheric Gasoil, Korean J. Chem.
Eng. (KJChE), 25(4): 681-692(2008).
[5] Heydari M., Ebrahim H.A., Dabir B., Modeling of
an Industrial Riser in the Fluid Catalytic Cracking.
Am. J. Appl.Sci., 7(2): 221-226 (2010).
[6] Elamurugan P., Dinesh Kumar D., Modeling and Control of Fluid Catalytic Cracking Unit in
Petroleum Refinery, IJCCIS, 2(1): 56-59 (2010).
[7] Mythily M., Manamalli D., Nandhini R.R., Dynamic Modeling and Improvement in the Tuning of PI Controllers for Fluidized Catalytic Cracking Unit,
WSEAS Transactions on System and Control, 10:
297-306 (2015).
[8] Affum H.A., Adu P.S., Dagadu C.P.K., Addo M.A., Mumuni I.I., Appiah G.K., Coleman A., Adzaklo S.Y., Modeling Conversion in a Fluid Catalytic
Cracking Regenerator in Petroleum Refining, Res. J.
Appl. Sci. Eng. Technol., 3(6): 533-539(2011).
R
ON
94.2
94
93.8
93.6
93.4
93.2
93
92.8
92.6
Iterations
0 50 100 150 200 250 300 350 400 450 500
Iterations
0 50 100 150 200 250 300 350 400 450 500
Ga
so
li
n
e
fl
o
w
r
a
te
(
b
b
l/
d
a
y
)
2.26
2.24
2.22
2.2
2.18
2.16
2.14
2.12
2.1
2.08
[9] Dagade K.K., Puyate Y.T., Modelling and Simulation of Industrial FCC Unit: Analysis Based on
Five-lump kinetic Scheme for Gas-oil Cracking, IJERA,
2(5): 698-714 (2012).
[10] Dagde K.K., Puyate Y.T., Modeling Catalyst
Regeneration in an Industrial FCC Unit, Am. J. Sci.
Ind. Res., 4(3): 294-305 (2013).
[11] Baldessae F., Negrao C.O.R., Simulation of Fluid
Catalytic Cracking Risers- A Six lump Model,
Proceeding of COBM 2005(18th International
Congress of Mechanical Engineering), Ouro Preto, MG
[12] Ansari S.H., Bin Rasheed T.A., Mustafa I., Naveed
S., Optimization of Fluid Catalytic Cracker for
Refining of Sybcrude oil for Production of High
Quality Gasoline. IJISET, 1(4): 506-511(2014).
[13] Zahedi.Abghari S., Sadi M., Application of Adaptive Neuro-Fuzzy Inference System for the Prediction of the Yield Distribution of the Main Products in the
Steam Cracking of Atmospheric Gasoil, J. Taiwan
Inst. Chem. Eng. (JTICE), 44(3): 365-376(2013). [14] Tarjomannejad A., Prediction of the Liquid Vapour
Pressure using the Artificial Neural Network-Group
Contribution Method, Iran. J. Chem. Chem. Eng.
(IJCCE), 34(4): 97-111 (2015)
[15] Ehsani M.R., Bateni H., Modeling of Oxidative
Coupling of Methane over Mn/Na2WO4/SiO2
Catalyst using Artificial Neural Network, Iran. J.
Chem. Chem. Eng. (IJCCE), 32(3): 1047-114 (2013) [16] Sodeifian G.H., Sajadian S.A., Saadati Ardestani N.S., Evaluation of the Response Surface and Hybrid Artificial Neural Network- Genetic Algorithm, Methodologies to Determine Exact Yield of
Ferulago Angulata Through Supercritical Fluid,
J. Taiwan Inst. Chem. Eng., 60: 165-173 (2016) [17] Esfandyari M., Fanaei M.A., Gheshlaghi R.,
A.Mahdavi M., Neural Network and Neuro-Fuzzy Modeling to Investigate the Power Density and
Clumbic Efficiency of Microbial Fuel Cell,
J. Taiwan Inst. Chem. Eng. (JTICE), 58: 84-91 (2016). [18] Hadi N., Niaei A., Nabavi S.R., Alizadeh R., Navaei
Shirazi M., Izadkhah B., An intelligent Approach to Design and Optimization of
M-Mn/H-ZSM-5(M:Ce,Cr,Fe,Ni) Catalyst in Conversion of
Methanol to Propylene, J. Taiwan Inst. Chem. Eng.
(JTICE), 59: 173-185(2016).
[19] Jiang B., Zhang F., Sun Y., Zhou X., Dong J., Zhang L., Modeling and Optimization for Curing of Polymer Flooding Using an Artificial Neural Network and
a Genetic Algorithm, J. Taiwan Inst. Chem. Eng.
(JTICE), 45(5): 2217-2224 (2014).
[20] Mohammadzadeh A., Ramezani M., Ghaedi A.M.,
Synthesis and Characterization of Fe2O3
-ZnO-ZnFe2O4/Carbon Nano Composite and Its Application
to Removal of Bromophenol Blue Dye Using Ultrasonic Assisted Method; Optimization by Response
Surface Methodology and Genetic Algorithm,
J. Taiwan Inst. Chem. Eng., 59: 275-84 (2016). [21] Raja M.A.Z., Shah F.H., Khan A.A., Khan N.A.,
Design of Bio – Inspired Computational Intelligence Technique for Solving Steady Thin Film Flow of Johnson- Segalman Fluid Fluid on Vertical Cylinder
for Drainage Problems, J. Taiwan Inst. Chem. Eng.,
60: 59-75 (2016).
[22] Ronda A., Martin Lara M.A., Almendros A.L., Perez A., Blazquez G., Comparison of Two Models for the Biosorption of Pb(II) Using Untreated and Chemically Treated Olive Stone; Experimental Design Methodologies and Adaptive Neural Fuzzy
Inference System (ANFIS), J. Taiwan Inst. Chem.
Eng. (JTICE), 54: 45-56 (2015).
[23] Mousavi M., Avami A., Modeling and Simulation of Water Softening by Nanofiltration Using Artificial
Neural Network, Iran. J. Chem. Chem. Eng.
(IJCCE), 25(4): 37-45 (2006).
[24] Saghatoleslami N., Mousavi M., Sargolzaei J., A Neuro-Fuzzy Model for a Dynamic prediction of
Milk ultrafiltration Flux and Resistance, Iran. J.
Chem. Chem. Eng. (IJCCE), 26(2): 53-61 (2007). [25] Zeydan M., The Comparison of Artificial
Intelligence and Traditional Approaches in FCCU
Modeling , Int J. IND ENG., 15(1): 1-15 (2008).
[26] Bispo V.D.S., Sandra E., Silva R.L., Meleiro L.A.C., Modeling, Optimization and Control of A FCC Unit
Using Neural Networks and Evolutionary Method,
Engevista, 16(1): 70- (2014).
[27] Kasat R.B., Gupta S.K., Multi-Objective
Optimization of an Industrial Fluidized-Bed
Catalytic Cracking Unit (FCCU) Using Genetic
Algorithm(GA) with the Jumping Genes
Operator, Comput. Chem. Eng., 27(12): 1785-1800
[28] Chen C., Yang B., Yuan J., Wang Z., Wang L., Establishment and Solution of Eight-Lump Kinetic Model for FCC Gasoline Secondary Reaction Using
Particle Swarm Optimization, Fuel, 86(15):
2325-2332 (2007).
[29] Xin-She Yang, “Nature- Inspired Methaheuristic
Algorithm”, 2nd ed., Luniver Press (2010).
[30] Froment Gilbert F., Bischoff Kenneth B., “Chemical
Reactor Analysis and Design”, John Wiley & Sons,