Published online February 20, 2013 (http://www.sciencepublishinggroup.com/j/ajsea) doi: 10.11648/j. ajsea.20130201.12
R language in data mining techniques and statistics
Sonja Pravilovic
1,21
Montenegro Business School, "Mediterranean" University, Montenegro
2
Dipartimento di Informatica, Università degli Studi di Bari "Aldo Moro", Italy
Email address:
[email protected] [email protected] (S. Pravilovic)
To cite this article:
Sonja Pravilovic. R Language in Data Mining Techniques and Statistics, American Journal of Software Engineering and Applications.
Vol. 2, No. 1, 2013, pp. 7-12. doi: 10.11648/j.ajsea.20130201.12
Abstract:
Data mining is a set of techniques and methods relating to the extraction of knowledge from large amounts of data (through automatic or semi-automatic methods) and further scientific, industrial or operational use of that knowledge. Data mining is closely related to the statistics as an applied mathematical discipline with an analysis of data that could be defined as the extraction of useful information from data.The only difference between the two disciplines is that data mining is a new discipline that is related to significant or large data sets. R is an object-oriented programming language. This means that everything what is done with R can be saved as an object. Every object has a class. It describes what the object contains and what each function does. Application of R as a programming language and statistical software is much more than a supplement to Stata, SAS, and SPSS. Although it is more difficult to learn, the biggest advantage of R is its free-of-charge feature and the wealth of specialized application packages and libraries for a huge number of statistical, mathematical and other methods. R is a simple, but very powerful data mining and statistical data processing tool and once "discovered", it provides users with an entirely new, rich and powerful tool applicable in almost every field of research.Keywords:
R Language, Data Mining Techniques, Statistics1. Introduction
Data mining is a set of techniques and methods relating to the extraction of knowledge from large amounts of data (through automatic or semi-automatic methods) and further scientific, industrial or operational use of that knowledge. Data mining is closely related to the statistics as an applied mathematical discipline with an analysis of data that could be defined as the extraction of useful information from da-ta.
The only difference between the two disciplines is that data mining is a new discipline that is related to significant or large data sets.
In essence, data mining is a mathematical analysis car-ried out on large databases. The term data mining became especially popular in the 90's, and today it has a double meaning:
• using advanced analytical techniques to extract im-plicitly hidden information knowledge already structured in data in order to make it available and directly useful,
• research and analysis of large amounts of data, per-formed automatically or semi-automatically, with the aim of discovering significant patterns.
In both cases, the concepts of information and its mean-ing are closely related dependmean-ing on the domain of data mining and the application of these data in a particular area. Today, data mining is a crucial activity in many areas of scientific research, but also in other areas (for example, in market research, economics, finance, medicine, agriculture, meteorology, etc.). In the professional world, it is used to solve various problems ranging from customer relationship management (CRM), fraud identification, consumer beha-vior, web pages optimization, etc.
The main factors that contributed to the development of data mining are:
• large amounts of data in the electronic form,
• cheap data storage,
• new methods and techniques of analysis (machine learning, pattern recognition).
Data mining techniques are based on specific algorithms. Patterns can be identified, the starting point for new hypo-theses can be set, and then the causal relationship between the events can be tested, which can be further used in a statistical sense for the production and prediction of new data.
• grouping;
• neural networks,
• decision trees,
• associative analysis (identification of simulta-neously purchased products), etc.
One of the most widespread techniques is learning through classification.
There are numerous packages for statistical data processing: SAS, SPSS, Stata, R. Certainly, it is a very good idea to have a number of tools available, but in the end they users themselves should decide which of them to apply. The technical reports of the strengths and weak-nesses of these packages rarely take into account the accu-racy in choosing the statistical software. In some models, such as nonlinear regression, it is the accuracy that will have a bigger problem of practical importance than others.
Data mining techniques allow easier analysis, and a high level of knowledge of analytical skills is highly attractive and sought after in many successful companies. R represents an ideal solution for many challenging tasks associated with data mining. It offers a breadth and depth of computational statistics, and is much more than what is offered by commercially closed source products. R is pri-marily a programming language for highly qualified statis-ticians.
2. R-in Data Mining
Data mining combines the concepts, tools and algorithms of machine learning and statistics to analyze very large data sets, so as to gain insight, understanding and effective knowledge and it is applied for this purpose in many com-panies.
R is a statistical software, and an object-oriented high-level programming language used for data analysis, which includes a large number of statistical procedures such as t-test, chi-square test, standard linear models, in-strumental variables estimation, local regression polyno-mials, etc. Besides, R provides high-level graphics capabil-ities.
R is an object-oriented programming language. This means that everything what is done with R can be saved as an object. Every object has a class. It describes what the object contains and what each function does. For example, plot (x) does not give the same output if the regression re-sult is x or vector.
The objective of the R style as a programming guide is easier reading, using and verification of the code.
3. Creation of R
The elegant and widely accepted S language, as a per-manent software system with an outstanding comprehen-sive conceptual solution is the result of the effort and hard work of John Chambers. In 1998, the Association for Computing Machinery (ACM) presented it with its Soft-ware System Award as "the S system" and forever changed
the way people would analyze, visualize and manipulate data. R is inspired by the S environment developed by John Chambers, and significant contributions of Douglas Bates, Rick Becker, Bill Cleveland, Trevor Hastie, Daryl Pregibon and Allan Wilks.[1].
R was initially written by Ross Ihaka and Robert Gen-tleman at the Department of Statistics, University of Auck-land, New Zealand. After that, a large group of individuals contributed to R by sending codes and so-called bug reports. The current R is a result of a collaborative effort with con-tributions from around the world. In mid-1997 a core of the group known as the R Core Team was formed, whose members can change the archive of the R source code.
R is a dialect of the S language. The S language was de-veloped at Bell Labs as a computing environment for data analysis and graphical display. The graphical display and interactivity, which can be found in R, are powerful tools for data research since they provide an understanding of data in the easiest way.
4. R Language
In the last ten years, the language R statistics has ex-ploded in popularity and functionality and has become an election tool of scientists around the world. Today, R is used by more than 2,000,000 analysts. Since it has com-pletely unveiled its elegance and power to the academic community so far, the members of the academic communi-ty have embraced the R language for solving their most challenging problems in the fields ranging from computa-tional biology, quantitative finance to training people in these fields.
The result is the explosion of the R analytics and appli-cations, which has led to enthusiasm and acceptance of R as a primary analytical method in companies such as Google, Facebook and LinkedIn. R is now available to everyone and is becoming a powerful and revolutionary support in any workplace, improving productivity.
Each technique of data analysis is now at hand instead of limiting the analysis and features with paid added modules. R encompasses virtually all data manipulations, statistical models, dates, and charts, that is, everything that a modern scientist needs. Even when the predictive model doesn't give excellent results, it is simple and easy to find help by assuming and using the most modern community of re-views of the methods in statistics and predictive modeling of leading scientists, absolutely free of charge.
To make a beautiful and unique visualization of the date by presenting the complex data and charts is just one of the essential elements of the process of data analysis. R sur-passes the traditional bar charts and line plots, and facili-tates the extraction of meaning from multidimensional data with a multi-panel scale, 3-D surfaces and much more.
more efficient and flexible than the inherited user-friendly statistical software in creating the mix and match models for the best results. The R code is automated and easily repeatable in research and implementation. [4]
As a successful open-source project, R is supported by a community of more than 2 million users and thousands of programmers around the world. Whether the use enables optimizing portfolios, analyzing genomic sequences or pre-dicting a certain component in the failure, experts in every field have made resources, applications and the code avail-able online free of charge.
The basis of the R language consists of: data entry, data-frames, graphical display of 2D and 3D data, tables, ma-thematics and mathematical functions, the classical tests of data mining, statistical models, regression, analysis of va-riance, covava-riance, general linear models, count data, count data in the tables, the proportions of data, binary variable, general models, mix-effect models, tree models, time series analysis, multivariate models, spatial statistics, simulation models, and many others. [1]
R is a high-level language with the environment de-signed for the analysis and graphical representation of data. Here, the term "environment" is used to characterize it as a fully planned and coherent system, and not a system that is gradually supplemented with specific and inflexible pro-gramming tools, which is very often the case with other data analysis programs.
R can be easily and considerably expanded by the instal-lation through packages or libraries. There are more than 3000 packages in the Cran data warehouse (repository). The R language design was influenced by the schemes of two existing languages: Becker, Chambers and Wilks's and Sussman's.
The existing R language is very similar in appearance to S, but sublevels of implementation and the semantics are derived from this scheme.
R certainly has a very rich environment that can be en-joyed by beginners, intermediate-level users and experts in disciplines ranging from scientific activities, economics, finance, sociology, political science, agriculture, medicine and engineering.
R includes the packages for preparation, processing, data display, graphics, mathematical functions, a wide range of statistical techniques, from the basic conventional tests, through regression and analysis of variance and general linear modeling, to more specialized topics such as spatial statistics, multivariate methods, tree models, mix-effective models and analysis of time series, as well as many others.
The idea is to offer R to users with very little knowledge of statistical theory, assuming that they do not know the basics of mathematics and / or statistics in order to assist them in their assumptions behind the tests, and encore a critical approach to statistical modeling.
The question that may be asked is why users should be-gin to deal with R instead of implementing a perfectly ap-propriate statistical package to solve their problems? If the intention is to implement a very limited range of statistical
tests, and not to do more (or otherwise) in the future, then it is absolutely fine not to switch to R.
However, the main reason for switching to R is to take advantage of the coverage and availability of new applica-tions where R is the best in the areas such as effective ge-neralized mixed models, as well as other general and addi-tional models. Another reason for learning R may be the desire of users to understand the literature, as more people in various fields of sciences publish their research results in the context of R. Thirdly, if some research is made in the field of data mining, then it is very easy to notice that today the best known researchers in this discipline have become highly specialized in using R. In addition, a large number of the world's leading statisticians use R, so of course, this also contributes to the importance of knowing R.
Another very important reason for learning R is a quality of back-up and support. There is a premium network dedi-cated to research and Web wizards are eager to answer the questions of users. If the user intends to invest enough ef-fort in becoming a good computer statistician, the structure of R and the easiness of writing one own's functions are the main attractions. The last, but certainly not the least impor-tant reason is that the R product, as one of the best inte-grated software in the world, is available for free.
Resembling methods (bootstrapping, random permuta-tion tests, etc.) are very useful and easy to operate (funcpermuta-tion within the for loop). In addition, it enables a direct access to packages through the network or via the mailing list. Eg: through install.packages (name) you get a package called name (assuming that the computer running R is connected to the Internet), which makes R good, in collaboration with other programs, and widely available.
R runs on Windows, Macintosh, Linux and Unix plat-forms and the installation is free of charge and easy through http://cran.r-project.org/ . However, although the R lan-guage has a lot of benefits it is difficult to learn for users who have had no experience in programming. For users who have worked with data in other programming lan-guages, switching to R makes everything incredibly easier and faster.
Working in R can sometimes be problematic, since it re-quires that all objects are stored in memory, indicating the limited size of data sets. Optimization routines in R such as optim or nlm require passage through a function whose argument is a vector of parameters (eg. log-likelihood). However, the function object may depend on a variety of other things in addition to its parameters (data). In writing the optimization code, the existence of bonding parameters is desirable in order to allow the access to the user.
R has functions to access databases. A typical solution with large data sets is the storage of data in the database and the entry of those that are necessary to R, as needed. Another weakness is the lack of coherent documentation that covers the entire R.
The "official" R consists of several packages that are created by the core R team. In addition, there are hundreds of packages that have been enriched by the users. Some of these packages represent the latest statistical research li-brary. Most statistical research is first conducted in the R language.
R is not supported in the same way as the commercial software, but many users are finding better support through the R-help or through the network, rather than from com-mercial enterprises. Users will often use R because of its simple and clear graphical environment.
Many users use R as a statistics system, although it is much more than that. The R environment incorporates clas-sical and modern statistical techniques and / or packages and libraries.
There is a significant difference in approach between S
(toward R)and other statistical systems. For example, in S, a statistical analysis is usually conducted in a series of steps, storing the intermediate results of individual steps in ob-jects. [3].
For example, SAS and SPSS give more extensive results from a regression or discriminant analysis. R, however, gives the minimal output and stores the results within cer-tain objects, so they can be accessed by further functions for subsequent interrogation.
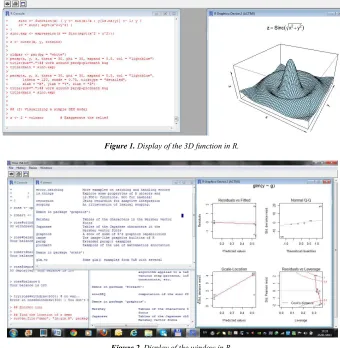
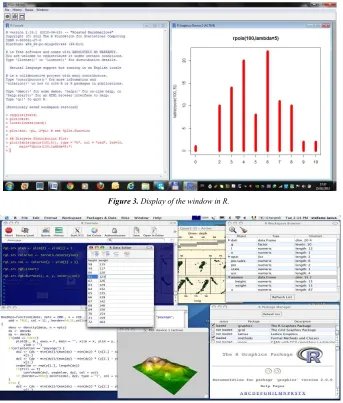
R is started within the graphical environment (Figures 1, 2, 3, 4) and through a windowing system, and the pro-gramming code can be written directly within the window or copied from another editor. The results and code, input or output data, can be saved and loaded in various forms, such as. *.txt, *.dat. *.r data files.
Figure 1. Display of the 3D function in R.
Figure 3. Display of the window in R.
Figure 4. View of the window in MacOS.
Since R has a rich set of facilities and the programming language, it is, of course, difficult to master for the custom-ers, but once learned, it is very easy to extend, amend, en-hance, and apply in another field or find a simpler solution in R.
It is particularly difficult for users who are accustomed to working within the framework of statistical packages, since they have high expectations. There are hundreds of R packages, but only a few of them may be suitable for a given problem for a particular client.
Individual users have a much easier task. They need some basic knowledge of R, and then they need to learn some specific techniques that are related to the problems in their area. After solving the problem, the user can only re-tain an insight into how to solve the problem and try new packages within R that could help achieve even simpler solution. [2]
Functions in the research are "first class objects", which means that they can be treated like any other R object. It is important that the results of the function can be input ar-guments in new functions. Functions can be nested, which means that they can be contained within one another. The
output value of the function is the last expression in the body of the function.
The object functions can be "created" so as to contain all the arguments necessary for evaluating the function. There is no need for the transfer of long arguments of the list, which are useful for interactive and research work within the program. The code can be relieved and cleaned using comparametrisation.
R has a vast amount of information available, is rich in the user databases and functionality. In addition, R is very suitable for the creation of reports on daily, weekly, yearly schedule, while the level of documentation is much higher than the average open source software, even than some commercial packages (eg, SPSS).
6. Conclusion
Application of R as a programming language and statis-tical software is much more than a supplement to Stata, SAS, and SPSS. Although it is more difficult to learn, the biggest advantage of R is its free-of-charge feature and the wealth of specialized application packages and libraries for a huge number of statistical, mathematical and other me-thods. R is a simple, but very powerful data mining and statistical data processing tool and once "discovered", it provides users with an entirely new, rich and powerful tool applicable in almost every field of research.
References
[1] M. J. Crawley, The R book, Imperial College London at Silwood Park, UK, John Wiley and Sons, Ltd 2007.
[2] Dalgaard, P. Introductory Statistics with R, New York, Springer-Verlag, 2002.
[3] Krause, A. and Olson, M. The Basics of S and S-PLUS, New York, Springer-Verlag, 2000.