Sci
O p e n H U B f o r S c i e n t i f i c R e s e a r c hForschen
Nutrition and Food Technology: Open Access
Open Access
Systematic Review and Comparison of Classification
Frameworks Describing the Degree of Food
Processing
Michelle Crino1*, Tala Barakat2, Helen Trevena1 and Bruce Neal1,2,3,4
1The George Institute for Global Health, University of Sydney, Sydney, Australia
2School of Public Health and Charles Perkins Centre, Faculty of Medicine, University of Sydney, Sydney,
Australia
3The Royal Prince Alfred Hospital, Sydney, Australia 4Imperial College, London
*Corresponding author: Michelle Crino, The George Institute for Global Health, University of Sydney, Sydney, Australia, E-mail:[email protected]
Introduction
Most foods now available have been processed such that they differ from their original harvested state [1-5]. Processing was initially developed as method for reducing spoilage and increasing food safety but is now often done to deliver time-saving, convenient and low cost products to consumers. Food processing varies from basic techniques such as salting and drying to complex manufacturing methods that completely transform the foods’ characteristics [1, 6-8].
Processed foods are notoriously known to be high in risk-associated nutrients (sugars, fats and salt), as well as being energy dense, hyper-palatable and nutrient poor in ‘positive’ nutrients (fibre, protein, vitamins and minerals) [1,2,9-15]. Due to these characteristics of processed foods, excess consumption of processed foods is a key contributor to poor diet, and hence has been implicated as a cause of obesity and diet-related non-communicable diseases [1,2, 9-18]. In particular, very highly processed products (i.e. ultra-processed foodstuffs) have been identified as a likely cause of health problems and there is a strong underlying pathophysiological reason for expecting that these types of foods would cause harm [1,2,6,7,10,11,13-16,18-20]. However, research findings have varied [1,2,6-8,10-19] and key methodological challenges behind this
Volume: 3.1
Abstract
Background: Many available foods have been processed such that they differ from their original harvested state.There are several different classification frameworks used to distinguish between the levels of processing applied to a food but the comparability of the frameworks is unknown.
Methods: We sought to identify all relevant food classification frameworks and determine the level of agreement between them.This was done by applying each framework to the 135 food categories described in the Euromonitor 2011 ‘Who Eats What’ report and comparing how each framework defined each food category.
Results: We searched PubMed, ScienceDirect and Google Scholar databases, reviewed 185 abstracts and 25 full text reports.There were 6 eligible classification frameworks identified – FSANZ, IARC, IFPRI, NOVA, IFIC and an unnamed framework described by Poti. FSANZ simply dichotomised foods into unprocessed or processed while the remainder divided foods into three (IFPRI), four (IARC-EPIC), five (IFIC and NOVA) or seven (Poti) categories based upon the degree of processing. For the primary analysis of determining the agreement of unprocessed versus processed across classification frameworks, there were 810 comparator points between the 6 frameworks, for which 651matched (81%). The highest level of agreement was between IFPRI and IARC (134/135, 99%) and the lowest level of agreement was between FSANZ and NOVA (92/135, 68%).The NOVA framework stood out as having between 68 and 81% agreement with the other 5 frameworks while agreement was between 89 and 99% if NOVA was excluded.
Interpretation: Most frameworks made similar basic classifications of food categories as processed or unprocessed. Systems with more levels of classification may prove more useful for tracking changes in the food supply and in defining associations of food processing with health concerns.
Keywords:
Food classification; Processed food; Food supplyReceived date: 12 Dec 2016; Accepted date: 06 Feb 2017; Published date: 10 Feb 2017.
Citation: Crino M, Barakat T, Trevena H, Neal B (2017) Systematic Review and Comparison of Classification Frameworks Describing the Degree of Food Processing. Nutr Food Technol 3(1): doi http://dx.doi.org/10.16966/2470-6086.138
Copyright: © 2017 Crino M, et al. This is an open-access article distributed under the terms of the Creative Commons Attribution License, which permits unrestricted use, distribution, and reproduction in any medium, provided the original author and source are credited.
include the diversity of frameworks used to classify foods according to their level of processing [21], the different applications and methodologies used to classify food by processing, and to a further extent, conflicts of interests between research and industry [1]. A better understanding of the way that the different classification frameworks define the degree of food processing and the extent to which these frameworks differ in their definitions should facilitate approaches to track changes in the food supply and understand the role of food processing in disease causation. Accordingly, the aim of this study was to identify and compare the classifications provided by each of the available frameworks.
Methods
Search strategy
We searched PubMed, ScienceDirect and Google Scholar databases to identify relevant food classification frameworks. The search terms included ‘food classification’, ‘food classification system(s)’, ‘processed food(s)’, ‘processed food definition(s)’, ‘processed food classification(s)’ and ‘food classification framework’. In addition to the electronic searches we did snowball sampling using the references lists of identified papers. Each abstract, and selected full text report was reviewed independently for eligibility by two authors with undergraduate degrees in medical science,
Research Article
Sci
O p e n H U B f o r S c i e n t i f i c R e s e a r c hForschen
Open Access
nutrition and food science, and Master’s Degrees in public health (MC and TB) with disagreements resolved by consultation.
Included classification frameworks
Classification frameworks were eligible for inclusion if they were: (i) generalizable and could be applied to all 135 Euromonitor food categories; (ii) able to be applied to foods available at the point of purchase (this excluded frameworks designed specifically for use in dietary assessment settings such as dietary recalls, household food surveys, and weight food records); (iii) specific to detailing industrial food processing; (iv) able to allocate foods into two or more different groups depending upon the level of processing applied; and (v) could be applied to a broad range of different food types.
Food categories used for making the assessment
We used the 135 food categories defined in the Euromonitor 2011 ‘Who Eats What Report’ (Appendix 1) to compare the identified frameworks. These 135 food categories cover the main sources of packaged and unpackaged foods sold across 80 countries [22]. For the purpose of assessing the level of processing, unless otherwise specified, food groups were considered plain or unflavored, canned fruit was assumed to be in natural juices and not syrup, canned vegetables were assumed to be in water not brine, canned meat and fish were assumed to be in oil not sauce or marinade, and nuts were assumed to be unsalted.
Assignment of food categories within each classification
framework
Each of the 135 food categories was assigned to the appropriate level of processing in each of the different frameworks. This was done independently by two authors (MC and TB). Discrepancies between the two were recorded and a final assignment was agreed through consultation. In addition to the assignment of each food category to the most appropriate level of processing within the framework, the processing levels within each framework were also grouped to provide a dichotomisation of categories into unprocessed or processed. Once again this assignment was done independently by two authors (MC and TB) with disagreements recorded and a final assignment agreed by discussion.
Analysis
The primary analysis was a comparison of the proportion of products categorised as processed versus unprocessed for each of the 810 (6 frameworks x 135 food categories) food category pairs that could be compared between the 6 classification frameworks. The agreement between a pair of frameworks was estimated by counting the number of food categories for which the assignment of processed or unprocessed was congruent, dividing that number by 135 (the total number of food categories) and multiplying by 100 to obtain a percentage. The number of times each food category was differently assigned as processed or unprocessed across the six frameworks was also recorded. In addition, to understand the ease of applying the frameworks, we tabulated the number of discrepancies between assignments made by the two authors for the allocation of food categories within each framework and also recorded initial inconsistencies in the allocation of processing levels within each of the non-dichotomous frameworks as unprocessed or processed.
Results
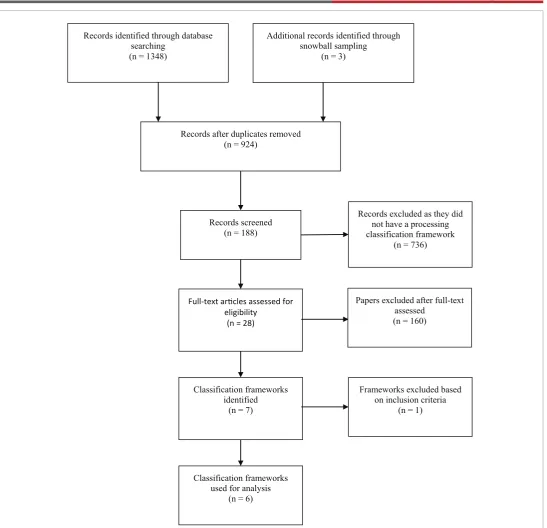
The search identified 1348 abstracts of which 1323 were excluded on the basis of the title or abstract content (Figure 1). We reviewed 28 reports as full text and identified six eligible food classification frameworks (Table 1; Figure1) - (i) Food Standards Australian New Zealand (FSANZ) [23]; (ii) International Food and Information Council (IFIC) [12,21,24]; (iii)
International Agency for Research on Cancer and European Prospective Investigation into Cancer and Nutrition (IARC-EPIC) [16,17,21]; (iv) International Food Policy and Research Institute (IFPRI) [13,21]; (v) NOVA(25); and (vi) an unnamed framework published by Poti et al. [15].
Characteristics of the frameworks
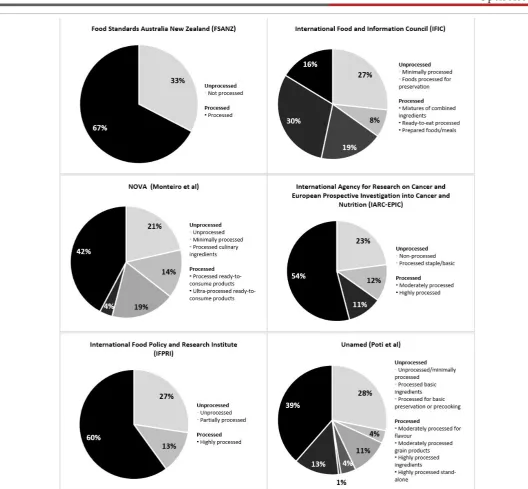
Of the 6 frameworks, FSANZ simply dichotomised foods into unprocessed or processed [23], IFPRI divided foods into three levels of processing [13], IARC-EPIC into four levels of processing [16], IFIC and NOVA into five levels of processing [12,25] and Poti into seven levels of processing [15] (Figure 2). Although the NOVA classification has 3 major classifications [25], with the third group split in to (a) processed ready-to-eat and (b) ultra-processed, crready-to-eating four classifications, the framework was considered to have 5 levels of processing as it also separately defined unprocessed and minimally processed [18]. For the IARC-EPIC framework we excluded the ‘moderately processed at home’ categorisation option (because it described processing after purchase) and placed each food category into one of the other 4 levels.
All frameworks defined the lowest level of processing as ‘unprocessed’ or ‘non-processed’ except for IFIC which used the term, ‘minimally processed’. The NOVA framework specified a category of ‘ultra-processed foods’ above ‘highly processed foods’ which was the highest level of processing defined for all other frameworks except IFIC, where the descriptor of the highest level of processing was ‘prepared foods/meals’.
Division of the levels of the five frameworks that were not already a dichotomy into unprocessed or processed resulted in processing levels described as ‘minimal or no processing’, ‘unprocessed’, ‘not processed’, ‘minimally processed’, ‘processed basic ingredients’ and ‘processed for preservation’ being assigned as unprocessed. The descriptors of the levels assigned as processed were ‘foods that have been substantially changed from their original form’, ‘ready-to-eat processed’, ‘mixtures of combined ingredients’, ‘processed staple/basic’, ‘prepared foods/meals’,’ moderately processed’, ‘highly processed’, and ‘ultra-processed’. There were 24 different descriptors of processing across the 5 non-dichotomous frameworks that had to be assigned as unprocessed or processed by the authors. The independent assignments made by the authors (MC and TB) were initially the same for 18/24 with 6 requiring discussion to make a final assignment as unprocessed or processed.
Assignment of foods categories within the frameworks
Two authors (MC and TB) independently assigned each food category to a processing level within each framework for a total of (6 × 135=810) allocations each. There were 43/810 (5.3%) assignments that were discrepant between the two authors that had to be resolved by consensus. There were no disagreements for the Poti framework, 2/135 (1.5%) for the IFIC framework, 11/135 (8.1%) for the NOVA framework, 9/135 (6.7%) for the IARC-EPIC and IFPRI frameworks and 12/135 (8.9%) for the FSANZ framework. Examples of food categories that were more difficult to assign and were initially assigned discrepantly across several frameworks were prepared salads, honey and canned/preserved sea food (Appendix 1).
Sci
O p e n H U B f o r S c i e n t i f i c R e s e a r c hForschen
Open Access
Records identified through database searching
(n = 1348)
Additional records identified through snowball sampling
(n = 3)
Records after duplicates removed (n = 924)
Records screened (n = 188)
Records excluded as they did not have a processing classification framework
(n = 736)
Full-text articles assessed for eligibility
(n = 28)
Papers excluded after full-text assessed
(n = 160)
Classification frameworks identified
(n = 7)
Classification frameworks used for analysis
(n = 6)
Frameworks excluded based on inclusion criteria
(n = 1)
Figure 1: Flowchart describing search for classification frameworks
food categories that varied most in their assignment to unprocessed or processed across frameworks were chilled/fresh pasta, cooking fats, dried pasta, other dairy and plain noodles which were each assigned as unprocessed by three and processed by three.
Discussion
The six identified frameworks took different approaches to the classification of foods but ultimately defined major categories of products as unprocessed or processed in fairly similar proportions and a fairly similar way. Accordingly, while research findings based upon one
Sci
O p e n H U B f o r S c i e n t i f i c R e s e a r c hForschen
Open Access
Framework N % Dichotomous conversion N %
FSANZ CLASSIFICATION
Not processed 44 33 Unprocessed 44 33
Processed 91 67 Processed 91 67
IFPRI CLASSIFICATION
Unprocessed 38 28
Unprocessed 54 40
Partially processed 17 13
Highly processed 80 60 Processed 80 60
IARC-EPIC CLASSIFICATION
Non-processed 31 23
Unprocessed 46 34
Processed staple/basic 15 11
Moderately processed 16 12
Processed 89 66
Highly processed 73 54
IFIC CLASSIFICATION
Minimally processed 36 27
Unprocessed 47 35
Foods processed for preservation 11 8
Mixtures of combined ingredients 25 19
Processed 88 65
Ready-to-eat processed 41 22
Prepared foods/meals 22 16
NOVA CLASSIFICATION
Unprocessed 29 21
Unrpocessed 73 54
Minimally processed 19 14
Processed culinary ingredients 25 19
Processed ready-to-consume products 5 3
Processed 62 46
Ultra-processed ready-to-consume
products 57 42
POTI & MENDEZ CLASSIFICATION
Unprocessed/minimally processed 38 28
Unprocessed 58 43
Processed basic ingredients 5 4
Processed for basic preservation or
pre-cooking 15 11
Moderately processed for flavor 6 4
Processed 77 57
Moderately processed grain products 1 1
Highly processed ingredients 18 13
Highly processed stand-alone 52 39
Table 1: Number (%) of foods with different levels of processing for each
classification framework according to original definitions and dichotomised as unprocessed or processed*
*Food groups used for assessment were the 135 food groups defined in the Euromonitor 2011 ‘Who Eats What Report’ which covers the main sources of packaged and unpackaged foods across 80 countries [22]
Table 2: Proportion of 135 food categories with the same designation (processed or unprocessed) for each pair of classification frameworks** **Food groups used for assessment were the 135 food groups defined in the Euromonitor 2011 ‘Who Eats What Report’ which covers the main sources of packaged and unpackaged foods across 80 countries [22]
classification framework of those that we assessed, and has been used on numerous occasions in nutrition research to assess the healthiness of diets and food environments where food composition data has not been readily available [7,14,21] The relative utility of these frameworks will depend somewhat upon the research question being asked and the setting in which the research is being done. The capacity for different users to consistently interpret and apply a framework will, however, be important in most settings because systematic or random errors in the use of a framework will adversely impact upon the ability to address the research question under investigation [15]. In this regard the Poti framework performed best
with independent assignments by the two reviewers identical for all 135 food categories. By contrast, almost one in ten of the assignments made for the FSANZ and NOVA frameworks were discrepant. In practice, when it is individual food products, rather than broad food categories that need to be assigned a level of processing the errors are likely to be greater because the foods within some categories can be quite varied.
Prior work has identified no clear association between the number of different levels of processing described by a framework and the ease of assigning foods to processing categories [15,21]. The same was true in this study. While the FSANZ framework with just two levels of processing proved the hardest for which to make consistent assignments and the Poti framework with seven levels the easiest, the NOVA framework with five described levels of processing had the second highest rate of disagreement between the assignments made. The rather vague definition of processed foods used by FSANZ – “substantial change to the original state of the food” [23] – proved to be open to significant interpretation while the more technical definitions used by the NOVA framework were difficult to apply to some food categories [25]. More detailed data such as individual product data (product description and ingredients), a more detailed food categorisation system and familiarity with industrial food processes may aid with the use of all systems, but more so the NOVA system [21,25]. Alternatively, the use of less technical definitions and the provision of more food product examples, as has been done for the Poti framework which is a modification of the NOVA framework [15], can make application of the system much more straightforward (Appendix 2).
An advantage of frameworks that describe multiple levels of processing is that they should provide for a better description of the nature of the food supply and the nutritive value of foods within it [15,21,25]. For example, in many research settings, it will be important to distinguish between canned fruits that are in syrup versus natural juices, something that cannot be achieved by a dichotomous framework such as FSANZ but that would be distinguished by all the other frameworks that comprise three or more different levels. The use of a framework that provides a multi-level description of the degree of processing of foods will be important for research seeking to demonstrate associations between food processing and health outcomes because a more detailed description of the exposure of individuals or populations to different types of food should enhance the capacity to detect associations. It will also make it possible to explore possible dose-response associations between not just the portions of food that is processed but also the extent of processing that food has undergone.
Sci
O p e n H U B f o r S c i e n t i f i c R e s e a r c hForschen
Open Access
and NCDs that may be particularly pronounced for more highly or ultra-processed products [1,2,10-19,21,26,27]. An objective and easy to apply framework that makes robust assignments of foods on the basis of their degree of processing therefore has significant potential to better define the way in which the food supply impacts upon health outcomes.
A key strength of this research is that we sought to systematically identify and summaries all applicable frameworks. Further, we moved beyond a prior qualitative assessment of selected frameworks [21] to provide a quantitative evaluation of the various systems and the ease with which they can be applied. A more robust evaluation of the comparative ease with which each framework can be used could be achieved by having more
people repeat the assignments made by the authors of this paper. A further evaluation of the frameworks could be made by comparing the levels of ‘positive’ and risk-associated nutrients in the food categories assigned as unprocessed or processed by each framework and its association with nutrient profiling and association with NCDs, but was beyond the scope of this research. While a detailed nutrient-based evaluation of foods is likely to be preferred in most research scenarios, it can be hard to obtain those data and simple classification frameworks such as those evaluated here may offer a valid alternative. A final limitation to the evaluation made here is that the Euromonitor ‘Who Eats What’ 2011 report food categories as obtained employed for the main comparisons includes only dairy-based beverages and no other beverage categories [22].
Figure 2: Classification of foods by level of processing for 6 different classification frameworks‡
Sci
O p e n H U B f o r S c i e n t i f i c R e s e a r c hForschen
Open Access
Conclusion
There are a number of research questions for which the application of a framework that classifies foods according to their level of processing are likely to be of value. The available frameworks were mostly easy to apply and resulted in broadly comparable findings. The primary exception was the NOVA framework but whether this was performing better or worse is unclear. This means that future research that relies upon the classification of foods as unprocessed or processed should ideally test their hypotheses using at least two frameworks, one of which should be NOVA. A piece of research that applied nutrient profiling to a large standard set of foods and compared the average nutrient profile of processed versus unprocessed foods between frameworks would be of value. Application and interpretation of classification systems were found to be highly variable. If utilised properly, with a minimum 2-stage reviewer process, classification frameworks can provide useful insight to the types of foodstuffs available in a food environment of interest and/or the proportion of an individual’s or nation’s diet that is comprised of processed foodstuffs. Classification frameworks with more levels of food processing provided more insight to the (non-nutritional) composition of food environments than the dichotomous frameworks, which were observed to be limited in their use. It is recommended that classification frameworks are used in conjunction with a quantitative-based system, such as nutrient profiling, to robustly assess the healthiness of food environments.
Acknowledgment
Crino and Neal are researchers working within a NHMRC Centre for Research Excellence in Obesity Policy and Food Systems (APP1041020).
Bruce Neal is supported by a National Health and Medical Research Council of Australia Principle Research Fellowship (APP1106947) and holds a NHMRC Program Grant (APP1052555).
References
1. Weaver CM, Dwyer J, Fulgoni VL, King JC, Leveille GA, et al. (2014) Processed foods: contributions to nutrition. Am J Clin Nutr 99: 1525-1542. 2. Moodie R, Stuckler D, Monteiro C, Sheron N, Neal B, et al. (2013)
Profits and pandemics: prevention of harmful effects of tobacco, alcohol, and ultra-processed food and drink industries. Lancet 381: 670-679.
3. Stuckler D, McKee M, Ebrahim S, Basu S (2012) Manufacturing Epidemics: The Role of Global Producers in Increased Consumption of Unhealthy Commodities Including Processed Foods, Alcohol, and Tobacco. PLoS Med 9: e1001235.
4. Monteiro CA (2009) Nutrition and health. The issue is not food, nor nutrients, so much as processing. Public Health Nutr 12: 729-731. 5. Baker P, Friel S (2014) Processed foods and the nutrition transition:
evidence from Asia. Obes Rev 15: 564-577.
6. Floros JD, Newsome R, Fisher W, Barbosa Cánovas GV, Chen H, et al. (2010) Feeding the world today and tomorrow: the importance of food science and technology. Compr Rev Food Sci Food Saf 9: 572-599. 7. Monteiro C, Cannon G, Levy RB, Claro R, Moubarac J-C (2012) The
food system. Processing. The big issue for diease, good health, well-being. World Nutrition 3: 527-569.
8. Dwyer JT, Fulgoni VL, Clemens RA, Schmidt DB, Freedman MR (2012) Is “Processed” a four-letter word? The role of processed foods in achieving dietary guidelines and nutrient recommendations. Advances in Nutrition: An International Review Journal 3: 536-548.
9. Mozaffarian D, Hao T, Rimm EB, Willett WC, Hu FB (2011) Changes in diet and lifestyle and long-term weight gain in women and men. N Engl J Med 364: 2392-2404.
10. Moubarac J-C, Martins APB, Claro RM, Levy RB, Cannon G, et al. (2013) Consumption of ultra-processed foods and likely impact on human health. Evidence from Canada. Public Health Nutr 16: 2240-2248. 11. González-Castell D, González-Cossío T, Barquera S, Rivera JA (2007)
Contribution of processed foods to the energy, macronutrient and fiber intakes of Mexican children aged 1 to 4 years. Salud Publica Mex 49: 345-356.
12. Eicher-Miller HA, Fulgoni VL, Keast DR (2012) Contributions of processed foods to dietary intake in the US from 2003–2008: a report of the Food and Nutrition Science Solutions Joint Task Force of the Academy of Nutrition and Dietetics, American Society for Nutrition, Institute of Food Technologists, and International Food Information Council. J Nutr 142: 2065S-2072S.
13. Asfaw A (2011) Does consumption of processed foods explain disparities in the body weight of individuals? The case of Guatemala. Health Econ 20: 184-195.
14. Monteiro CA, Levy RB, Claro RM, de Castro IRR, Cannon G (2011) Increasing consumption of ultra-processed foods and likely impact on human health: evidence from Brazil. Public Health Nutr 14: 5-13. 15. Poti JM, Mendez MA, Ng SW, Popkin BM (2015) Is the degree of food
processing and convenience linked with the nutritional quality of foods purchased by US households? Am J Clin Nutr 101: 1251-1262. 16. Slimani N, Deharveng G, Southgate D, Biessy C, Chajès V, et al.
(2009) Contribution of highly industrially processed foods to the nutrient intakes and patterns of middle-aged populations in the European Prospective Investigation into Cancer and Nutrition study. Eur J Clin Nutr 63: S206-S225.
17. Chajès V, Biessy C, Byrnes G, Deharveng G, Saadatian-Elahi M, et al. (2011) Ecological-level associations between highly processed food intakes and plasma phospholipid elaidic acid concentrations: results from a cross-sectional study within the European prospective investigation into cancer and nutrition (EPIC). Nutr Cancer 63: 1235-1250. 18. Moubarac J-C, Batal M, Martins APB, Claro R, Levy RB, et al. (2014)
Processed and ultra-processed food products: consumption trends in Canada from 1938 to 2011. Can J Diet Pract Res 75: 15-21.
19. Popkin BM (2001) The nutrition transition and obesity in the developing world. J Nutr 131: 871S-873S.
20. Dietary Guidelines Advisory Committee. Report of the Dietary Guidelines Advisory Committee on the Dietary Guidelines for Americans 2010-2011.
21. Moubarac J-C, Parra DC, Cannon G, Monteiro CA (2014) Food classification systems based on food processing: significance and implications for policies and actions: a systematic literature review and assessment. Curr Obes Rep 3:256-272.
22. Euromonitor International. 2011 ‘Who Eats What’ Report. 2012. 23. Food Standards Australia New Zealand. Australia New Zealand Food
Standards Code - Standard 3.2.2 - Food Safety Practices and General Requirements 2014.
24. International Food Information Council Foundation. Understanding Our Food Communications Toolkit 2010 updated 3 September 2015. 25. Monteiro CA, Levy RB, Claro RM, Castro IRRd, Cannon G (2010) A
new classification of foods based on the extent and purpose of their processing. Cad Saude Publica 26: 2039-2049.
26. Louzada ML, Baraldi LG, Steele EM, Martins APB, Canella DS, et al. (2015) Consumption of ultra-processed foods and obesity in Brazilian adolescents and adults. Prev Med 81: 9-15.
Sci
O p e n H U B f o r S c i e n t i f i c R e s e a r c hForschen
Open Access
Food Category Final assignment as unprocessed (UP) or processed (P)
FSANZ IFPRI IARC-EPIC IFIC NOVA POTI
Apples UP UP UP UP UP UP
Banana UP UP UP UP UP UP
Beans UP UP UP UP UP UP
Beef and veal UP UP P UP UP UP
Biscuits P P P P P P
Breads P P UP P P P
Breakfast bars P P P P P P
Breakfast cereals P P P P P P
Bouillon/stock cubes P P UP P UP P
Butter P UP UP P UP UP
Cakes P P P P P P
Canned/preserved beans UP UP P UP P UP
Canned/preserved fish/seafood UP UP P UP P UP
Canned/preserved fruit UP UP P UP UP UP
Canned/preserved meat and meat products P P P UP P P
Canned/preserved pasta P P P P P P
Canned/preserved ready meals P P P P P P
Canned/preserved soup P P P P P P
Canned/preserved tomatoes UP UP P UP UP UP
Canned/preserved vegetables UP UP P UP UP UP
Cassava UP UP UP UP UP UP
Cheese P UP P P P P
Cherries UP UP UP UP UP UP
Chilled fish/seafood UP UP P UP P UP
Chilled lunch kits P P P P P P
Chilled noodles P P P P UP UP
Chilled pizza P P P P P P
Chilled processed meat P P P P P P
Chilled ready meals P P P P P P
Chilled soup P P P P P P
Chilled/fresh pasta P P UP P UP UP
Chips/crisps P P P P P P
Chocolate confectionery P P P P P P
Chocolate spreads P P P P P P
Cooking fats P P UP P UP UP
Cranberries/Blueberries UP UP UP UP UP UP
Crustaceans UP UP UP UP UP UP
Dehydrated soup P P P P P P
Dessert mixes P P P P P P
Dinner mixes P P P P P P
Sci
O p e n H U B f o r S c i e n t i f i c R e s e a r c hForschen
Open Access
Dips P P P P P P
Dried pasta P P UP P UP UP
Dried ready meals P P P P P P
Drinking milk products P UP UP P UP UP
Dry sauces/powder mixes P P P P UP P
Energy and nutrition bars P P P P P P
Extruded snacks P P P P P P
Fish UP UP P UP UP UP
Fresh cut fruits UP UP UP UP UP UP
Frozen bakery P P P P P P
Frozen desserts P P P P P P
Frozen meat substitutes P P P P P P
Frozen noodles P P P P UP UP
Frozen pizza P P P P P P
Frozen processed potatoes P P P P P P
Frozen processed poultry P P P P P P
Frozen processed red meat P P P P P P
Frozen processed vegetables UP UP P UP UP UP
Frozen ready meals P P P P P P
Frozen soup P P P P P P
Frozen yoghurt P P P P P P
Fruit bars P P P P P P
Fruit snacks P P P P P P
Granola/muesli bars P P P P P P
Grapefruit/pomelo UP UP UP UP UP UP
Grapes UP UP UP UP UP UP
Gum P P P P P P
Herbs and spices UP UP P P UP UP
Honey UP UP UP UP UP UP
Impulse ice cream P P P P P P
Instant noodles P P P P P P
Instant soup P P P P P P
Jams and preserves P P P UP P P
Ketchup P P P P P P
Lamb, mutton and goat UP UP P UP UP UP
Lemon and limes UP UP UP UP UP UP
Margarine P P UP P UP P
Mayonnaise P P P P UP P
Meal replacement slimming P P P P P P
Molluscs and cephalopods UP UP UP UP UP UP
Monosodium glutamate (MSG) P P P P UP P
Mustard P P P P UP P
Nut-based spreads P P P P P P
Sci
O p e n H U B f o r S c i e n t i f i c R e s e a r c hForschen
Open Access
Olive oil P UP P P UP UP
Onion UP UP UP UP UP UP
Oranges, tangerines and mandarins UP UP UP UP UP UP
Other canned/preserved food P P P UP P P
Other dairy P UP UP P UP P
Other frozen processed food P P P P P P
Other fruits UP UP UP UP UP UP
Other ice cream P P P P P P
Other meat UP UP P UP UP UP
Other pulses UP UP UP UP UP UP
Other roots UP UP UP UP UP UP
Other sauces, dressing and condiments P P P P UP P
Other snack bars P P P P P P
Other sweet and savoury snacks P P P P P P
Other vegetables UP UP UP UP UP UP
Pasta Sauces P P P P UP P
Pastries P P P P P P
Peaches/nectarines UP UP UP UP UP UP
Pears/quinces UP UP UP UP UP UP
Peas UP UP UP UP UP UP
Pickled products P P P UP P P
Pineapple UP UP UP UP UP UP
Plain noodles P P UP P UP UP
Plums UP UP UP UP UP UP
Popcorn P P P P UP UP
Pork UP UP UP UP UP UP
Potatoes UP UP UP UP UP UP
Poultry UP UP UP UP UP UP
Prepared salads P UP P UP UP UP
Pretzels P P P P P P
Retail artisanal ice cream P P P P P P
Rice UP UP UP P UP UP
Salad dressings P P P P UP P
Snack noodles P P P P P P
Sour milk drinks P UP UP P UP UP
Soy based sauces P P P P UP P
Spreadable oils and fats P P UP P UP P
Strawberries UP UP UP UP UP UP
Sugar confectionery P P P P P P
Sweet Potatoes UP UP UP UP UP UP
Table sauces P P P P UP P
Take-home ice cream P P P P P P
Tomato pastes and purees P P P P UP P
Sci
O p e n H U B f o r S c i e n t i f i c R e s e a r c hForschen
Open Access
Appendix 2: Classification framework definitions and food examples. Adapted from: Eicher-Miller, Fulgoni [12], Asfaw [13], Poti, Mendez [15], Slimani,
Deharveng [16], Chajès, Biessy [17], Moubarac, Parra [21], Food Standards Australia New Zealand [23], International Food Information Council Foundation [24], Monteiro, Levy [25]
Framework Definition/description Food examples
FSANZ CLASSIFICATION
Not processed Not defined
-Processed “Food, which has undergone any treatment resulting in a substantial change in the original state of the food”.
Processes such as dividing, parting, severing, boning, mincing, skinning, paring, peeling, grinding, cutting, cleaning, trimming, deep-freezing or deep-freezing, milling or husking, packing or unpacking are not considered to result in a substantial change to the original state of the food
-IFIC CLASS-IFICATION
Minimally processed Foods that require processing or production Bagged salads, ground coffee beans, washed and packaged fruit and vegetables
Foods processed for
preservation Foods processed to help preserve and enhance nutrients and freshness of foods at their peak Frozen fruit and vegetables, canned fruit (natural juices), vegetables (natural juices) and fish (water or oil)
Mixtures of combined
ingredients Foods that combine ingredients such as sweeteners, spices, oils, flavours, colours and preservatives to improve safety and taste and/or add visual appeal; does not include “ready-to-eat” foods listed below
Dressings and pre-made sauces, powder mixes such as cake mixes, gravy mixes, mashed potato powder; spice-rubs
Ready-to-eat processed Ready-to-eat foods needing minimal or no preparation Luncheon meats, cheese spreads, nut spreads, cookies and biscuits, ice cream, yoghurt, breakfast cereals and flavoured oatmeal (‘quick oats’), fruit drinks and carbonated beverages
Prepared foods/meals Foods packaged to stay fresh and save time Deli foods, frozen meats, pies and pizzas
NOVA CLASSIFICATION
Unprocessed Of plant origin or animal origin, shortly after harvesting, gathering
slaughter or husbanding Fresh fruit, vegetables, legumes, grains, pulses, fungi, unsalted nuts and seeds, eggs
Minimally processed Unprocessed foods altered in ways that do not add or introduce any substance, but they may involve subtracting parts of the food in ways that do not significantly alter affect its use. Minimal processes include cleaning, scrubbing, washing, hulling, peeling, grinding, grating, squeezing, skimming, boning, pasteurisation, chilling, freezing, malting, fermenting etc.
Chilled, frozen, vacuum-packed fruit and vegetables, frozen or dried beans, legumes, fungi; freshly prepared or pasteurised non-reconstituted fruit juices, plain yoghurt, pasteurised full-fat and skimmed milk, yoghurt, coffee, teas
Processed culinary
ingredients Food products extracts and purified by industry from constituent of foods, or else obtained from nature, such as salt. Specific processing include pressing, milling, pulverising, stabilising or purifying.
Plant oils, animal fats, sugars and syrups, starches and flours, uncooked ‘raw’ pastas made from flour and water, salt
Tortilla/corn chips P UP P P P P
UHT soup P P P P P P
Vegetables and seed oil P UP UP P UP UP
Vinaigrettes P P P P UP P
Wet/cooking sauces P P P P UP P
Yeast-based spreads P P P P UP P
Sci
O p e n H U B f o r S c i e n t i f i c R e s e a r c hForschen
Open Access
Framework Definition/description Food examples
Processed ready-to-consume
products Manufactured by adding substances like oil, sugar or salt to whole foods to make them durable and more palatable and attractive. Directly derived from foods and recognisable as versions of the original foods. Generally produced to be consumed as part of meals or dishes, or may be used, together with ultra-processed products to replace food-based freshly prepared dishes and meals. Processes include canning and bottling using oils, sugars, syrups or salt, and smoking , salt-pickling
Canned or bottled vegetables and legumes preserved in brine, peeled or sliced fruits preserved in syrup; salted nuts; canned fish in oil, cheese, un-reconstituted processed meat and fish such as ham, bacon, smoked fish
Ultra-processed
ready-to-consume products Formulated mostly or entirely from substances derived from foods. Typically contain little or no whole foods. Durable, convenient, accessible, highly or ultra-palatable, often habit-forming. Typically not recognizable as versions of foods, although may imitate the appearance, shape and sensory qualities of foods. Many ingredients not available in retail outlets. Some ingredients directly derived from foods, such as oils, fats, flours, starches, and sugar. Others obtained by further processing of food constituents. Numerically the majority of ingredients are preservatives; stabilizers, emulsifiers, solvents, binders, bulkers; sweeteners, sensory enhancers, colours and flavours; processing aids and other additives. Bulk may come from added air or water. Micronutrients may ‘fortify’ the products. Most are designed to be consumed by themselves or in combination as snacks. They displace food-based freshly prepared dishes, meals. Processes include hydrogenation, hydrolysis; extruding, molding, reshaping; pre-processing by frying, baking
Chips (crisps), sweet, fatty or salty snack products, ice-cream, chocolates, confectionery, burgers, hot dogs, fries (potato), poultry and fish ‘nuggets’ or ‘sticks’, breads, buns, cookies, biscuits, breakfast cereals, pastries, cakes, cake mixes, preserves/jams, margarines, pre-prepared desserts, pre-made soups, noodles, sauces, carbonated beverage, ‘energy’ drinks; flavoured milk drinks, condensed milk, flavoured yoghurts; fruit drinks, instant coffee, cocoa drinks, pre-prepared meat, fish, vegetable, cheese, pizza, pasta dishes; infant formulas, ‘health’ and/or ‘slimming’ products
IARC-EPIC CLASSIFICATION
Non-processed Foods consumed raw without any further processing, preparation,
except washing, cutting, squeezing Raw fruits, non-processed nuts, fresh raw vegetables, fresh grated vegetables, raw crustaceans/molluscs, fresh milk, fresh whole cream, raw meat, eggs, honey
Processed staple/basic Foods industrially prepared involving high degree of processing such as drying, flaking, hydrogenation, heat treatment, use of industrial ingredients and industrial deep frying. Includes foods from bakeries and catering outlets requiring no or minimal domestic preparation apart from heating and cooking.
Bread, pasta, rice, milk, butter, vegetable oils
Moderately processed Industrial and commercial foods involving relatively modest processing
and consumed with no further cooking Dried or semi-dried fruits, nuts, seeds, vacuum packed meat/salads, canned fruit (natural juices), canned vegetables (natural juices), green andchamomile tea, extra virgin olive oil, frozen meat
Highly processed Foods industrially prepared involving high degree of processing such as drying, flaking, hydrogenation, heat treatment, use of industrial ingredients and industrial deep frying. Includes foods from bakeries and catering outlets requiring no or minimal domestic preparation apart from heating and cooking.
Cakes, biscuits, cookies, breakfast cereals, confectionery, processed meat, processed fish, yoghurt, cheese, cream, crisp bread
IFPRI CLASSIFICATION
Unprocessed Not defined Staple foods, corn, grains, roots, tubers, beans,
vegetables, fruits, meats, fish, eggs, fresh milk, fresh cream, dried milk
Partially processed Not defined Evaporated milk, condensed milk, cheese,
yoghurt, lard, butter, corn-based products (tortillas)
Highly processed Foods that have undergone secondary processing into readily edible
Sci
O p e n H U B f o r S c i e n t i f i c R e s e a r c hForschen
Open Access
Framework Definition/description Food examples
POTI & MENDEZ CLASSIFICATION
Unprocessed/minimally
processed Single-ingredient foods with no or very slight modification that do not change inherent properties of the foods as found in its natural form Fresh plain milk, coffee, bottled plain water, tea (leaves or bags), fresh, frozen or dried plain fruit, vegetables or legumes; plain nuts; eggs, unseasoned meat (refrigerated or frozen); whole-grain plain hot cereal, brown rice, popcorn kernels, cream, honey, herbs, spices, pepper
Processed basic ingredients Single isolate food components obtained by extraction or purification using physical or chemical processed that change inherent properties of the food
Unsweetened fruit juice (not from concentrate), egg whites, whole-grain flour, whole-grain pasta, oil, unsalted butter, sugar, pure maple syrup, salt Processed for basic
preservation or pre-cooking Single minimally processed foods modified by physical or chemical processed for the purpose of preservation or precooking but remaining as single foods
Unsweetened fruit juice (from concentrate), dried milk, instant coffee, unsweetened/unflavoured canned fruit, or legumes; unsweetened/unsalted peanuts butter, unseasoned canned meat; refined-grain pasta, flour; white rice, instant rices, plain refined-grain hot cereal, sour cream, plain yoghurt, evaporated milk
Moderately processed for
flavour Single minimally or moderately processed foods with addition of flavour additives for the purpose of enhancing flavour; directly recognisable as original plant/animal source
Sweetened/flavoured fruit or vegetable juice, tea, or soy milk; chocolate milk; cocoa mix Sweetened/flavoured canned, dried, refrigerated, or frozen fruit, vegetables or legumes; jam; potato chips; frozen French fries; salted peanut butter; nuts with salt or oil, seasoned refrigerated, frozen, or canned meat; smoked or cured bacon, ham, or seafood Sweetened/ flavoured hot cereal, flavoured pasta, flavoured popcorn, cheese, sweetened/ flavoured yogurt, sweetened condensed milk, whipped cream Salted butter, flavoured oil, seasoning salts
Moderately processed grain
products Grain products made from whole-grain flour with water, salt, and/or yeast Whole-grain breads, tortillas, crackers, or ready-to-eat cereals with no added sugar or fat Highly processed ingredients Multi-ingredient industrially formulated mixtures processed to the
extent that they are no longer recognizable as their original plant/ animal source and consumed as additions (condiments, dips, sauces, toppings, or ingredients in mixed dishes
Tomato sauce, salsa, hummus, jelly, bread crumbs/breading with refined grains or added sugar/fat Creamer, whipped topping, dairy-based chip/veggie dip, cheese dip/queso, alfredo sauce, margarine; mayonnaise; salad dressing; shortening; pancake syrup; artificial sweetener; baking chocolate; icing; ketchup, barbecue sauce, marinades, and other condiments; sauce/ seasoning mixes
Highly processed stand-alone Multi-ingredient industrially formulated mixtures processed to the extent that they are no longer recognizable as their original plant/ animal source and not typically consumed as additions
![Table 2: Proportion of 135 food categories with the same designation (processed or unprocessed) for each pair of classification frameworks****Food groups used for assessment were the 135 food groups defined in the Euromonitor 2011 ‘Who Eats What Report’ which covers the main sources of packaged and unpackaged foods across 80 countries [22]](https://thumb-us.123doks.com/thumbv2/123dok_us/8436074.1699536/4.595.305.572.89.203/proportion-categories-designation-unprocessed-classification-frameworks-euromonitor-unpackaged.webp)