Hybrid Simulation of a High-Beta Linear Plasma Column Applied
with a Low Frequency Wave
∗
)
Takahiro URANO, Toshiki TAKAHASHI, Akiyoshi HOSOZAWA
1), Tomohiko ASAI
1)and Shigefumi OKADA
2)Graduate School of Science and Technology, Gunma University, Kiryu 376-8515, Japan
1)College of Science and Technology, Nihon University, Tokyo 101-8308, Japan 2)Osaka University, Suita 565-0871, Japan
(Received 25 September 2018/Accepted 13 December 2018)
Wave excitation and propagation by applying a low frequency wave to a high-beta plasma are simulated by a 3-dimensional hybrid model, where ions are treated as particles while electrons are regarded as fluids. It is found that excitation of the toroidal magnetic field occurs outside the separatrix and the wave attenuated significantly near the separatrix. Although the attenuation due to an ion cyclotron resonance is conceivable, no temperature rise in the resonance region is observed. The attenuation condition is given here on the basis of a linear theory, and it shows a good agreement with hybrid simulation results in terms of the attenuation position.
c
2019 The Japan Society of Plasma Science and Nuclear Fusion Research
Keywords: high-beta, field-reversed configuration, hybrid simulation, low frequency wave, wave propagation DOI: 10.1585/pfr.14.2403022
1. Introduction
Field-Reversed Configurations (FRCs) [1] have a closed and an open magnetic field regions which are sepa-rated by the boundary that is so-called separatrix. An ex-tremely high-beta plasma is confined inside it. The FRCs’ singly connected structure is advantageous because of eas-ier maintenance of confinement structural materials and natural diverter that enables a direct energy conversion of high energy fusion products. Therefore, several concep-tual studies of compact fusion reactors have been carried out based on the FRC plasmas [2, 3].
Although the configuration lifetime of the FRC was as short as about several hundreds of microseconds in ear-lier experiments, the recent FRC researches done at TAE Technology show successful extension of the lifetime by several heating and control techniques, such as NBI [4].
While the lifetime has prolonged, the heating effect by NBI is mainly based on electron heating [5]. Since the temperature equilibration time is longer than that of FRC, ion heating effect is small. For this reason, attention is be-ing paid to a low frequency wave excitation [6–8] as an ion heating technology. The FRC has a field null point inside the plasma, and the resonance surface is narrow because of the high non-uniformity of the magnetic field, and it is said that it is not suitable for wave heating such as ion cyclotron range of frequencies (ICRF) heating. In addition, since the plasma core region has a field-null circle, the plasma size and ion radius are almost comparable. So far, the effect of wave application to the FRC is not clearly understood. author’s e-mail: [email protected]
∗)This article is based on the presentation at the 12th International
Con-ference on Open Magnetic Systems for Plasma Confinement (OS2018).
Low frequency wave application to the FRC was stud-ied by Osaka University’s FIX device [6, 7]. Excitation of the toroidal magnetic field (Bθ) has been confirmed in the experiment. The measured phase velocity ofBθsuggested the shear Alfvén wave was excited outside the separatrix and the ion acoustic wave inside the separatrix. In addition, an increase in ion temperature was observed by application of the wave. Iwasawaet al.analyzed the linear wave prop-agation considering two-fluid effects for the experiment in the FIX and pointed out the possibility of heating by the transit-time magnetic damping [9].
In order to clarify the characteristics of a low fre-quency wave applied to an FRC, we carried out a hybrid simulation in which ions in plasma are regarded as parti-cles and electrons are regarded as fluid.
2. Simulation Model
2.1
Target plasma structure and simulation
region
A real FRC has a spatial variation in the axial direc-tion, however in our present study we assumed an axially uniform FRC by extending the midplane profile in the ax-ial direction in order to simply analyze the wave applied to the high beta plasma. The plasma shape and the simulation region are shown in Fig. 1. Here, we call this configuration as a high-beta linear plasma column. The equilibrium state is obtained from the Grad-Shafranov equation. The radial distribution of the equilibrium state is shown in Fig. 2. In this simulation, a 3-dimensional (3-d) Cartesian coordinate system is adopted. The reason for this is that generation of numerical noises near the device axis (r=0) is avoided by
c
2019 The Japan Society of Plasma
Fig. 1 Plasma shape and simulation region. rs is separatrix ra-dius.rANTis antenna radius. The yellow arrow represents the direction of the magnetic field and the black broken line represents the field null point.
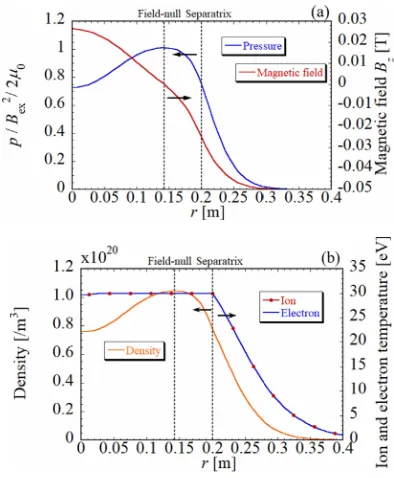
Fig. 2 Radial distributions of (a) plasma pressurepand mag-netic fieldBz, (b) densityni,neand temperature at equi-librium. Here,Bexis the external magnetic field (0.05 T), μ0 is the vacuum permeability. Ion (Electron) temper-ature Ti, Te = 30 eV, Ion (Electron) density ni, ne = 1.05×10²⁰m−3.
employing the Cartesian coordinate system. In addition, the periodic boundary condition is adopted at the device end.
2.2
Calculation model
We performed a 3-d hybrid simulation. Here, ions are treated as weighted super-particles, and electrons are han-dled as a fluid without mass. We need to take into account the electromagnetic field generated from the antenna. The set of equations including the antenna component is as fol-lows:
Bt=Bp+BANT, (1)
Et=−ue×Bt−∇
pe
ene
+Rei
ene
, (2)
−∂Bt
∂t =∇ ×Et, (3)
∂pe
∂t =−γpe(∇ •ue)−ue• ∇pe
+(γ−1)Rei•
jp
ene
−(γ−1)Qi, (4)
jp=
1
μ0∇ ×
Bp, (5)
ue=ui−
jp
ene.
(6) Here,Btis the total magnetic field including the antenna
component, Bp is the magnetic field only of the plasma,
BANTis that of the antenna,Etis the total electric field,ui
andueare the ion and electron flow velocity respectively,
pe is the electron pressure,eis the elementary charge,ni
andne are ion and electron density respectively. In this
calculation the charge neutralityni =neis assumed. The
frictional forceReiis taken into account for the electronic
fluid by collision with ions. Further, t is the time, γis the heat capacity ratio,Qiis the heat generation term, and
jpis the plasma current density, respectively. The
Runge-Kutta method is used for the time integration of Eqs. (3) and (4). The ion flow velocity and density are obtained by tallying ion particle trajectory calculation results by the PIC method. The equation of motion of ions is
mi
dvi
dt =qi(Et+vi×Bt). (7)
Here, mi is the ion mass, vi is the ion velocity for
indi-vidual particles, andqi is the ion charge. The collision
processes are reproduced by the Grid-based coulomb col-lision model [10]. A time step of particle tracking chosen here is 1/100 of the gyration time at the external magnetic field. Therefore, the ion cyclotron resonance effect is auto-matically included in the trajectory calculation result.
2.3
Antenna model
Next, the setting of the antenna to excite the wave will be described. We install the antenna as a loop antenna at (r,z) = (0.25 m,0 m); it is shown in Fig. 1. The antenna current is given by a damped sinusoidal wave with the maximum value of 1 kA and the frequency of 80 kHz. The current waveform is shown in Fig. 3. The maximum value of the magnetic field generated from this antenna current is about 10 mT on the symmetric axis, which is about 1/5 of the external magnetic field.
3. Results and Discussion
Fig. 3 Waveform of the antenna current.
Fig. 4 Temporal change of toroidal magnetic field (antenna fre-quency 80 kHz), x-z plane (y = 0). upper illustration: 10µs, middle illustration: 20µs, under illustration: 30µs. The separatrix position in the figure is the value in the equilibrium state.
The difference in the toroidal field due to the presence or absence of the wave is shown in Fig. 4. Unless otherwise specified, results of such processing are shown and the dif-ferences in the magnetic and electric fields are denoted by
˜
Band ˜Ehereafter. From Fig. 4, the toroidal field excited from the vicinity of the antenna mainly propagates in the axial direction with time.
From experiments in the FIX device [6, 7], it is sug-gested that the shear Alfvén wave
vφ= √Bμ
0ρ
1−(ω/ωci)2
1/2
(8) is excited outside the separatrix and propagates along the field line. Here,Bis the local magnetic field strength,ρis the ion mass density,ωis evaluated with the antenna fre-quency (2πfANT), andωci is the ion cyclotron frequency.
On the other hand, the propagation velocity inside the
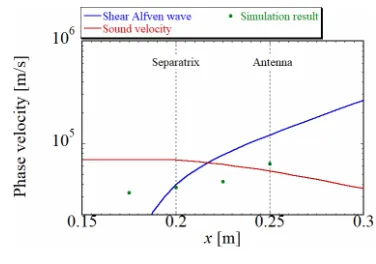
sep-Fig. 5 Axial propagation velocity. The blue line is the shear Alfvén wave and the red line is the sound velocity wave.
aratrix is in good agreement with the sound velocity of the plasma represented by
vs=
kB(γeTe+γiTi)
mi
. (9)
Here, kB is the Boltzmann’s constant, γe,i is the specific
heat ratio of electrons and ions (γe,i=5/3).
To compare with experimental results, the axial propa-gation velocity (the direction of the magnetic line of force) of the wave was evaluated from our simulation results. The propagation velocity is obtained from the time until the toroidal magnetic field generated from the antenna reaches the end of the device. It was evaluated at four different ra-dial positions between the inside of the separatrix and the antenna position, and the results are shown in Fig. 5. Note that the radial position on the horizontal axis ranges from the field-null point to the outside of the antenna. For com-parison, the profiles of the shear Alfvén velocity and the sound velocity are also shown in Fig. 5. It can be seen that the propagation speed of simulation result is faster outside the separatrix and slower as it approaches the separatrix. The propagation speed of the wave obtained by the sim-ulation is about half as compared with the shear Alfvén velocity and the sound velocity. As for the difference in the phase velocity, we consider that the plasma shape in this simulation are different from the conditions of a real FRC, so it does not necessarily agree with the experimen-tal result.
Fig. 6 Radial distribution of toroidal magnetic field at z =
0.25 m (antenna frequency 80 kHz). The separatrix po-sition in the figure shows the popo-sition at the equilibrium state.
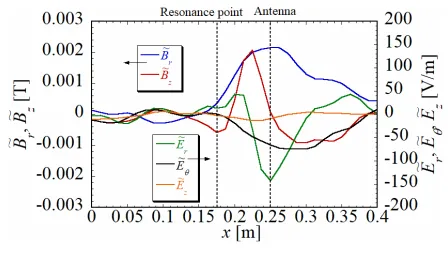
Fig. 7 Radial distribution of electromagnetic field at 10µs (z=
0.25 m). The resonance point in the figure is calculated from the magnetic field at 10µs.
Figure 7 shows the radial distribution of electromag-netic fields except for ˜Bθ at 10µs. The observation point here is the same as in Fig. 6. It is seen that, similarly to ˜Bθ, the amplitude is larger outsidex=0.2 m and smaller on the inner side. From Figs. 6 and 7, the amplitude of the mag-netic field is almost the same among the components. The value is about 2 mT, which is about an order of magnitude smaller than the external magnetic field (0.05 T). The am-plitude of the electric field varies depending on the compo-nent. ˜Ezis small both inside and outside the separatrix This
will be explained below. Substituting the electron flow ve-locity into the equation of the electric field in Sec. 2.2, we obtain
Et=−ui×Bt+
j×Bt
ene
−∇pe
ene
+Rei
ene
. (10)
In this ideal MHD expression, since the equilibrium mag-netic fields Br and Bθ are zero, Ez is not generated as a
linear wave. In other words, we can say that it is rela-tively close to the ideal MHD model in the vicinity of the antenna outside the separatrix. In addition, we see that the amplitudes decrease at the location slightly outside the res-onance point.
The possibility of the ion heating by the ion cyclotron resonance heating will be discussed hereafter. Figure 8
Fig. 8 Temporal change of ion temperature at z = 0.25 m (y=0 m). Since the magnetic field profile changes with time, the resonance point also changes. The range of the change is indicated by a broken line in the figure.
Fig. 9 Relationship between left and right side in Eq. (11).
shows the temporal change of ion temperature at z =
0.25 m. The red dashed line gives the range where the time-varying resonance point exists within 35.4µs shown in Fig. 8. It can be seen that noticeable temperature in-crease is not seen in the region between the two dashed lines. The ion temperature is only fluctuating, and no in-crease is found in this region.
Ignoring the dissipation phenomenon in the plasma and linearizing the equation of the hybrid simulation model, when the condition
ω k// =
VA
1+c2k2
///ω2pi
(11)
is satisfied, the fluctuation component of the toroidal mag-netic field ˜Bθsatisfies a condition that does not generate the oscillation of the radial direction component ˜Erof the
electric field. Here,k// is the wave number in the direc-tion of the magnetic force line,VAis the Alfvén velocity,
cis the light velocity, andωpi is the plasma frequency of
the ion. Based on the simulation results, since the wave-length in the region where the amplitude is attenuated is approximately 0.5 m, it can be evaluated ask// =4πm−1.
From this study, we observed the radial distribution of the axial phase velocity of the excited wave. It was also found that the waves propagated in the radial direction at-tenuated near the separatrix. Although the ion cyclotron resonance has been considered, no rise in ion temperature, however, was observed. As a result of analysis based on linear theory, the condition that the toroidal magnetic field attenuates near the separatrix was suggested.
4. Summary
We have carried out a simulation of applying low fre-quency wave motion to high beta plasma by using 3 dimen-sional hybrid simulation model. As a result, it was found that the toroidal magnetic field was excited by the applied low frequency wave, which propagated in the axial and ra-dial directions. The propagation velocity in the axial direc-tion is several tens km/s, and it is faster for largerr. The axial propagation velocity was different from the phase ve-locity suggested by the FIX device [6, 7]. This disagree-ment could be due to the inconsistency between the plasma
shape of a real FRC and that assumed in this simulation. In the future, we will be a challenge to conduct simulation ac-cording to a real FRC. In addition, the excited wave atten-uated near the separatrix. The cause was thought to be ion cyclotron resonance, but heating effect was not observed. As a result of analysis based on linear theory, the condition that the excited toroidal magnetic field attenuates near the separatrix was derived. Further deepening analysis by this linear theory is also a future subject.