TOTAL FACTOR PRODUCTIVITY OF COMMERCIAL
BANKS IN THAILAND
Supachet Chansarn♣
Bangkok University
♣ Corresponding Author: Supachet Chansarn, Assistant Professor, School of Economics, Bangkok University, Thailand. Phone:
+668-1733-5448. Fax: +662.650-3690. Email: supachet.c@bu.ac.th ABSTRACT
This study employed growth accounting equation to examine the total factor productivity of 14 commercial banks in Thailand during 2000 – 2009. The findings revealed that commercial banks in Thailand on average had low and very volatile total factor productivity with the average total factor productivity growth rate ranging from -13.35 – 10.06 percent per annum. In terms of individual bank, the findings revealed that most of commercial banks had the negative average total factor productivity growth rate during the study period, implying their lower productivity. In addition, the findings suggested that there were four factors which significantly determined the total factor productivity growth of commercial banks. They were credit risk as measured by the percentage of loan to total asset, management quality as measured by the percentage of non-interest expense to total asset, diversification as measured by the percentage of non-interest income to total asset and capital adequacy as measured by the percentage of owners’ equity to total asset. Furthermore, small commercial banks were found to have the highest total factor productivity growth whereas large banks were found to have the lowest one.
Keywords: Total Factor Productivity; Commercial Bank; Banking Sector; Thailand.
1. INTRODUCTION
to have the greatest human capital due to the highest mean years of schooling of its employees which equaled 14.4 years in 2009 (National Statistical Office, 2012).
Since commercial banks are the primary source of deposits, loans and employment for the nation, it is sensible to conclude that the productivity of banking sector is very important to the national production, consumption and employment and also the financial stability of households and businesses. That is, if commercial banks are not productive and end up with insolvency, households will certainly suffer from money loss and financial instability. Meanwhile, businesses are troubled by illiquidity problem as they will find it far tougher to
obtain credits from commercial banks. Such a problem may cause businesses to downsize
or even end up with bankruptcy. Additionally, as households are facing financial instability due to the low productivity of commercial banks, they are likely to consume less, causing the diminishing aggregate demand. Moreover, businesses with illiquidity problem are likely to
downsize and lay off their employees, leading to the rising unemployment. The decreasing
aggregate demand and the rising unemployment will eventually lead the nation to the financial and economic crisis. These situations were actually happened in Thailand during the economic crisis in 1997 all because of the low productivity of Thailand’s commercial banks (Sussangkarn & Vichyanond, 2007).
Prior to the crisis, mainly due to poor governance, most of commercial banks in Thailand had enormous sub-prime loans (loan of which value exceeds the value of the collateral) and inappropriate lending (borrowing short term but lending long term) provided to real estate sector, causing the enormous non-performing loans (NPLs) in banking sector. These problems caused the productivity of Thailand’s commercial banks to constantly decline, leading to the insolvency of several commercial banks and finally the financial crisis (Sussangkarn & Vichyanond, 2007). Moreover, the crisis then caused households to suffer from money loss and brought the illiquidity problem to businesses so that several businesses ended up with bankruptcy. This caused the diminishing aggregate demand and the higher unemployment, leading to the economic crisis at the end (Sussangkarn & Vichyanond, 2007).
The economic crisis is the vital lesson that commercial banks in Thailand need to constantly promote their productivity in order to prevent such a financial crisis in the future. However, in order to carry out the appropriate policy formulation and implementation to promote their productivity in both short and long runs, it is very necessary for commercial banks to have the information about the situations regarding their productivity and its determinants. That makes the study on the productivity of commercial banks very important because it provides the useful insight regarding their productivity, enabling the appropriate policies and their higher productivity.
included. The second section in the paper will present the literature review, thereafter data and sources and analytical method will be explained in the third and fourth section, respectively. Empirical results and discussion will be presented in the fifth and sixed section, respective, whereas the last section summarizes the study.
2. LITERATURE REVIEW
Total factor productivity (TFP) is generally defined as a measure of the overall effectiveness with which the economy uses capital and labor to produce output (Bernanke et al., 2008). As this term is applied to the case of commercial banks, TFP is defined in this study as a measure of the overall effectiveness with which the commercial banks utilize inputs to produce output. Based on this definition of TFP, TFP growth simply measures output growth which is caused by productivity growth of all inputs of production. In other words, it measures output growth which cannot be explained by inputs growth (Bernanke et al., 2008). Additionally, TFP growth reflects the better management quality and the technological progress of commercial banks, enabling them to produce more output with the same amount of inputs (Chansarn, 2007). TFP growth can be measured by various techniques. According to the literature review, Malmquist productivity index is one the most popular technique to measure TFP growth. Such
index is mostly estimated by Data Envelopment Analysis (DEA)1. This technique was utilized
to measure TFP growth of commercial banks in several countries such as Thailand (Lightner & Lovell, 1998; Sufian, 2011a; Ngo & Nguyen, 2012), Turkey (Isik & Hassan, 2003), France, Germany, Italy, United Kingdom (Fiordelisi & Molyneux, 2010), Malaysia (Sufian, 2011b) and India (Sanyal & Shankar, 2011). Additionally, several new and more advanced methods were developed to compute Malmquist productivity index. For example, bootstrap Malmquist productivity was employed by Matthews & Zhang (2010) to investigate China banking sector’s TFP growth whereas generalized Malmquist productivity index was employed by Rezitis (2008) in case of Greek banks.
The standard DEA model was also employed to investigate the productivity growth of commercial banks. For example, Sufian & Habibullah (2010) employed BCC DEA model with the assumption of variable return to scale to measure productivity of commercial banks in Thailand during 1999 – 2008 while Ngo & Nguyen (2012) employed CCR DEA model with the assumption of constant return to scale to investigate productivity of banks in Thailand during 2007 – 2010. The input slack-based productivity index is another non-parametric technique to investigate TFP growth which employed by Chang et al. (2012). Furthermore, the financial ratio was also employed to measure the productivity of commercial banks (Chotigeat, 2008). Based on the literature review, growth accounting framework is also widely adopted to measure TFP growth. For instance, Chansarn (2007) employed growth accounting framework
1 Data Envelopment Analysis (DEA) is a non-parametric analytic technique for analyzing the relative efficiency of decision making
to measure TFP growth of Thai banking sector during 1998 – 2004 while Athanasoglou et al. (2009) utilized growth accounting framework to measure TFP growth of Greek banks during 1990 – 2006. In addition, growth accounting framework was employed to measure TFP growth in several studies such as OECD (2001), Uppenberg & Strauss (2010) and Moro & Nuno (2012). Besides growth accounting framework, productivity growth also can be estimate by Stochastic Frontier Analysis (SFA) (Margono et al., 2010) and by a new and advanced output distance function (Rangkakulnuwat & Wang, 2011). Other parametric techniques were also proposed by Nakane & Weintraub (2005) and Fung & Cheng (2010).
Furthermore, there have been several studies focusing on the determinants of productivity growth of commercial banks (Girardone et al., 2004; Havrylchyk, 2006; Kosmidou et al., 2007; Delis & Papanikolaou, 2009; Kirkpatrick et al., 2008; Sufian, 2009; Tecles et al., 2010). They found that the productivity of commercial banks was generally determined by liquidity as measured by the ratio of total loans to total assets, loan quality as measured by the ratio non-performing loans to total loans, asset quality as measured by the ratio of loan loss provision to total loans, management quality as measured by the ratio of non-interest expenses to total assets, diversification as measured by the ratio of non-interest incomes to total assets and capital adequacy as measured by the ratio of owners’ equity to total assets. Moreover, Sufian & Habibullah (2010) and Sufian (2011a) found that productivity of commercial banks in Thailand was determined by total asset in logarithm form, ratio of loan loss provision to total loans, ratio of non-interest income to total assets, ratio of non-interest expense to total assets and ratio of owners’ equity to total assets.
In case of Thailand, several studies focusing on TFP of commercial banks have been found. That is, Lightner & Lovell (1998) and Sufian (2011a) employed Malmquist productivity index for measuring TFP growth of banks in Thailand during 1989 – 1994 and 1999 – 2008, whereas Ngo & Nguyen (2012) employed both Malmquist index and DEA model to measure TFP growth of Thai banking sector during 2007 – 2010. Additionally, Chansarn (2007) utilized the growth accounting framework to measure TFP growth of commercial banks in Thailand during 1998 – 2004 while Sufian & Habibullah (2010) utilized DEA to measure TFP growth of banks in Thailand during 1999 – 2008. There was also the study of Rangkakulnuwat & Wang (2011) that employed output distance function to investigate TFP growth of Thai banks during 1999 – 2008.
accept deposits from and provide loans to typical consumers but foreign bank branches focus on foreign businesses located in Thailand. Moreover, domestic banks are subject to Bank of Thailand’s monetary policies but foreign bank branches are not. Such problem is also found in the study of Ngo & Nguyen (2012) that included domestic commercial banks, foreign bank branches and specialized financial institutions. The problem in this study is that, unlike commercial banks, specialized financial institutions are completely controlled and often intervened by the government, causing it not appropriate to compare typical commercial banks with such financial institutions. The inclusion of commercial banks, foreign bank branches and specialized financial institutions in the studies leads to the question regarding the validity of productivity of commercial banks in Thailand as suggested in these studies.
Due to these research gaps, this study aims to measure TFP growth of commercial banks in Thailand and also examine its determinants. Additionally, only full service commercial banks which are registered in Thailand are included in the study, excluding foreign bank branches and specialized financial institutions. In terms of the measurement, this study employs growth accounting equation to measure TFP growth of commercial banks because this technique is the absolute measurement of TFP growth whereas Malmquist productivity index computed by DEA is the relative measurement. More clearly, relative measurement compares productivity of each commercial bank against the best practice banks within the sample, causing it very sensitive to outliers and to change as new banks are added to the sample (Fu & Heffernan, 2007). Consequently, this study will fill the research gaps in the existing studies and provide more useful insight regarding TFP growth of commercial banks which benefits the policy formation and implementation to improve their productivity.
3. DATA AND METHODOLOGY
This study relies on the unbalanced panel data of 14 full service commercial banks registered
in Thailand as reported by Bank of Thailand (2010) during 2000 – 20092, totally 107
firm-years. They are divided into three groups according to their size3. There are four large banks,
including Bangkok Bank, Krung Thai Bank, Kasikorn Bank and Siam Commercial Bank. There are four medium banks, including Bank of Ayudhya, TMB Bank, Thanachart Bank and Siam City Bank. Finally, there are six small banks, including Kiatnakin Bank, CIMB Thai
Bank4, Tisco Bank, UOB Bank, Standard Chartered Bank (Thai) and ICBC Thai Bank5.
2 Data of Thanachart Bank cover 2003 – 2009 since it started operating as commercial bank in 2002. Data of Kiatnakin Bank, Tisco
Bank and ICBC Thai Bank cover 2006 – 2009 since they started operating as commercial bank in 2005. Data of UOB Bank cover 2006 – 2009 since it started operating as UOB Bank in 2005 after the merger between UOB Rattanasin Bank and Asia Bank. Finally, data of Standard Chartered Bank (Thailand) cover 2006 – 2009 since it started operating as Standard Chartered Bank (Thai) in 2005 after the merger between Standard Chartered Bangkok Branch and Standard Chartered Nakornthon Bank in 2005.
3 Large bank includes commercial banks with market share of total assets not less than 10 percent, medium bank includes commercial
banks with market share of total assets not less than percent but less than 10 percent and small bank includes commercial banks with market share of total assets less than 3 percent (Bank of Thailand, 2010).
4 CIMB Thai Bank is formerly Bank Thai. It was acquired by CIMB Bank Berhad of Malaysia and became CIMB Bank on May 4,
2009.
Data used to measure TFP growth of commercial banks in Thailand include total revenues, property, premise and equipment expenses, personnel expenses, interest expenses and consumer price indices. In addition, data utilized to investigate the determinants of TFP growth include total loans, total assets, non-performing loans, loan loss provisions, non-interest expenses, non-interest incomes, net profit and owners’ equity. All data except consumer price indices, which are obtained from the Ministry of Commerce, are extracted from the statements of financial position and the statements of comprehensive income as reported in the annual reports of each commercial bank.
This study examines TFP growth of commercial banks under the production approach which reflects the way of evaluating the productivity of commercial bank as profit maximizing entities which utilize inputs to generate outputs (Chansarn, 2008). The analytical method in this study is divided into two sections. The first section explains to method to measure TFP growth of commercial banks in Thailand whereas the latter presents the method to examine its determinants.
3.1. The Analysis of Total Factor Productivity Growth of Commercial Banks in Thailand Based on the literature review (Havrylchyk, 2006; Fu & Heffernan, 2007; Chansarn, 2008), output of commercial banks is measured by total revenues whereas their inputs include (1) capital as measured by property, premise and equipment expenses, (2) labor as measured by personnel expenses and (3) funding as measured interest expenses. Additionally, the growth accounting equation modified from Bernanke et al. (2008) is utilized to calculate the TFP growth rate as the following formula.
where Q = total revenues
K = property, premise and equipment expenses L = personnel expenses
E = interest expenses
A = total factor productivity (TFP)
α = elasticity of total revenues with respect to property, premise and equipment expenses, indicating percentage change of total revenues as property, premise and equipment expenses change by one percent
β = elasticity of total revenues with respect to personnel expenses, indicating percentage change of total revenues as personnel expenses change by one percent
γ = elasticity of total revenues with respect to interest expenses, indicating percentage change of total revenues as interest expenses change by one percent Additionally, total revenues and all expenses are in real term as deflated by consumer price index (CPI), of which the base year is 2007. CPI is utilized to calculate real variables in this study thanks to the focus on purchasing power.
(1)
——ΔQ = ——ΔA +α ——ΔK +β ——ΔL +γ ΔE——
Based on the equation (1) above, growth of the total revenues is caused by (1) the growth of inputs, including property, premise and equipment expenses, personnel expenses and interest expenses ( ) and (2) the TFP growth ( ). Therefore, the TFP growth rate can be calculated by the following equation.
——ΔA
A
——ΔK ——ΔL ΔE——
α K +β L +γ E
(2)
——ΔA = ——ΔQ -α ——ΔK -β ——ΔL -γ ΔE——
A Q K L E
Based on the equation (2), the growth rate of total revenues ( ), the growth rate of ——ΔQ
Q
property, premise and equipment expenses ( ), the growth rate of personnel expenses ——ΔK
K
( ) and the growth rate of interest expenses ( ) can be calculated from the available ——ΔL
L ——ΔE E
data of commercial banks. However, the elasticity of total revenues with respect to property, premise and equipment expenses, personnel expenses and interest expenses (α, β and γ) can be calculated by employing the Cobb-Douglas production function (Athanasoglou et al., 2009; Fung & Cheng, 2010) as the following.
(3)
Q = AK αL βEγ
(4) 1nQ = 1nA + α1nK + β1nL + γ1nE +
However, the Cobb-Douglas production function above is not linear, as a result it is linearized by being converted into natural logarithm form. Moreover, dummy variables for commercial banks and years are added into the equation as well in order to analyze the differences of TFP growth among different commercial banks and years. The equation to be estimated is present as the following.
Bi + Wj + μ
13
i=1Σ
9
j=1Σ
After the equation (4) is already estimated, the elasticity of total revenues with respect to property, premise and equipment expenses, personnel expenses and interest expenses (α, β and γ) will be obtained as the regression coefficients of premise and equipment expenses (lnK),
Bi = dummy variable for commercial bank i, i = 1, 2, 3, …., 13
Standard Charted Bank (Thai) is assigned as the base commercial bank since it is the smallest bank in terms of total assets which is not listed in the Stock Exchange of Thailand.
Wj = dummy variable for year j, j = 1, 2, 3,…., 9
personnel expenses (lnL) and interest expenses (lnE). Thereafter, the TFP growth rate of each bank in each year period will be calculated by employing the equation (2) presented above. Then, the total factor productivity of 14 commercial banks will be discussed. They include (1) Bangkok Bank, (2) Krung Thai Bank, (3) Siam Commercial Bank, (4) Kasikorn Bank, (5) Bank of Ayudhya, (6) TMB Bank, (7) Siam City Bank, (8) CIMB Thai Bank, (9) Thanachart Bank, (10) Tisco Bank, (11) Kiatnakin Bank, (12) ICBC Thai Bank, (13) UOB Bank and (14) Standard Chartered Bank (Thai).
3.2. The Analysis of the Determinants of Total Factor Productivity Growth of Commercial Banks in Thailand
This section examines the determinants of TFP growth of commercial banks by utilizing the multiple regression analysis to analyze the relationship between TFP growth rate of commercial banks and the explanatory variables. The regression function to be estimated is as the following.
(5)
y = b0 + b1x1 + b2x2 + ci wi + μ
7
i=1Σ
where i = 1, 2, 3, …,7
The details of each variable are presented in Table 1.
4. EMPIRICAL RESULTS 4.1. Descriptive Statistics of Commercial Banks in Thailand
Table 2 summarizes the descriptive statistics of commercial banks in Thailand during 2000 – 2009. The findings reveal that small, medium and large commercial banks in Thailand are vastly different. That is, large banks, on average, had roughly 5 times greater total revenues, property, premise and equipment expenses, personnel expenses and interest expenses than small banks and about 3 times greater than medium banks. However, as looking at the growth rate of total revenues and all inputs, the findings reveal that medium banks had the highest average growth rate of total revenues during the study period, while those of small and large banks are very close. In addition, large banks also had the lower average growth rate of property, premise and equipment expenses and personnel expenses than both small and medium banks. Furthermore, medium banks were found to have the positive average growth rate of interest expenses while both small and large banks had the negative average growth rate of interest expenses during the study period.
4.2. Total Factor Productivity Growth of Commercial Banks in Thailand
Table 1:
Descriptive of the
Variables Used in the Regression
Analysis
- Medium banks are likely to have higher productivity than small banks which are the base group. Large banks are likely to have higher productivity than small banks which are the base group. An increase in this ratio, implying lower liquidity
, means that funds are
capitalized more efficiently
, leading to higher
TFP
growth.
An increase in this ratio, implying lower loan quality
, means that the greater
proportion of loans are not profitable, leading to lower
TFP
growth.
An increase in this ratio, implying lower asset quality
, means that banks face
higher potential losses on loan, leading to lower
TFP
growth.
An increase in this ratio, implying lower management quality
, means that
banks have poorer management, leading to lower
TFP
growth.
An increase in this ratio, implying better diversification, mean
s that banks can
generate higher income from other sources besides lending, leading to higher TFP
growth.
An increase in this ratio, implying higher profitability
, means that bank can
utilize assets to generate profit more efficiently
, leading to higher
TFP
growth.
An increase in this ratio, implying higher capital adequacy
, means that banks
have higher capital strength, leading higher
TFP
growth.
-Positive Positive Positive Negative Negative Negative Positive Positive Positive
y
TFP
growth rate (%)
x1 Dummy variable for medium commercial bank. That is, x
1
= 1 for medium commercial bank and 0
otherwise
x2
Dummy variable for lar
ge commercial bank.
That is, x
2
= 1 for lar
ge commercial bank and 0
otherwise
w1
Liquidity as measured by the ratio of total loans to total assets
w2
Loan quality as measured by the ratio of non- performing loans to total loans
w3
Asset quality as measured by the ratio of loan loss provision to total loans
w4
Management quality as measured by the ratio of non-interest expenses to total assets
w5
Diversification as measured by the ratio of non- interest incomes to total assets
w6
Profitability as measured by the ratio of net profit to total assets
w7
Capital adequacy as measured by the ratio of owners’
equity to total assets
Description
Variable
Expected Relationship
Table 2:
Descriptive Statistics of Commercial Banks in
Thailand
Notes:
All variables are in nominal terms.
All figures are mean values of each variable during the study period. Moreover
, Q = total revenues, K =
property
, premise and equipment expenses, L
= personnel expenses and E = interest expenses
Small Mean 10,030.23 597.78 1,423.31 3,526.30 3.73 14.33 9.37 -9.08 Std. Dev . 4,608.59 356.43 886.54 1,598.60 7.87 13.20 10.56 10.51 Maximum 16,481.99 1,080.45 2,534.45 6,222.71 15.44 32.65 28.48 9.46 Minimum 3,138.97 116.43 393.39 1,412.14 -6.50 -3.66 -1.40 -21.1 1 Medium Mean 23,241.28 1,567.98 2,938.44 9,767.64 12.91 18.44 20.56 2.37 Std. Dev . 7,755.85 782.79 1,225.94 3,104.22 13.94 20.91 20.55 16.26 Maximum 31,015.94 2,445.30 4,183.21 12,446.28 33.68 49.77 51.26 26.70 Minimum 13,400.44 602.03 1,432.57 5,790.70 4.85 6.79 7.85 -7.13 Lar ge Mean 64,550.70 4,434.67 8,443.99 18,993.33 3.88 8.03 8.00 -8.00 Std. Dev . 14,516.20 1,069.05 1,567.88 5,920.62 2.33 3.66 3.24 2.48 Maximum 86,094.96 5,478.95 10,229.76 27,327.90 5.73 10.79 11.85 -6.12 Minimum 54,931.64 2,944.12 6,771.29 13,954.45 0.53 2.91 4.48 -1 1.63 E Q Q L E Statistics K K L Size Gr
owth Rate (%)
regression equation can explain the variation in total revenues of commercial banks by 98.9 percent. In addition, we find that the regression coefficient of property, premise and equipment expenses is significant at 10 percent level where those of personnel expenses and interest expenses are significant at 5 percent level. As looking the dummy variables of commercial banks, the findings reveal that only dummy variables of CIMB Thai Bank, Tisco Bank, ICBC Thai Bank and UOB Bank are significant at least 10 percent level. Moreover, dummy variables of every year, except year 2001, are significant at least 10 percent level.
Table 3: Statistical Results from the Multiple Regression Analysis of Equation (4)
Constant Constant 3.453* 0.764 - 4.518 0.000
lnK Property, premise and 0.147** 0.079 0.174 1.872 0.065
equipment expenses
lnL Personnel expenses 0.321* 0.091 0.345 3.525 0.001
lnE Interest expenses 0.408* 0.087 0.378 4.691 0.000
B1 Bangkok Bank 0.163 0.132 0.051 1.231 0.222
B2 Krung Thai Bank 0.061 0.110 0.019 0.553 0.582
B3 Siam Commercial Bank 0.151 0.120 0.048 1.259 0.212
B4 Kasikorn Bank 0.089 0.119 0.028 0.748 0.456
B5 Bank of Ayudhya -0.148 0.108 -0.047 -1.364 0.176
B6 TMB Bank -0.166 0.105 -0.052 -1.585 0.117
B7 Siam City Bank -0.152 0.099 -0.048 -1.539 0.128
B8 CIMB Thai Bank -0.378* 0.100 -0.119 -3.768 0.000
B9 Thanachart Bank -0.162 0.112 -0.043 -1.451 0.151
B10 Tisco Bank -0.315* 0.105 -0.065 -3.001 0.004
B11 Kiatnakin Bank -0.047 0.101 -0.010 -0.466 0.643
B12 ICBC Thai Bank -0.404* 0.119 -0.083 -3.388 0.001
B13 UOB Bank -0.335* 0.084 -0.069 -3.983 0.000
W1 Year 2001 0.086 0.058 0.025 1.498 0.138
W2 Year 2002 0.173* 0.062 0.049 2.788 0.007
W3 Year 2003 0.254** 0.075 0.077 3.382 0.001
W4 Year 2004 0.334** 0.108 0.101 3.091 0.003
W5 Year 2005 0.366** 0.107 0.110 3.428 0.001
W6 Year 2006 0.298** 0.070 0.109 4.240 0.000
W7 Year 2007 0.285** 0.077 0.104 3.690 0.000
W8 Year 2008 0.261** 0.094 0.096 2.766 0.007
W9 Year 2009 0.305** 0.127 0.111 2.397 0.019
Observations 107
F-Statistic for overall significance 301.10**
R-square 0.989
P-Value for overall significance 0.000
Notes: Dependent variable is lnQ (total revenues in natural logarithm form); *indicates statistical
significance at 5 percent level and ** indicates statistical significance at 10 percent level.
P-Value Std. Error t-Statistic
Coefficient Standardized Coefficient Label
Based on the estimated equation presented in Table 3, the elasticity of total revenues with respect to property, premise and equipment expenses ( α ) equals 0.147, indicating that one percent increase in property, premise and equipment expenses will lead to 0.147 percent increase in total revenues of commercial banks. The elasticity of total revenues with respect to personnel expenses ( β ) equals 0.321, indicating that one percent increase in personnel expenses will lead to 0.321 percent increase in total revenues of commercial banks. Finally, the elasticity of total revenues with respect to interest expenses ( γ ) equals 0.408, indicating that one percent increase in interest expenses will lead to 0.147 percent increase in total revenues of commercial banks. Consequently, the sum of the elasticity of total revenues with respect to these three expenses ( α + β + γ ) equal 0.876, indicating that commercial banks in Thailand, in average, operate at decreasing return to scale.
In addition, ICBC Thai Bank had the lowest TFP during 2000 – 2009, followed by CIMB Thai Bank, UOB Bank and Tisco Bank, whereas the other 10 commercial banks had a bit higher TFP than these four banks. However, there is no statistically significant evidence that TFP of the other 10 commercial banks are different. Furthermore, based on the regression coefficients of dummy variables of years, TFP of commercial banks in Thailand was constant during 2001 – 2002. Thereafter, TFP of commercial banks constantly increased during 2002 – 2006 before it continually declined during 2007 – 2008. Nevertheless, TFP of commercial banks in Thailand increased again in 2009.
Thereafter, the elasticity of total revenues with respect to all three expenses and the growth rates of total revenues and all three expenses are used to calculate TFP growth rates of 14 commercial banks in Thailand during 2000 – 2009 based on the Equation (2). TFP growth rates of these 14 commercial banks during the study period are presented in Table 4. The findings reveal that the TFP growth rates of overall commercial banks in Thailand during 2000 – 2009 were very volatile. That is, the average TFP growth rates of overall commercial banks ranged from -13.35 to 10.06 percent per annum.
During 2003 – 2004, Thanachart Bank was added into the sample banks. The findings reveal that during this period the average TFP growth rate gradually increased to 5.38 percent per annum. Thereafter, the average TFP growth rate declined to 3.05 percent per annum during 2004 – 2005. Only three banks, including Siam Commercial Bank, TMB Bank and Siam City Bank, had the negative TFP growth rates during this period. The coup d’etat which happened in 2006 severely affected the TFP growth of commercial banks in Thailand, causing the average TFP growth rate during 2005 – 2006 to become negative at -13.35 percent per annum. Additionally, 7 out of 9 banks had the negative TFP growth rates during this period.
There were 14 commercial banks in the study during 2006 – 2007. We find that the TFP growth of commercial banks in Thailand during this period was higher than the previous period but still negative at -1.83 percent per annum. Moreover, 7 out of 14 banks still had the negative TFP growth rates. Unfortunately, the global financial crisis stemming from the sub-prime mortgage loans in real estate business in the US in 2007 caused the TFP growth of commercial banks in Thailand to decrease again during 2007 – 2008 when the average TFP growth rate decreased to -3.19 percent per annum. The findings also show that 10 out of 14 banks had the negative TFP growth rates. Finally, the average TFP growth rate of commercial banks in Thailand became positive at 1.99 percent per annum during 2008 – 2009 when only 4 banks had the negative TFP growth rates.
As considering the TFP growth of individual commercial bank, during 2006 – 2009 when all 14 commercial banks were included in the analysis, Tisco Bank, which is small bank, is considered to have the highest TFP growth during this period thanks to its average TFP growth rate of 10.40 percent per annum. Siam Commercial Bank, which is large bank, is ranked the second thanks to its average TFP growth rate of 3.99 percent per annum, followed by Kasikorn Bank and ICBC Thai Bank which had the average TFP growth rates of 3.01 and 1.96 percent per annum, respectively. Standard Chartered Bank (Thai) and UOB Bank, which are small banks, also had the positive average TFP growth rates during this period which equaled 1.45 and 0.83 percent per annum.
In addition, the other eight commercial banks were found to have the negative average TFP growth rate during 2006 – 2009. First of all, Bangkok Bank, which is large bank, had the negative TFP growth rate of -0.20 percent per annum during this period whereas the other large bank, Krung Thai Bank, had the negative TFP growth rate of -4.98 percent per annum. As looking at medium banks, the findings reveal that all four medium commercial banks had the negative TFP growth rates during 2006 – 2009. That is, Bank of Ayudhya had the average TFP growth rate of -4.78 percent per annum whereas that of TMB Bank equaled -4.31 percent per annum.
Supachet Chansarn 220 T ab le 4: Tot al F ac tor P roduc tivi ty G row th R at es of 14 C om m er ci al B anks in T ha ila nd dur ing 2000 – 2009 M ea
n -25.
7
-18.
4
-12 -16.5 -8.52 -20.1 -6.63 -7.5 -11 - - - -
N ote s: ( 1) Fi gu re s in th e pa re nt he se s ar e th e st an da rd d ev ia tio ns . ( 2) BBL is Ba ng kok B ank, K TB is K rung T ha i B ank, S C B is S iam C om m er ci al B ank, K B A N K is K as ikor n B ank, B A Y is B ank of A yudhya , T M B i s T M B Ba nk , S C IB is S ia m C ity B ank, CI M BT = CI M B T ha i Ba nk , T B ANK = Th an ach ar t B an k, T IS C O is T is co B ank, KK = K ia tna ki n B ank, I C B C T i s IC B C T ha i B ank, U O B is U O B B ank a nd S C B T = S ta nda rd C ha rte re d B ank ( Tha i). 10. 06 9. 61 5. 09 5. 38 3. 05 -13. 4 -1. 83 -3. 19 1. 99 SC B T
- - - -0.6
-1.
19
6.
15 - - - -
1.
45
-4.
08
UO
B - - - - -
-4.
73
6.
03
1.
19 - - - - 0.83 -5.4
ICB
CT - - - - - -
8.7 -8.62 5.8 - - - - 1.96 -9.28
K
K - - - - - -
4. 29 -15. 1 -19. 1 - - - - -9. 97 -12. 5 T IS C O - - - - 1. 35 -1. 28 31.
13 - - - -
10. 4 -18 TBA N K - - - -27. 29 9. 46 13. 81 -9. 05 -3. 67 3.
85 - -
-2. 15 -14. 88 -2. 96 -6. 48 C IM B T 68. 08 -7. 69 -19. 56 -6. 48 9. 79 17. 59 0. 97 -17. 12 -4. 68 4. 54 -26. 58 0. 01 -12. 35 -6. 94 -9. 26 SC IB 21. 29 48. 37 12 -6. 32 -6. 09 -10. 72 -4. 82 -1. 83 1. 72 5. 96 -18. 8 -4. 68 -4. 25 -1. 64 -3. 28 TM B 6. 61 -2. 55 5. 52 17. 19 -8. 05 -12. 03 2. 67 -10. 93 -4. 68 -0. 69 -9. 55 -2. 64 -11. 1 -4. 31 -6 .8 1 BA Y -2. 31 16. 77 10. 91 2. 24 6. 45 -9. 39 -14 -1. 75 1. 43 1. 15 -9. 55 -2. 51 -7. 73 -4. 78 -8. 15 K B
ANK 1.92 6.5
18. 05 4. 25 6.3 -31. 88 3. 55 1. 58 3. 91 1. 58 -13. 48 -2. 05 -14. 69 3. 01 -1. 25 SC B -7. 13 8. 33 6. 81 20. 11 -10. 36 -41. 98 1. 42 7. 84 2. 71 -1. 36 -17. 7 -3 .3 8 -21. 3 3.
99 -3.4
K T B 4. 64 3. 74 2.1 20. 77 7. 82 -9. 15 -10. 88 -0. 15 -3. 91 1. 66 -9. 52 0. 75 -11. 9 -4. 98 -5. 44
BBL -12.66 3.37 4.88 23.96 12.13 -36.41 -4.45 1.58 2.27 -0.59 -16.
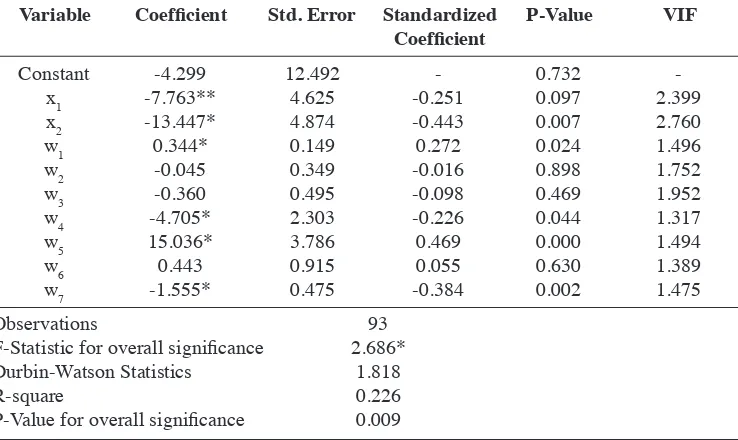
4.3. Determinants of Total Factor Productivity Growth of Commercial Banks in Thailand Table 5 summarizes the analysis of the determinants of TFP growth of commercial banks in Thailand. Based on the results presented in this Table, there appears to be neither
Multicollinearity problem nor Autocorrelation problem. Additionally, the findings reveal that
the regression equation is statistically significant at 5 percent level with F-Stat of 2.686 and it can explain the variation in TFP growth rate of commercial banks by 22.6 percent thanks to the coefficient of determination (R-Squared) equal to 0.226.
Table 5: Results from the Analysis of the Determinants of TFP Growth Rate of Commercial Banks in Thailand
Notes: (1) Dependent variable is TFP growth rate (y)
(2) * indicates the statistical significance at 5 percent level and ** indicates the statistical significance at 10 percent level
(3) x1 = 1 for medium commercial bank, x2 = 1 for large commercial bank, w1 = liquidity as
measured by the ratio of total loans to total assets, w2 = loan quality as measured by the
ratio of non-performing loans to total loans, w3 = asset quality as measured by the ratio
of loan loss provision to total loans, w4 =management quality as measured by the ratio of
non-interest expenses to total assets, w5 = diversification as measured by the ratio of
non-interest incomes to total assets, w6 = profitability as measured by the ratio of net profit to
total assets and w7 = capital adequacy as measured by the ratio of owners’ equity to total
assets
(4) The lower critical value of Durbin-Watson test (DL) at 5 percent level with 93 observations and 9 explanatory variables is 1.4573 (Stanford University, 2010), implying that 4 - DL
equals to 2.5427.
Constant -4.299 12.492 0.732
x1 -7.763** 4.625 -0.251 0.097 2.399
x2 -13.447* 4.874 -0.443 0.007 2.760
w1 0.344* 0.149 0.272 0.024 1.496
w2 -0.045 0.349 -0.016 0.898 1.752
w3 -0.360 0.495 -0.098 0.469 1.952
w4 -4.705* 2.303 -0.226 0.044 1.317
w5 15.036* 3.786 0.469 0.000 1.494
w6 0.443 0.915 0.055 0.630 1.389
w7 -1.555* 0.475 -0.384 0.002 1.475
Observations 93
F-Statistic for overall significance 2.686*
Durbin-Watson Statistics 1.818
R-square 0.226
P-Value for overall significance 0.009
VIF
Std. Error P-Value
Coefficient Standardized
Based on Table 5, there are only six explanatory variables which significantly determine TFP growth rate at least 10 percent level. They include the dummy variable for medium bank, the dummy variable for large banks, liquidity as measured by the ratio of total loans to total assets, management quality as measured by the ratio of non-interest expenses to total assets, diversification as measured by the ratio of non-interest incomes to total assets and capital adequacy as measured by the ratio of owners’ equity to total assets. Firstly, the regression
coefficient of dummy variable for medium bank (x1) is -7.763, implying that medium banks, on
average, are less productive than small banks. Their average TFP growth rate is 7.763 percent lower than that of small banks. Moreover, the regression coefficient of dummy variable for
large bank (x2) is -13.447, implying that large banks, in average, are also less productive than
small banks. Their average TFP growth rate is 13.447 percent lower than that of small banks.
The regression coefficient of liquidity (w1) is 0.344, implying that the ratio of total loans to
total assets is positively related to TFP growth rate of commercial banks as measured. That is, one percent increase in the ratio of total loans to total assets will lead to 0.344 percent increase in TFP growth rate. In other words, commercial banks on average are likely to be more productive if they have lower liquidity. Moreover, the ratio of non-interest expenses to total assets, which represents management quality, is negatively related to TFP growth
rate of commercial banks due to its regression coefficient (w4) of -4.705. As a result, one
percent increase in the ratio of non-interest expenses to total assets will lead to 4.705 percent decrease in TFP growth rate. In other words, commercial banks on average are likely to be more productive if they have higher management quality.
Diversification as measured by the ratio of non-interest incomes to total assets is positively
related to TFP growth rate of commercial banks thanks to its regression coefficient (w5) which
equals 15.306. This figure implies that TFP growth rate of commercial banks tends to increase by 15.036 percent as the ratio of non-interest incomes to total assets increases by one percent. In other words, commercial banks on average are likely to be more productive if they are more diversified. Nevertheless, capital adequacy as measured by the ratio of owners’ equity to total assets is negatively related to TFP growth rate of commercial banks. Its regression coefficient equals -1.555, indicating that one percent increase in the ratio of owners’ equity to total assets will lead to 1.555 percent decrease in TFP growth rate. As a result, commercial banks on average are likely to be less productive if they have higher capital adequacy.
After considering the standardized coefficients, we find that diversification has the greatest influence on TFP growth rate of commercial banks because its standardized coefficient is the highest among other determinants, equal to 0.469. It is followed by capital adequacy, liquidity and management quality of which standardized coefficients equal -0.384, 0.272 and -0.226, respectively. However, there is no evidence for the influences of loan quality, asset quality and profitability on TFP growth rate of commercial banks in Thailand.
interest expenses. This finding is complied with the previous findings that commercial banks in Thailand, on average, operated at decreasing return to scale (Chansarn, 2007; Rangkakulnuwat & Wang, 2011). Therefore, it is possible to conclude that most commercial banks in Thailand cannot efficiently utilize their inputs to generate total revenues. In addition, the reason that small commercial banks have the highest TFP growth is that small banks normally have fewer assets and fewer employees, giving them advantages of the higher management flexibility and the higher ability to change the scale of production in comparison to medium or large commercial banks, especially during economic downturn or political unrest.
Commercial banks are likely to be less productive as they have the higher liquidity. The explanation is that the major businesses of commercial banks in Thailand are accepting deposits and lending. Thus their major source of funding is deposits which cost them interest expenses whereas their major source of incomes is interest incomes from lending. As a result, more lending will certainly lead to the greater revenues and the lower interest burden of deposits, leading to the higher TFP growth. However, too low liquidity is also undesirable since it may cause a detrimental impact on the financial stability of commercial banks. Consequently, creating other sources of incomes to earn the greater non-interest income is suggested in order to have the greater revenue and avoid liquidity problem. This statement is complied with the finding that TFP growth of commercial banks is expected to increase as they are more diversified. That is, the greater diversification will help increase the revenues and lessen the liquidity risk for commercial banks. Moreover, well diversified commercial banks are more likely to be less affected by the economic downturn and capable of maintaining their revenues during the financial and economic crises, leading to the higher TFP growth.
In addition, it is not surprising that the higher management quality will lead to the higher TFP growth of commercial banks since it implies the higher ability to utilize physical resources and employees in production so as to minimize non-interest expenses in generating a certain amount of total revenues. Eventually, the higher capital adequacy causes TFP growth of commercial banks to decrease. The reason is that the higher capital adequacy implies the greater proportion of owners’ equity and the lower proportion of liabilities. However, the major source of bank’s liabilities is deposits which are considered one of the major inputs of commercial banks. Therefore, as commercial banks take more deposits, implying the greater proportion of liabilities and the lower owners’ equity, they will have the greater funding, leading to the higher revenues and the higher TFP growth.
5. CONCLUSION AND RECOMMENDATION
Additionally, at the micro level, commercial banks may utilize the findings from this study to benchmark their productivity improvement targets. For instance, if the TFP growth rate of a particular commercial bank is negative at -5 percent, this bank will need to increase its total revenues by more than 5 percent with the same amount of inputs so that it can have the positive TFP growth. In summary, based on the findings of the determinants of TFP growth, this study recommends that commercial banks accept more deposits, provide more credits to households and businesses, constantly improve management quality and create other sources of non-interest incomes in order to promote their total factor productivity growth.
REFERENCES
Athanasogloua, P. P., Georgioua, E. A., & Staikouras, C. C. (2009). Assessing Output and Productivity Growth in the Banking Industry. The Quarterly Review of Economics and Finance, 49(4), 1317 – 1340.
Bank of Thailand. (2010). Financial Institutions Statistics. Retrieved March 15, 2010, from http://www.bot.or.th.
Bernanke, B. S., Abel, A. B., & Croushore, D. (2008). Macroeconomics. 6th ed. Boston, MA:
The Addison-Wesley.
Chang, T. P., Hu, J. L., Chou, R. Y., & Sun, L. (2012). The Sources of Bank Productivity Growth in China during 2002 – 2009: A Disaggregation View. Journal of Banking & Finance, 36(2012), 1997 – 2006.
Chansarn, S. (2007). The Efficiency in Thai Financial Sector after the Financial Crisis. Economic Analysis Working Papers No. 2007, 10.
Chansarn, S. (2008). The Relative Efficiency of Commercial Banks in Thailand: DEA Approach. International Research Journal of Finance and Economics, 18, 53 – 68. Chotigeat, T. (2008). Efficiency of Domestic and Foreign Banks in Thailand since the Asian
Financial Crisis. International Journal of Banking and Finance, 5(2), 101 – 112. Delis, M. D., & Papanikolaou, N. I. (2009). Determinants of Bank Efficiency: Evidence from
a Semi-Parametric Methodology. Munich Personal RePec Achieve, Paper No. 13893. Fiordelisi, F., & Molyneux, P. (2010). Total Factor Productivity and Shareholder Returns in
Banking. Omega, 38(2010), 241 – 253.
Fu, X., & Heffernan, S. (2007). Cost X-Efficiency in China’s Banking Sector. China Economic Review, 18(1), 35 – 53.
Girardone, C., Molyneux, P., & Gardener, E. P. M. (2004). Analysing the Determinants of Bank Efficiency: The Case of Italian Banks. Applied Economics, 36(3), 215 – 227.
Havrylchyk, O. (2006). Efficiency of the Polish Banking Industry: Foreign versus Domestic Banks. Journal of Banking and Finance, 30(7), 1975 – 1996.
Isik, I., & Hassan, M. K. (2003). Financial Deregulation and Total Factor Productivity Change: An Empirical Study of Turkish Commercial Banks. Journal of Banking & Finance, 27(2003), 1455 – 1485.
Kirkpatrick, C., Murinde, V., & Tefula, M. (2008). The Measurement and Determinants of X-Inefficiency in Commercial Banks in Sub-Saharan Africa. The European Journal of Finance, 14(7), 625 – 639.
Kosmidou, K., Pasiouras, F., & Tsaklanganos, A. (2007). Domestic and Multinational Determinants of Foreign Bank Profits: The Case of Greek Banks Operating Abroad. Journal of Multinational Financial Management, 17(1), 1 – 15.
Lightner, J. E., & Lovell, C. A. K. (1998). The Impact of Financial Liberalization on the Performance of Thai Banks. Journal of Economics and Business, 50(2), 115 – 131. Margono, H., Sharma, S. C., & Melvin, P. D. (2010). Cost Efficiency, Economies of Scale,
Technological Progress and Productivity in Indonesian Banks. Journal of Asian Economics, 21(1), 53 – 65.
Matthews, K., & Zhang, N. (2010). Bank productivity in China 1997–2007: Measurement and convergence. China Economic Review, 21(4), 617 – 628.
Moro, A., & Nuño, G. (2012). Does Total-Factor Productivity Drive Housing Prices? A Growth-Accounting Exercise for Four Countries. Economics Letters, 115(2), 221 – 224. Nakane, M. I., & Weintraub, D. B. (2005). Bank Privatization and Productivity: Evidence for
Brazil. Journal of Banking & Finance, 29(8-9), 2259 – 2289.
National Statistical Office. (2012). Labor Force Survey (Quarterly). Retrieved March 7, 2012, from http://service.nso.go.th/nso/nso_center/project/search_center/23project-th.htm. Ngo, D. T., & Nguyen, L. T. P. (2012). Total Factor Productivity of Thai Banks in 2007 – 2010:
An Application of DEA and Malmquist Index. Journal of Applied Finance & Banking, 2(5), 27 – 42.
Rangkakulnuwat, P., & Wang, H. H. (2011). Productivity Growth Decomposition with FE-IV Approach: Rethinking Thai Commercial Banks after the Financial Crisis. Economic Modelling, 28(6), 2579 – 2588.
Rezitis, A. N. (2008). Efficiency and Productivity Effects of Bank Mergers: Evidence from the Greek Banking Industry. Economic Modelling, 25(2), 236 – 254.
Sanyal, P., & Shankar, R. (2011). Ownership, Competition, and Bank Productivity: An Analysis of Indian Banking in the Post-Reform Period. International Review of Economics and Finance, 20(2), 225 – 247.
Sufian, F. (2009). Determinants of Bank Efficiency during Unstable Macroeconomic Environment: Empirical Evidence from Malaysia. Research in International Business and Finance, 23(1), 54 – 77.
Sufian, F. (2011a). Financial Repression, Liberalization and Bank Total Factor Productivity: Empirical Evidence from the Thailand Banking Sector. Economic Computation and Economic Cybenetics Studies and Research, 45(4), 31 – 52.
Sufian, F. (2011b). Banks Total Factor Productivity Change in a Developing Economy: Does Ownership and Origins matter?. Journal of Asian Economics, 22(1), 84–98.
Sufian, F., & Habibullah, M. S. (2010). Developments in the Efficiency of the Thailand Banking Sector: A DEA Approach. International Journal of Development Issues, 9(3), 226 – 245. Sussangkarn, C., & Vichyanond, P. (2007). Ten Years after the Financial Crisis in Thailand:
What Has Been Learned or Not Learned?. Asian Economic Policy Reviews, 2(1), 100 – 118.
Talluri, S. (2000). Data Envelopment Analysis: Models and Extensions. Decision Line, 31(3), 8 – 11.
Tecles, P. L., & Tabak, B. M. (2010). Determinants of Bank Efficiency: The Case of Brazil. European Journal of Operational Research, 207(3), 1587 – 1598.