http://www.sciencepublishinggroup.com/j/ijmea doi: 10.11648/j.ijmea.20170504.17
ISSN: 2330-023X (Print); ISSN: 2330-0248 (Online)
Economic Viability of Compressor Washing Methods for
Maximum Power Output
Enyia James Diwaa, Archibong Eso Archibongb, Dodeye Ina Igbongc, Ukpabio E. Eyod
Department of Mechanical Engineering, Cross River University of Technology, Calabar, Nigeria
Email address:
[email protected] (J. D. Enyia), [email protected] (A. E. Archibong), [email protected] (D. I. Igbong), [email protected] (U. E. Eyod)
To cite this article:
Enyia James Diwaa, Archibong Eso Archibongb, Dodeye Ina Igbongc, Ukpabio E. Eyod. Economic Viability of Compressor Washing Methods for Maximum Power Output. International Journal of Mechanical Engineering and Applications. Vol. 5, No. 4, 2017, pp. 228-238. doi: 10.11648/j.ijmea.20170504.17
Received: September 22, 2016; Accepted: August 7, 2017; Published: August 21, 2017
Abstract:
It is no longer news that gas turbines deteriorates after some period in operation, and if the deterioration effect is not taken into consideration, the gas turbine operator or owner will run into huge economic loss. Availability and reliability have been very important tools to every gas turbine owner, and there are various methods by which these engines have been investigated to prolong its life span, as such, it has become imperative to use different methods such as online and offline washing so as to advise the engine operator on which of the methods that will be more beneficial economically. The engine is kept clean the often it is been washed and thus produces more power, but how economically viable will it be washing the engine for this much times in a year has been the crux, considering the cost of wash fluids, equipment cost, labour cost, and so on. Hence this research technical paper. In this technical paper, it has been investigated that though keeping power high is very important but does not necessarily means saving cost. An online compressor washing was investigated and it was a 30% power recovery on each time online compressor water wash was administered, and the washing took place ones in every 7days, which gives a total of 54 washes per annum. The offline wash took place ones in every 3 months, making a total of 4 washes per annum with 85% power recovery after each offline compressor water wash, and the maximum limit of engine deterioration never exceed 10% of the original power at each given point. The engine modelled for this study was similar to that of GE LM2500+. The performance simulation was carried out via TURBOMATCH/PYTHIA which is Cranfield University software for gas turbine performance simulation. The output result was fed into a techno-economic model where the total financial involvement was computed for both the online and the offline compressor water wash. The cost implications have shown that though more power could be saved when the engine is washed regularly, but not necessarily economically viable as any engine owner or operator would have wanted. It has been shown in financial terms that fouling actually has significant effect on gas turbine performance, and the more economically viable compressor water wash method has been investigated via the economic model.Keywords:
Degradation, Fouling, Online Wash, Offline Wash, Performance, Economic Viability1. Introduction
Performance is pivotal to gas turbine (GT) engine’s economic viability, both from the operator and manufacturer’s perspective. Engine performance include shaft power or thrust delivered for a particular fuel flow, emission, engine diameter, unit cost, weight, and life. Basically, this is what is being sold and purchased by the GT manufacturer and operator. Focus can no longer be made solely to the technical aspect of a GT in the modern
life and so on are all associated with performance parameters; with fuel burn always dominant. These dominant fuel cost increase and the non-storage behaviour of electricity has prompted a need to operate the engine more economically without compromising on stability and reliability of supply. To satisfy this standard, power systems short term scheduling is based on two important tasks (unit commitment and economic dispatch) which are the combinatorial optimization task are aimed at meeting the load demand at each period in the lowest cost manner while satisfying both local and global problems like minimum up and down time, spinning reserve and other energy requirements. Economic dispatch is a method for determining the output power of a GT engine unit at a given time to enable the system meets its required load in the most economic manner [2].
These gas turbine engines and power generation industries are really depending on each other to provide energy that will meet up with the current world demand. With the demand for fossil fuel mostly natural gas that will soon replace coal as the primary source of energy, it is expected that the power generation industries have the fasted rate of growth in few years’ time [3]. Despite its advantages of high power-to-weight ratio, amazing efficiency, low maintenance cost that play important factor to attract such high interest from the industrial sector, it is also known that the engine is operated in an unfriendly and demanding environment. This causes engine component parts degradation, which in turn leads to efficiency and power output reduction [4]. There is a very huge financial setback associated with GT engine downtime, power output reduction or discontinuation, less availability and so on, as such, should be avoided. With this factors, it has become imperative for the GT operator to ensure that performance degradation is controlled to the barest minimum for high engine availability and operates at its optimal performance possible level all through its useful life span. The several mechanisms associated with the degradation of GT engines are; fouling which is caused by adherence of particles to airfoil and annulus surfaces. Corrosion caused by inlet air contaminants and by fuel and combustion contaminants. Hot corrosion is the loss or deterioration of material from components exposed to hot corrosion gases caused by chemical reactions between components and certain contaminants. Abrasion cause when a rotating surface rubs on a stationary surface. Erosion is the abrasive removal of material from the flow path by hard or incompressible particles impinging on flow surfaces. Foreign objects damages FOD are external objects striking the flow path components, Domestic object damage DOD is wearing of the engine component paths [5]. The effects of these mechanisms could either result to permanent damage or recoverable by repair and change of components parts. But this research paper engaged in cleaning or washing the component parts. The degradation mechanism for aircraft and industrial gas turbine IGT differs, as aircraft engine operates without inlet air filtration system, thus erosion, mostly of the compressor is a key contributor. Assuming appropriate air filtration
system, IGT are probably more prone to fouling caused by smaller particles, corrosion and probably lube oil. The exception may be engines subject to water injection in the compressor inlet [6].
2. Component Part Degradation
Compressor degradation are caused by three major factors which include; change in airfoil surface quality, increased tip clearance, and changes in airfoil geometry. Washing the GT engine compressor can reverse the first effect while the last two effects are termed as non-recoverable degradation [7]. This degradation does not only reduce the overall engine efficiency and pressure ratio, but also lower the compressor flow capacity. Some of the mismatch effects can be corrected by carefully readjusting variable geometry where available. Compressor degradation can also cause a reduction in surge and stall margin [8]. An axial compressor with increased clearance caused reduced surge margin [9]. The compressor flow capacity and pressure ratio are dependent on each other, and the operating point of the compressor determines its efficiency. Deteriorated airfoil and increased tip clearance will shift the pressure ratio-flow relationship for a given operating speed to lower flow rates and efficiencies.
3. Gas Turbine Compressor Fouling and
Their Sources
The primary cause of compressor fouling is from air contaminants. This depends on the engine operating environment that is attached to the airfoil and annulus area of the compressor. If not taken seriously could result in compressor airfoil, pressure ratio, and efficiency drop, which will in turn lead to reduction in power output. This is not good for any engine operator or owner. There are other causative agent ranging from internal contaminants sources
due to non-maintenance or incorrect operation from auxiliary equipment [10], salt and water impurities by inlet fog [11, 12], rubbing from the brush seals and bearings [13, 14], oil and vapours inside the compressor increases the adherence of particles on the blade surface [15], the natural ambient accelerates the adhesion process such as heavy fog, rain and excessive humidity [16]. External contaminants sources due to smaller particles escape through the inlet filters to adhere on the compressor blades causing fouling [17, 18, 19]. The sizes of these contaminants are said to be smaller than 2µm [20], and it overall will negatively affect the surface quality of the compressor blades.
any erosion due to excessive fouling. Figure 1 below is a typical example of a fouled compressor blade.
Figure 1. Example of fouling particles that attached on the airfoil of compressor blade [21].
Reference [22] defined fouling as degradation of flow capacity and efficiency caused by adherence of particular contaminants to the GT engine airfoil and annulus surfaces. There will be change in the shape of the airfoil, changing the
airfoil inlet angle, increase surface roughness, and reduces the airfoil throat opening resulting in overall engine performance, all caused by build-up of material at the inlet as could be seen in figure 2. The mass flow, compressor efficiency and surge line are mostly affected here. Reference [23] also contributed that compressor fouling susceptibility degree and the performance is dependent on the compressor design, compressor airfoil loading, airfoil incidences, airfoil surface smoothness/coating, type and condition of the airborne contaminants, the site environment and the climate conditions. High humidity and temperature condition increases the rate of fouling. It can be seen that 70 to 85% of all GT engine performance loss that are accumulated during the engine operation are due to compressor fouling [22]. In summary, factors affecting compressor fouling are; position and elevation of intake, design parameters of the GT, atmospheric condition and seasonal change, plant maintenance [23], and type of environment. Example, industrial is offshore or desert [24].
4. Gas Turbine Performance Recovery
In order to prevent performance deterioration which eventually leads to incurring revenue losses via output power loss, it is very paramount to state clearly the possible ways by which the fouling can be controlled to the lowest point. GT engines have been required to operate at higher levels due to increase in power demands [25], which has made it the limiting factor as important engine availability and reliability [26]. Compressor recovery system is said to be a solution to reduce compressor fouling by the use of proper filtration system, compressor washing, and compressor blade coating [27]. The only means of performance recovery to be considered in this paper is the compressor washing.
It can be seen in figure 2 that online wash and offline wash are illustrated and compared. It can be seen that the combination of both frequent and timely offline wash are more beneficial as it brings out the optimum power recovered for the engine. This paper content will be talking about online and offline compressor washes only.
5. Online Compressor Washing
The key objectives of online compressor washing are to maintain the GT efficiency and power output to minimize losses resulting from fouling, and to extend the operational period between shut-down for offline washing. The online compressor wash system is used only when the GT operating
parameters are found to be stable, at part load or at full load since it cannot be used without disturbing the operating unit. Hence avoiding the downtime cost associated with it [29, 30]. It is administered by injecting a mixture of atomized washing fluid with demineralized water or only demineralized water through atomizing spray nozzles which are positioned circumferentially around the air inlet plenum [31]. Online wash should be administered on a clean engine or immediately after a scheduled offline wash because removing large quantities of foulants from the early stages suddenly, would pass through the compressor causing erosion, blockage of cooling air passage and so on. Figure 3 shows a view of the location of nozzles for online and offline wash regime.
Figure 3. Online (Left) and offline (Right) nozzle location for compressor washing [32].
6. Offline Compressor Washing
It has higher objective of restoring the power and overall efficiency of the GT engine to almost perfectly clean engine. A properly conducted offline wash with well-timed interval though site specific will recover almost the total power of efficiency loss resulting from fouling. It is also known as soak or crank as the engine is been shut-down during this process.
The efficiency rate of recovery is very high in this process because each stage of the compressor is been cleaned by hand while the engine is shut-down as the demineralized water is sprayed on the compressor and allowed to soak before washing is carried out. This method of washing is done at major shut downs when the GT is opened up for component replacements and inspection. Though it might be time consuming, but the satisfaction is the highest as each blade can be inspected and cleaned thoroughly [34].
7. Frequency of Compressor Washing
The frequency or periodicity between performance recoveries is driven by type of fouling, accumulated rate of fouling, level of fouling, and critical depth of fouling [35]. The effectiveness of wash is critical since extraction of maximum power recovery as well as revenue are the main aims of compressor washing which in this paper relates to online washing so as to extend the GT time in service between offline washes.
8. Methodology
Output Power 29MW Pressure Ratio 23.1
TET 1505K
Exhaust Temperature 518°C Inlet Mass Flow 80kg Frequency 60Hz Turbine Speed 3600rpm Efficiency 39%
The engine simulated outcome was assumed to be the clean engine (baseline engine). The simulation was performed for both clean and degraded engine via the TURBOMATCH/PYTHIA which is known simulation software in Cranfield University that is so reliable for GT engine performance investigation. The simulation was done to investigate the performance parameter that most affect compressor degradation resulting from fouling [36, 37].
To avoid the compressor from being heavily fouled, it has become imperative to carry out a compressor washing. The wash nozzles was assumed to be installed at the inlet plenum as described in the literature. The wash was assumed to be carried out ones in every 7days for the online washing
frequencies and the offline wash was administered 4 times in a year with equal intervals. The simulated output result from TURBOMATCH was imported and inputted into the wash regime, after which the entire output for both the online and offline wash was integrated into the economic module to determine the optimal economic viability that will be adopted for this study.
The assumptions made during these processes are as follows;
Open cycle GT engine. Base load at constant TET.
Degradation of flow capacity and compressor efficiency.
Conventional fuel used. Fuel price is $2/MJ.
Emission was not considered since the engine is operating on clean natural gas.
Online wash was 7 days interval.
Maximum degradation limit before offline wash does not exceed 10%.
Offline wash done 4 times a year at equal intervals.
9. Engine Modelling and Performance Simulation
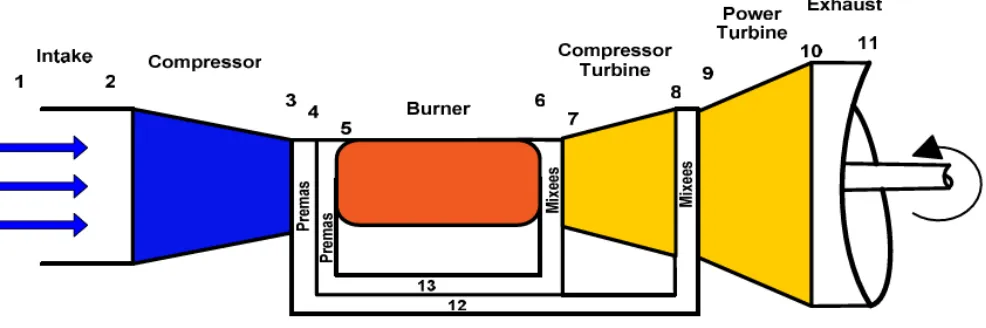
Figure 4. Gas turbine engine layout for LM2500+.
The performance simulation was carried out via TURBOMATH/PYTHIA software as could be seen in figure 4. The output results from this simulation was inputted into the creep module and integrated.
10. Creep Life Assessment of the HPT
Blade
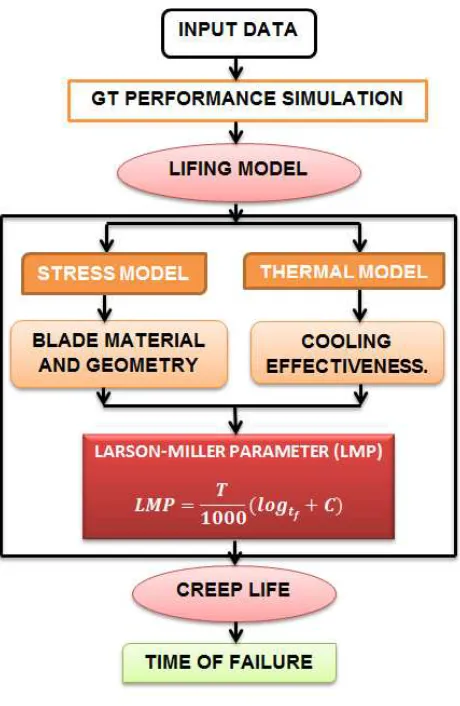
It is necessary to introduce the creep model since the degradation has effect on the engine hot section. The output results from the performance model were fed into the creep model as could be seen in the figure 5. Some of this output parameters includes; combustor inlet and outlet temperatures and pressures, firing temperatures, and the rotational speed. The lifing model was later splits into stress and thermal model determination, having the blade material temperature and
geometry for the stress model, and the cooling effectiveness ε for the thermal model. Both models were later integrated to perform a parametric study based on Larson-miller parameter (LMP). Hence, the creep life and time to failure of the blade were determined. The LMP and stress values are sets of LMP creep generated from standard tests where the material is tested under specified temperature and loadings.
The lifing model is divided into three parts which includes;
Figure 5. Creep life assessment model.
Considerations for the determination of HPT creep life include;
Centrifugal stress on each section of the blade, neglecting the stress due to bending moment.
Use of Rene 80 master curve.
Blade metal temperature at each section. Stress model
Direct centrifugal stress is considered due to centrifugal load (mass) caused by the rotation of the engine blades. Between 50 to 80% of the blade material strength is used to overcome this stress operating in an inertia field [38]. The centrifugal stress on the blade was evaluated from the root to tip, to enable creep life calculation. Results generated from PYTHIA were inputted into this model. The blade was divided into sub-sections, and the axial velocity was assumed to be constant along the blade span, with centrifugal force acting on the center of gravity (CG) of the blade section. The centrifugal force (CF) is given as;
CFsec = m*ω2*dcg (1)
Where m is the mass of the component, ω is the angular speed of the component, and dcg is the distance between the
rotational axis and the section CG.
In determining the centrifugal stress acting on a blade of constant cross-sectional area, the following equation is suitable;
σsec=ρ* hsec * ω2 * dcg (2)
Where σ is the blade stress,ρ is the material density; hsecis
the sectional height of the blade. Thermal model
It is used to determine the blade metal temperature BMT for the first stage of the turbine. Based on the blade’s cooling technology, the overall effectiveness is calculated, the cooling air (Tcin) entering the blades, and the gas stream
temperature (Tg) surrounding the blades are both determined
from the TURBOMATCH simulation. The BMT (Tb) is
calculated with the use of the model and it’s been updated continuously as the temperature changes resulting from change in operating conditions as could be seen below.
ε = ((Tg – Tb)/ (Tg - Tcin)) (3)
Where
ε
is the cooling effectiveness, Tgis the gas streamtemperature, and Tcin is the outlet cooling temperature. The
BMT (Tb
)
is determined when the above equation isre-arranged as;
Tb = Tg – ε(Tg - Tcin) (4)
To stabilize the metal temperature, internal and film cooling are used together, but the metal temperature is still above 950°C on the surface [39].
Creep life
Creep is the main type of damage observed for turbine blades that are exposed to high temperature under varying stress condition for a protracted period of time. In other to improve the high cost of replacement, or prematurely retired ones, it is required that the remaining useful life of the components be determined.
The time-temperature relationship for most materials is extremely carried out by Larson-miller parameter LMP [41].
LMP = T/1000(logtf +C) (5)
The time to failure is given as;
tf = 10[1000LMP/T]-C (6)
Where tfis time to failure, T is absolute temperature in
rankine, and C is a constant usually substituted with 20 for industrial gas turbines.
11. Results and Discussions
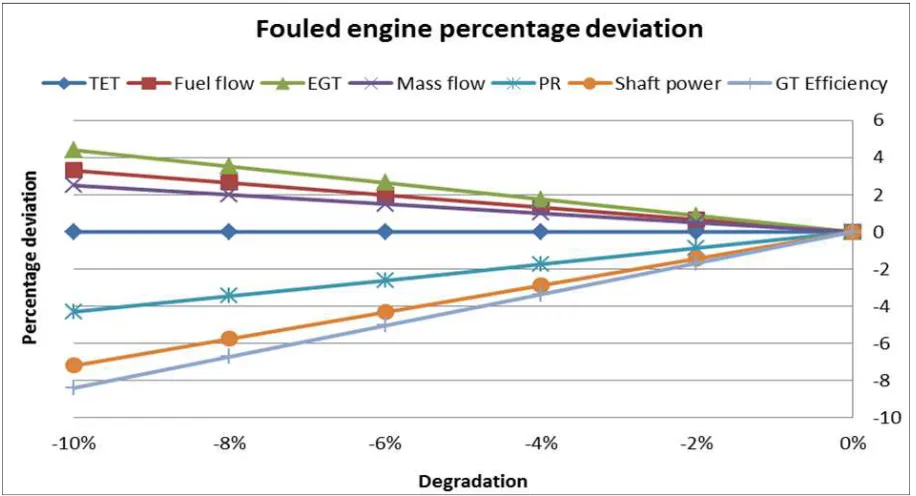
Figure 6. Effect of GT compressor degradation on performance parameters.
It represents the percentage parameters deviations resulting from compressor fouling. It can be observed that the exhaust gas temperature (EGT), fuel flow, and mass flow increased by 4.4%, 3.3%, and 2.5% respectively, while other parameters such as pressure ratio, shaft power, GT efficiency reduces by -4.3%, -7.2%, and -8.4% respectively. The engine parameters are degrading in different percentage for the same percentage reduction in flow capacity and efficiency means some of the engine parameters are more sensitive to fouling than the other. Thus, continues operation of the engine without necessary maintenance schedule, which in this paper is compressor water wash, could lead to huge economic disaster to the engine user.
Effect of compressor washing on performance recovery
It has been investigated as stated in literature that one of the best methods of recovering GT performance degradation is compressor washing. As such, the degraded engine performance due to fouling will be recovered through online and offline compressor water washing.
Figure 7 shows the rate of power recovered after online and offline compressor water washed. It is observed that the engine was operating at maximum power output of 29MW at baseload, and after the degradation, the output was observed to be 20.74MW if no wash is administered, but the online compressor washing recovered 30% after each wash, while the offline washing recovered 85% after each wash, over one year operating period as shown in figure 7.
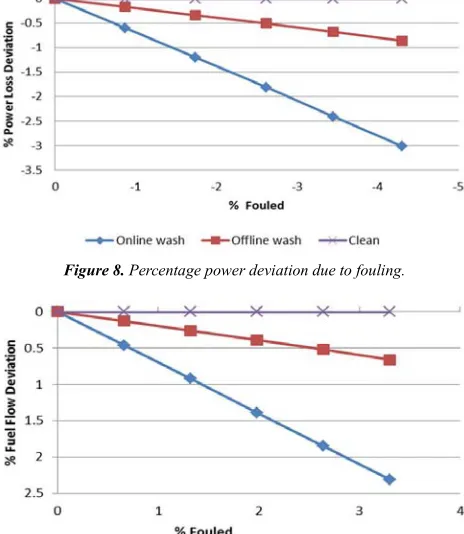
Figure 8 shows the percentge variation of the different wash recovery methods from fouling. As indicated below, the online wash losses about -3.0% while the offline losses about -0.99%, which shows that offline washing is more effective for power recovery.
Figure 8. Percentage power deviation due to fouling.
Figure 9. Percentage fuel flow deviation due to fouling.
Figure 10. Percentage power loss from fouling over time.
In a similar way, as could be seen in figure 9, for fuel flow. The online wash deviated by about -2.4% while the offline deviated by about -0.7%. This again indicates that the offline wash is more effective for loss recovery.
Since it has been assumed that compressor fouling is the only source of degradation, with some level of non-recoverable degradation, it means that each wash will not recover all power lost, but only upto the recoverable limit at the time of cleaning as could be seen in figure 10 and 11. It can be seen that the offline wash was administered four times a year at equal intervals, showing the minimum acceptable degradation limit, offline trend, and the non-recoverable
power loss over the one year operation period.
The major cost effective parameters are power output and fuel flow, as such will be considered in the economic model in this paper. Fuel increase cost, shutdown for crank wash cost, cost of washing materials were considered.
Figure 11. Fuel loss for four intervals.
The effect of online washing is shown in figure 7, and percentage variation for both power loss and fuel flow is as shown in figure 8 &9 respectively. While a wider view of the offline wash percentage deviation is as shown in figure 10 & 11 with intervals to enable calculation of area under the curve at each wash interval.
Effect of compressor fouling on BMT
The BMT is obviously affected by compressor fouling, because the temperature increases significantly. On the other hand, compressor washing have shown tremendous change in the BMT. It could be seen in figure12 below that though the online compressor washing reduces the BMT, but the offline compressor wash shows more positive effects on the BMT reduction along the blade span.
Figure 12. Effect of BMT on blade creep life.
Economic implications of compressor fouling
The Net Profit calculation method is applied to determine the optimum time of washing as could be seen below;
Net Profit = Total expected cost associated with efficiency degradation – Total expected cost of losses recovery – Cost of compressor water wash.
references [42] and [43]. The power loss is first converted from MW to Kwh, and the area in the curve is assumed to be a triangle as shown in figure 11. As such the energy loss is the integration of the triangular curve for the four arears from 29MW to 26MW as could be seen below;
LossEnergy= 2629 1st+2nd+3rd+4thInterval xdt (7) And the online water wash loss energy is carried out in a similar way. From TURBOMATCH output, 5% fouling decreases power output by 5.21%, which means a 1.61% increase in fuel flow. Fuel consumption due to 10% power loss can be determined from this relationship. The engine is shut-down for about 10 hours on each crank washing, as such there were 40 hours over the year for the four times offline washing, the cost of demineralized water and detergents was also calculated in the case of online washing.
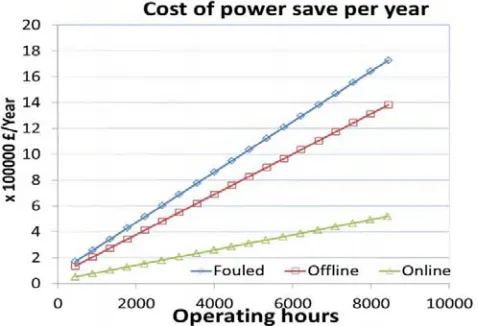
It is observed from figure 13 that the offline water wash happens to save more cost because the offline wash recovers more power. The power recovered was converted to energy in kwh and sold using the selling price of electricity as shared by reference [42]. In the same way equation 7 was applied to determine the fuel saved as in figure 14. It cost more fuel burn for the offline wash since the interval between wash is long. But when adding the amount it cost for delay in offline washing during shutdown, cleaning, labour cost, lifing cost, and every other cost associated with washing for both case, it was observed as could be seen in figure 15 that total cost favoured the offline washing method.
Figure 13. Cost of power retention from compressor washing.
Figure 14. Cost of fuel retention from compressor washing.
Figure 15. Total costs accrue saved from compressor washing.
12. Components Washing Optimisation
An algorithm is presented in this section to help verify the optimum economic benefit, so as to identify the best time to carry out compressor washing. A user specified recovery factor as presented by [41] is as shown below.
= ∅ − (8) In this case, ∅ is the recovery factor for power output, is the actual power output measured, while n is the total number of off-line compressor wash. It can be accounted that each off-line wash recovers some fraction which is equivalent to ∅ of the power output recovered by the immediate crank wash, and ℎ off-line compressor wash recovers ∅ fraction of the initial (clean engine) power output. In the same way for the heat rate, each off-line wash recovers heat rate to a level that is a little above that recovered by the immediate wash. Hence, the extra fuel burned could be expressed as shown below:
= ! (10)
In a likely manner, the average rate of change of the extra fuel burned resulting from compressor fouling is given as below:
∅ = ! " (11)
And the optimum time to do an off-line compressor wash is given as shown below:
#∗=
%
2''(+∅' (12)
The time from the immediate past compressor wash is represented by #∗, the maintenance cost, price of power sale and fuel purchase price is represented by ' , '( and ' respectively. The off-line compressor washing dates can be estimated by the use of these algorithms as new data is received and processed.
13. Conclusion
The effects of fouling on performance for an aero derivative GT operating at base load have been investigated. There was no fixed limit of degradation for the online wash, but the intervals were assumed to be every 7 days which amount to about 54 numbers of washes per annum. On the other hand, the offline wash was assumed to be four time a year at equal intervals.
It was observed that though the online wash was able to optimize power output due to the frequent washing, but when it comes to total cost accrue after integrating the wash fluid cost, maintenance cost, shut down cost for offline wash, fuel price, cost of electricity and all other necessary associated cost, it was observed that the offline wash systems made a better choice, and as such should be adopted and recommended for GT maintenance in terms of reducing compressor fouling, as could be seen in financial terms.
Nomenclature
BMT Blade Metal Temperature C Celsius degree
DOD Domestic Object Damage DP Design Point
EGT Exhaust Gas Turbine EOH Engine Operating Hours FOD Foreign Object Damage GE General Electric GT Gas Turbine K Kelvin degree LM Land Marine
LMP Larson Miller Parameter MW Mega Watt
ODP Off Design Point
TET Turbine Entry Temperature
Pam Actual Measured Power Output
Pem Expected Measured Power Output
faf Actual Fuel Mass Flow Rate
fem Expected Mass Flow Rate
Acknowledgements
The authors sincerely appreciate Petroleum Technology Development fund, PTDF, for her financial support all through this research work and also grateful to the inestimable supervisors; Professor P. Pilidis and Dr. Y. Li, for their critical scrutiny and encouragement all through this research.
References
[1] R. Panneerselvam, Engineering Economics, 2nd Edition, October, 2013.
[2] B. H. Houssein. The Optimization of the usage of Gas Turbine Generation sets for Oil and Gas Production using Genetic Algorithms, Unpublished PhD Thesis, Cranfield University, Bedfordshire, United Kingdom. 2010.
[3] Syverud, Axial Compressor Performance Deterioration and Recovery through Online Washing, Trondhein: Norwegian University of Science and Technology, 2007.
[4] K. A. Ahmad, Economic Analysis of Online Compressor Washing for Small to Heavy Duty Gas Turbine Engine (for Power Generation), Unpublished MSc Thesis, Cranfield University, Bedfordshire, United Kingdom, 2013.
[5] R. Kurz, K. Brun, Degradation in Gas Turbine systems. Journal of Engineering for Gas Turbines and Power, vol. 123, no.1, pp.70-77, 2009.
[6] K. Brun, R. Kurz, H. Simmons, Aerodynamics Instability and Life Limiting Effects of Inlet and Inter-stage Water Injection into Gas Turbines, ASME Paper No. GT2005-68007, 2007. [7] J. P. Stalder, Gas Turbine Compressor Washing State of the
Art: Field Experience, ASME Journal of Engineering for Gas Turbines and Power. Vol. 122, pp. 363-370, ASME Paper No. 98-GT-420, 1998.
[8] Z. P. Spakovsky, J. Gertz, O. P. Sharma, J. D. Paduano, A. H. Epstein, E. M. Greitzer, Influence of Compressor Deterioration on Engine Dynamic Behaviour and Transient Stall Margin, ASME Paper No. 99-GT-439, 1999.
[9] M. B. Graf, T. S. Wong, E. M. Greitzer, F. E. Marble, C. S. Tan, H. W. Shin, D. C. Wisler, Effects of Non-axisymmetric Tip Clearance on Axial Compressor Performance and Stability, ASME J. Turbomachinery, 120 (4), pp. 648-661, 1998.
[10] V. M. O. Zuniga, Techno-economic Analysis of Compressor Washing, Unpublished MSc Thesis, Cranfield University, Bedfordshire, United Kingdom, 2011.
Analysis, Unpublished PhD Thesis, Cranfield University, UK, 2002.
[13] J. L. F. Langford, Contamination Removal Method, Patent 4, 065, 322, USA, 2002.
[14] R. Yee, L. Myer, Enhanced TF40B Gas Turbine Design Chances to Improve Resistance to the Landing Craft Air Cushion (LCAC) operation environment, Naval Surface Warfare Centre Carderock Division, C. S. C. A. M. C. USA Vol. 3 at Atlanta Georgia USA; ASME USA, pp. 495-499, 2003.
[15] J. Thomas, J. Stegmaier, J. J. J. Ford, Online Washing Practices and Benefits, ASME, June 4-8, pp. 6. Toronto, Ontario, Canada, 1989.
[16] K. W. Bagshaw, Maintenance Cleanliness in Axial Compressor, National Research Council edition, Canada, 1994.
[17] D. Brumbaugh, Inlet Air Filtration Adapts to Evolving Gas Turbine Technology, Power Engineering, Vol. 106, No. 10, pp. 51-54, 2002.
[18] T. Giampolo, The Gas Turbine Handbook, The Fairmont Press, USA, 1997.
[19] K. Mathioudakis, T. Tsalavoutas, Uncertainty Reduction in Gas Turbine Performance Diagnostics by Accounting for Humidity Effects, Journal of Engineering for Gas Turbine and Power, Vol. 124, pp. 801-806, 2002.
[20] R. Kurz, K Brun, Degradation in Gas Turbine System, Journal of Engineering for Gas Turbines and Power. ASME, Paper 2000-GT345, Vol. 123 (1), pp 70-77, 2000.
[21] I. S. Diakunchak, Performance Deterioration in Industrial Gas Turbine, ASME Journal of Gas Turbines and Power, Vol. 124, pp. 114-161, 1992.
[22] F. Seddigh, H. Saravanamuttoo, A Proposed Method for Assessing the Susceptibility of Axial Compressors to Fouling, Journal of Engineering for Gas Turbine and Power. Vol. 113 (4), pp. 595-601, 1990.
[23] U. Igie, Gas Turbine Performance Application, Unpublished MSc lecture note, Cranfield University, Bedfordshire, UK, 2013.
[24] A. Razak, Industrial Gas Turbines, Woodhead, 2007.
[25] S. M. Fleshland, Gas Turbine Optimum Operation. Master Thesis, Norwegian University of Science and Technology (NTNU), Chapter 4, 2010.
[26] A. Fabbri, A. Traveerso, S. Cafaro, Compressor Performance Recovery System: which solution and when, Preoceedings of the institution of Mechanical Engineers, Part B: Journal of Power and Energy, vol. 225, no. 4, pp. 457-466, 2011. [27] G. J. Kacprzynski, M. Gumina, M. J. Roemer, D. E. Caguiat,
A Prognostic Modelling Approach for Predicting Recurring Maintenance for Shipboard Propulsion Systems, ASME Paper No. 2001-GT-0218, 2001.
[28] J. D. Enyia, Y. Li, D. I. Igbong, I. Thank-God, Industrial Gas Turbine On-line Compressor Washing for Power Generation, International Journal of Engineering Research & Technology. Vol. 4 Issue 08. pp. 500-506, 2015.
[29] G. Hovland, M. Antonie, Scheduling of gas turbine compressor washing, Intelligent Automation & Soft Computing, vol. 12, no. 1, pp. 63-73, 2006.
[30] W. Kappis, Impact of Degradation on the Operational Behaviour of a Stationary Gas Turbine and in detail on the Associated Compressor, 2013.
[31] Turbotech Ltd, http://www.turbotect.com/index.html, Retrieved July 30, 2012.
[32] P. Asplund, Gas Turbine Efficiency, Retrieved 2012, from Turbinesint: http://turbinesint.com/gas-turbine-compressor-cleaning, 1998.
[33] E. Tsoutsanis, et al. Performance Adaptation of Gas Turbine for Power Generation Applications, [electronic resource] Cranfield University, 2010.
[34] J, Fielder., Evaluation of Zero Compressor Wash Routine in RN Service. ASME Turbo Expo 2003-38887, USA, 2003. [35] P. Pilidis, Palmer, Gas turbine theory and performance,
Unpublished MSc Lecture note. Department of Power and Propulsion, Cranfield University, Bedfordshire, United Kingdom, 2010.
[36] Y. Li, Gas turbine diagnostics, Unpublished MSc Lecture note. Department of Power and Propulsion, Cranfield University, Bedfordshire, United Kingdom, 2010.
[37] N. O. Vigna, A flexible lifing model for gas turbine: Creep and fatigue approach, MSc Thesis, Cranfield University, 2006. [38] H. Oskarsson, Material Challenges in Industrial Gas Turbines, Journal of Iron and Steel Research, International, vol. 14, no. 5, Supplement 1, pp. 11-14. 2007.
[39] F. Larson, J. Miller, A time-temperature relationship for rupture and creep stresses, 1952.
[40] S. C. Gulen, P. R. Griffin, S. Paolucci, “Real-Time On-line Performance Diagnostics of Heavy-Duty Industrial Gas Turbines”, Journal of Engineering for as Turbines and Power, vol. 124, no. 4, pp. 910-921, 2002.
[41] blog.comparemysolar.co.uk/electricity-price-per-kwh-comparison-of-by-big-six-energy-companies/. Accessed August, 2015.
![Figure 1. Example of fouling particles that attached on the airfoil of compressor blade [21]](https://thumb-us.123doks.com/thumbv2/123dok_us/8461491.1708581/3.595.87.515.520.737/figure-example-fouling-particles-attached-airfoil-compressor-blade.webp)
![Figure 3. Online (Left) and offline (Right) nozzle location for compressor washing [32]](https://thumb-us.123doks.com/thumbv2/123dok_us/8461491.1708581/4.595.55.544.260.502/figure-online-offline-right-nozzle-location-compressor-washing.webp)