This article was published in an CASRP journal. The attached copy is furnished to the
author for non-commercial research and education use, including for instruction at the
authors institution, sharing with colleagues and providing to institution
administration.
Other uses, including reproduction and distribution, or selling or licensing
copied, or posting to personal, institutional or third party websites are prohibited.
In most cases authors are permitted to post their version of the article (e.g. in
Word or Tex form) to their personal website or institutional
repository
. Authors
requiring further information regarding CASRP΄s archiving and manuscript policies
encouraged to visit:
http://www.casrp.co.uk/journals
© 2016 CASRP Publishing Company Ltd. UK.
Provided for non-commercial research and education use.
Not for reproduction, distribution or commercial use.
Provided for non-commercial research and education use.
343
CASRP Publisher
International Journal of Advanced Biological
and Biomedical Research 4(4) (2016) 343–351
Original Article Open Access
Study of Surplus Biocappacity (SB) and Human Development Index
(HDI) Sustainable Development Index in the Chaharmehal va
Bakhtiari Province
Ali Jafari
1, Abotaleb Saleh Nasab
2, Yousef Askar
3*, Zahra Seyfi
41Assistant professor of forestry, Faculty of Natural Resources, University of Shahrekord, Shahrekord, Iran
2M.Sc. student of forestry, University of Tehran, Kraj, Iran
3Ph.D student of forestry, University of Shahrekord, Shahrekord, Iran
4M.Sc. Graduate of forestry, University of Shahrekord, Shahrekord, Iran
Abstract
Chaharmahal and Bakhtiari Province is one of the 31 provinces of Iran and located on the southwestern part of the country. Its capital is Shahrekord. It has an area of 16,332 square kilometers and a population of 857,910. To study of human development used the Surplus Biocappacity (SB) and Human Development Index (HDI). This research accrued in the shahr-e-kord, Boroojen, Farsan, Ardal, Lordegan and Kohrang region (chaharmehal va Bakhtiari Province). our research used the raw data in related the Surplus Biocappacity (SB) and Human Development Index (HDI) include number of death, student in the primary, guidance, high school, tertiary and number of Adult Literacy in the calendar of 2010 year. Results showed that the quantity of human development index and sub- index in the shahr-e-kord was higher the other region of chaharmehal va Bakhtiari Province, but this index in the Kohrang region was lowest quantity. because the the quantity of family income, level of education and life Expectancy index in this region are lowest in the chaharmehal va Bakhtiari Province. Other region of province arranged the Boroojen (17%), Lordegan (17%), Farsan (13%) and Ardal (12%) have a maximum of effect on the human development. Overall results showed that the shahr-e-kord (center of chaharmehal va Bakhtiari Province) has a maximum of human development, and Kohrang region have a minimum of human development. Authors suggested increasing the human development of Kohrang region more focused in this region and determinatethe
*Corresponding author: Ph.D student of forestry, University of Shahrekord, Shahrekord, Iran.
© 2016 The Authors. This is an open access article under the terms of the Creative Commons Attribution-Non Commercial- No Derives License, which permits use and distribution in any medium, provided the original work is properly cited, the use is non-commercial and no modifications or adaptations are made.
Yousef Askaret al. / International Journal of Advanced Biological and Biomedical Research (2016) 4(4) 343-351
344
more financial resource and managements.
© 2016 Published by CASRP publishing company Ltd. UK. Selection and/or peer-review under responsibility of Center of Advanced Scientific Research and Publications Ltd. UK.
Keywords: Surplus Biocappacity (SB), Human Development Index (HDI), Sustainable Development, chaharmehal va
Bakhtiari Province, Kohrang, shahr-e-kord.
1. Introduction
345
development (Morse, 2003). The researcher studied the Measuring human development via data envelopment analysis and they develop a DEA-like linear programming model to assess the relative performance of the countries in terms of human development. Then they extend our calculations with a post-DEA goal-programming model to derive estimates of a new development index by using optimal weights for the socioeconomic indicators. Finally, they estimate the relative efficiency of the countries in converting income to human development. We develop and solve for this purpose a pure DEA model with variable returns to scale (Despotis, 2005). The researcher studied of Human Development (Beyond the Human Development Index) and used the 39 indicators to encompass the categories. Of these, eight indicators are highly correlated with the HDI and may therefore be represented by it. But 31 are not highly correlated, suggesting that a full assessment of human development requires a much broader set of indicators than the HDI alone. Following the same procedure, we find that fewer than five mortality rates perform equally as well as the HDI, and income per capita is fewer representatives of other dimensions of human development. The HDI (and the other two broad indicators) are shown to be worse indicators of the extended categories of human development for OECD countries than for developing countries (2006). The researcher studied A Household-Based Human Development Index and illustrates our approach for 15 developing countries. Inequality in the HDI is stunningly large for some countries, particularly in countries with low overall human development, driven mostly by very high inequality in the education and income components of the HDI (HARTTGEN and KLASEN, 2012). The researcher studied human development in Africa and showed that the stagnating life expectancy largely due to the spread of HIV/AIDS and the arresting effect of economic mismanagement and political turmoil on growth, help to explain Africa's falling behind. Human development advancement since the mid-twentieth century is positively associated to being a coastal and resource-rich country and negatively to political–economic distortions. The large country variance of the recovery during the last decade suggests being cautious about the future's prospects (de la Escosura, 2013). The researcher studied of troubling tradeoffs in the Human Development Index and indicated the famous Human Development Index (HDI), which aggregates country-level attainments in life expectancy, schooling and income. The main change was to relax the past assumption of perfect substitutability between its components. Most users will not, however, realize that the new HDI has also greatly reduced its implicit weight on longevity in poor countries, relative to rich ones. By contrast, the new HDI's valuations of extra schooling are now very high—many times the economic returns. An alternative index is proposed that embodies less troubling tradeoffs while still allowing imperfect substitution (Ravallion, 2012). The aims of our research are study of Surplus Biocappacity (SB) and Human Development Index (HDI) Sustainable Development index in the chaharmehal va Bakhtiari Province, southwest of Iran.
2. Materials and methods
2.1. Site description
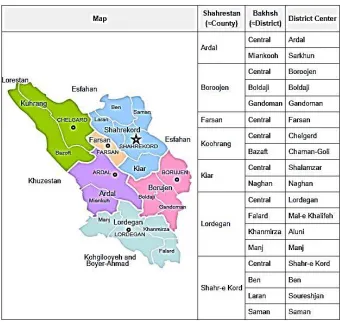
Chaharmahal and Bakhtiari Province is one of the 31 provinces of Iran (Figure 1). It lies in the southwestern part of the country. Its capital is Shahrekord. It has an area of 16,332 square kilometers and a population of 857,910 (2006).
Yousef Askaret al. / International Journal of Advanced Biological and Biomedical Research (2016) 4(4) 343-351
346
Fig. 2. Chaharmahal and Bakhtiari Province (country and district)This province in the 2006 divided the seven country (sharestan) include shahr-e-kord (368466 population), Boroojen (115286 population), Farsan (90980 population), Ardal (70381 population), Lordegan (177277 population), Kohrang (59192 population) (figure 2). This province have a 25 city, 17 district and 39 district center and in the 2006 have an 857910 population (45.1% lived in the city and 54.9% lived in the village).
2.1.1. Sustainable Development index
Human development is about creating an environment in which people can develop their full potential and lead productive and creative lives in accordance with their needs and interests (UNDP, 1999; UNDP, 2001). An increase in national income does not necessarily imply an increase in human development.2 The most important factors that determine the quality of life are health, nutritional status, morbidity, standard of living and human development (UNDP, 1999) Poverty is a major constraint in developing countries for attaining a good standard of living and human development. In developing countries, a considerable proportion of people are still poor owing to morbidity and poor availability of healthcare facilities (UNDP, 1999; UNDP, 2001). Identification and use of the appropriate indicators are important for the developmental process. In this study, we explored the health scenario with the use of various demographic, socio-economic, health and dietary indicators, and also by using the existing indices to measure poverty, human development and standard of living. The indices Human Development Index (HDI) and Human Poverty Index (HPI) have been calculated on the basis of demographic and socioeconomic indicators (UNDP, 1999; UNDP, 2001).
2.1.2. Human Development Index (HDI)
347
The well-known Human Development Index (HDI) encompasses only three rather basic aspects of human welfare.2.2. Human Development sub-Index (HDI)2.2.1. life Expectancy at Birth (25 year are minimum and 85 year are maximum)
The trend in the life expectancy of humans during the past thousand years has been characterized by a slow, steady increase and a pattern frequently punctuated by a volatility in death rates caused by epidemics and pandemic infectious diseases, famines, and war (Olshansky et al, 1996). This volatility was dramatically curtailed in the mid-19th century as infectious diseases yielded swiftly to improved living conditions, advances in public health, and medical interventions (McNeill, 1976).
2.2.2. Adult Literacy Ratio (zero is minimum and 100 is maximum)
Relative achievements in each a country's in the adult literacy field measured by gross enrollment rates in primary, guidance, high school and tertiary levels of education. This index calculated according to the following formula.
Today, the economic condition of each country depends on the level of general education, literacy education and human resources.
2.2.3. Gross Domestic Product GDP (100$ minimum and 40000$ maximum) (Pourasghar sangachin, 2010)
Gross Domestic Product (GDP) measures the size of the country economics. This index includes the value of all goods and services in the specified period during a, usually a year, is produced in a country (World Bank, 2006).
2.2.4. compact index CI
This index is compact of three indexes (Gross Domestic Product GDP, life Expectancy at Birth and Adult Literacy Ratio)
2.3. Surplus Biocappacity (SB)
Overall results showed that the Surplus Biocappacity (SB) evaluated the bio-ecological footprint and sustainable consumption patterns. To calculate this indicator the productive land and water surface area subtract the ecological footprint area. This index is a function of the amount of ecologically productive areas, consumption and population. In developed countries this indicator is generally low and sometimes negative quantity.
Productive aired land)
Yousef Askaret al. / International Journal of Advanced Biological and Biomedical Research (2016) 4(4) 343-351
348
3. Results and discussionThe HDI assesses intercountry development levels on the basis of three so-called deprivation indicators: life expectancy, adult literacy and the logarithm of purchasing power adjusted per capita GDP (McGillivray, 1991).
3.1. Human Development Index (HDI)
3.1.1. life Expectancy at Birth
Table 1
The methods of life Expectancy at Birth in the 2010 year
number of death life Expectancy at Birth location
4431 0.767 In chaharmehal va Bakhtiari Province
2081 0.36 In Shahr-e-kord city
Table 2
Methods of calculate the Gross Enrolment Ratio to the Primary, Secondary and high school in the 2010
Total of population Primary stage Guidance stage High school stage Tertiary stage
97459 27359 21337 48763 48985
Period/ population 0.992 0.996 0.994 0.187
Gross Enrolment Ratio 0.79*100=79%
Gross Enrolment Ratio= 0/79 = 3.1.2. Adult Literacy Ratio
Table 3
Methods of calculate the Adult Literacy Ratio in the 2010
261921 Population more the 15 year
8329 Number of Adult Literacy Ratio
0/031*100=3/1% Number of Adult Literacy Ratio/ Population more the 15 year
3.1.3. Education index
3.1.4. Gross Domestic Product (GDP)
Table 4
Methods of calculate the Gross Domestic Product in the 2010
Population Gross Domestic
Product
population
In chaharmehal va Bakhtiari Province 0.670 857910
349
3.2. Human development index=
3.2.1. Surplus Biocappacity (SB)
Table 5
Methods of calculate the Surplus Biocappacity (SB) in the 2010
Productive aired land Shahr-e-kord city 109.015 20.88 38.684 49.45
Surplus Biocappacity (S(
Table 6
Human development index classes
Low (HDI) medium (HDI)
high (HDI) Very high (HDI)
human development index classes
Less the 0.488 0. 667-0.488 0.788-0.667 More 0.788 quantity Table 7
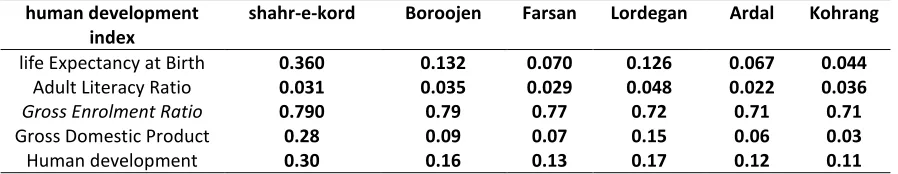
The human development index in the six regions of chaharmehal va Bakhtiari Province
Kohrang Ardal Lordegan Farsan Boroojen shahr-e-kord human development index 0.044 0.067 0.126 0.070 0.132 0.360
life Expectancy at Birth
0.036 0.022 0.048 0.029 0.035 0.031
Adult Literacy Ratio
0.71 0.71 0.72 0.77 0.79 0.790
Gross Enrolment Ratio
0.03 0.06 0.15 0.07 0.09 0.28
Gross Domestic Product
0.11 0.12 0.17 0.13 0.16 0.30 Human development Table 8
The Surplus Biocappacity (SB) sub-index in the six regions of chaharmehal va Bakhtiari Province
Kohrang Ardal Lordegan Farsan Boroojen shahr-e-kord
Surplus Biocappacity (SB)
sub-index 6.933 5.463 18.133 7.556 30.433 38.684
Productive aired land
6.979 20.936 24.184 25.90 12.042 20.88 18.334 126.886 20.959 59.541 186.148 109.015 4.42 100.48 -21.35 49.39 49.39 49.45
Surplus Biocappacity (SB)
Table 9
The human development sub- index in the chaharmehal va Bakhtiari Province
Sustainable development index 2006 Human development Education index Gross Domestic Product life Expectancy at
Birth
0.750 0.814
0.675 0.767
Yousef Askaret al. / International Journal of Advanced Biological and Biomedical Research (2016) 4(4) 343-351
350
Results showed that the quantity of human development index and sub- index in the shahr-e-kord was higher the other region of chaharmehal va Bakhtiari Province and this region (shahr-e-kord) have a better human development, because the quantity of family income, level of education and life Expectancy index in this region are higher in the chaharmehal va Bakhtiari Province, but this index in the Kohrang region was lowest quantity. because the quantity of family income, level of education and life Expectancy index in this region are lowest in the chaharmehal va Bakhtiari Province (table 7 and 8). Other region of province arranged the Boroojen (17%), Lordegan (17%), Farsan (13%) and Ardal (12%) have a maximum of effect on the human development. Overall results showed that the shahr-e-kord (center of chaharmehal va Bakhtiari Province) have a maximum of human development, because this region have a more financial resource and managements. Kohrang region have a minimum of human development because this region located in the thither of shahr-e-kord and have a lowest the financial resource and managements.authors suggested to increase the human development of Kohrang region more focused in this region and determinate the more financial resource and managements.
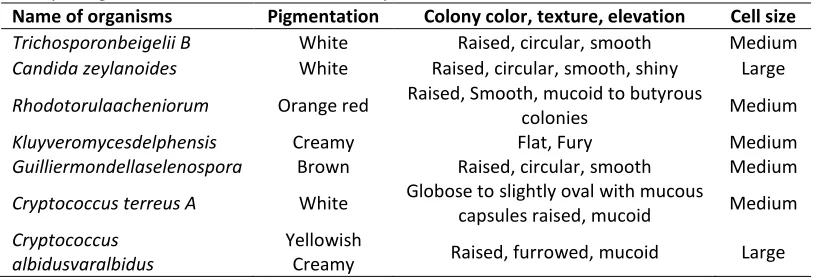
From similar morphology cluster the percentage occurrence on culture media recorded as, 20% Trichosporon
beigelii B, 16.6% Candida zeylanoides, 13.3% Rhodotorulaacheniorum, 13.3% Kluyveramyces delphensis, 10% Guilliermondella selenospora, 6.67% Cryptococcus terreus A, 6.67% Cryptococcus albidus Var aerus, 6.67% Filobasidilla neoformans and 6.67% Hyphopichia burtoni. (1) The highest percentage occurrence on culture media
was Trichosporonbeigelii B (20%), and the lowest occurrence was Cryptococcus terreus A, Cryptococcusalbidus Var
aerus, Filobasidilla neoformans, and Hyphopichiaburtoni (6.7%).
Table 1
Morphological characteristics of the isolated yeasts.
Name of organisms Pigmentation Colony color, texture, elevation Cell size
Trichosporonbeigelii B White Raised, circular, smooth Medium
Candida zeylanoides White Raised, circular, smooth, shiny Large
Rhodotorulaacheniorum Orange red Raised, Smooth, mucoid to butyrous
colonies Medium
Kluyveromycesdelphensis Creamy Flat, Fury Medium
Guilliermondellaselenospora Brown Raised, circular, smooth Medium
Cryptococcus terreus A White Globose to slightly oval with mucous
capsules raised, mucoid Medium
Cryptococcus albidusvaralbidus
Yellowish
Creamy Raised, furrowed, mucoid Large
Acknowledgement
We thank Mr. Sorosh Zabiholahii and Vahid Rizvandi for their help in the field and we thank Mr. Khabat Khosravi for their help in the analysis of data.
References
De la Escosura. L., (2013). Human development in Africa: A long-run perspective. Explorations in Economic History 50, 179–204.
Faber. JF. (1982). Life tables for the United States: 1900-2050. Actuarial study no. 87. Baltimore: Social Security Administration, (SSA publication no. 11-11534 Web of Science).
HARTTGEN. K., KLASEN. S., (2012). A Household-Based Human Development Index. World Development 40(5), 878–899.
Hicks. D., (1997). the inequality-adjusted human development index: A constructive proposal. World Development, 25 (8), 1283–1298.
Macdonell. WR. (1913). On the expectation of life in ancient Rome, and in the provinces of Hispania and Lusitania, and Africa. Biometrika, 9,366-380
351
McGillivray. M., (1991). The human development index: Yet another redundant composite development indicator.
World Development, 9(10), 1461–1468.
Morse. S., (2003). For better or for worse, till the human development index do us part. Ecological Economics, 45(2), 281-296.
Neumayer. E., (2001), the human development index and sustainability — a constructive proposal. Ecological
Economics, 39(1), 101-114.
Noorbakhsh. F., (1998), A Modified Human Development Index. World Development, 26 (3), 517-528.
Olshansky. SJ., Carnes. BA., (1996), Prospects for extended survival: a critical review of the biological evidence. In: Caselli G, Lopez AD, eds. Health and mortality among elderly populations. Oxford, England: Oxford University Press, 39-58.
Ravallion. M,, (2012), Troubling tradeoffs in the Human Development Index. Journal of Development Economics, 99, 201–209.
Sagar. A., Najam. A., (1998). The human development index: a critical review. Ecological Economics, 25 (3), 249-264.
United Nations Development Program [UNDP], (1990). Human Development Report. Oxford University Press, New York.
United Nations Development Program. Human development report, (1999), 159–63.
United Nations Development Program (UNDP). Human development report: making new technologies work for human development. New York: Oxford University Press, (2001). p. 9–25.
Word bank, (2006). Republic Islamic Iran.
Calendar of 2010 year, (2010), Republic Islamic Iran. How to cite this article: Ali Jafari, Abotaleb Saleh Nasab, Yousef Askar, Zahra Seyfi, 2016. Study of Surplus Biocappacity (SB) and Human Development Index (HDI) Sustainable Development index in the chaharmehal va Bakhtiari Province. International Journal of Advanced Biological and Biomedical Research, 4(4), 343-351.
Submit your next manuscript to CASRP Central and take full advantage of:
• Convenient online submission • Thorough peer review
• No space constraints or color figure charges • Immediate publication on acceptance • Inclusion in Google Scholar