ISSN 2334-2447 (Print) 2334-2455 (Online) Copyright © The Author(s). All Rights Reserved. Published by American Research Institute for Policy Development DOI: 10.15640/jges.v4n2a2 URL: https://doi.org/10.15640/jges.v4n2a2
Seismic Surface Wave Investigation of the Lake Erie Bluffs
Brian E. Miller1
Abstract
Both natural and human activities contribute to bluff erosion along the Lake Erie coastline. Bluff erosion may become problematic over time because structures have been built on the bluff. Many factors contribute to bluff erosion; processes such as wave, ground water, surface water and human activity all play a role. A further understanding of the local geology may aid in identifying areas that are at greater risks of high rates of erosion. Geophysical methods are non-invasive techniques that have been used to investigate the near-surface for more than thirty years. There are several seismic methods used to explore the near-surface and seismic surface wave analysis is one such method. The Multichannel Analysis of Surface Waves (MASW) relies on the use of seismic surface waves, in particular Rayleigh waves, to investigate the upper several meters of the subsurface. The end result of the MASW method is to produce a 2-D shear-wave velocity profile of the subsurface. Because shear-wave velocities give an indication of subsurface material stiffness they may be used to help in understanding near-surface conditions and potential influences on erosion.
Keywords: seismic, geophysics, surface waves, MASW, bluff erosion
Further understanding of the processes contributing to the erosion of the Lake Erie Bluffs would be beneficial by providing additional insight into the overall environment and how local geologic factors may contribute to the erosion of the Lake Erie coastline. The focus of this research is to use MASW seismic methods to investigate the geology of the Lake Erie bluffs region to gain further understanding of the local geology and to map basic geologic features.
In particular, the properties of the upper lacustrine sands are investigated. The MASW method is used to investigate the shear-wave velocity (Vs) structure of these upper lacustrine deposits.
While there are many interrelated factors involved with bluff erosion additional understanding of local geologic factors may help identify areas that may be at greater risk for erosion and where to implement management systems in the attempt to reduce bluff erosion.
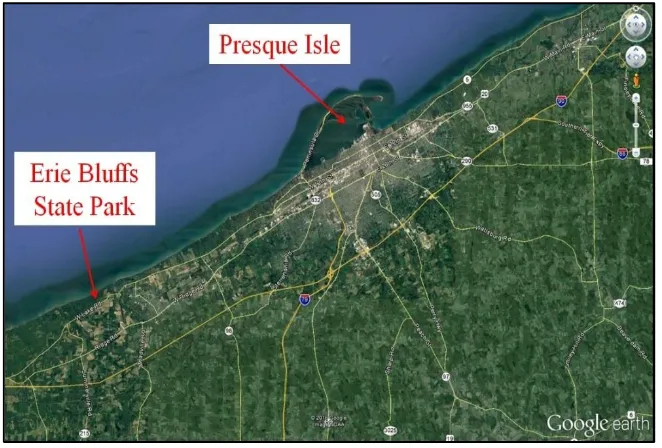
Seismic surveys took place at two locations, the first at Erie Bluffs State Park (EBSP) which is located within Erie, PA approximately 28.75 km west of Presque Isle (Figure 1).
Figure 1: Erie Bluffs State Park location (image modified from Google Earth).
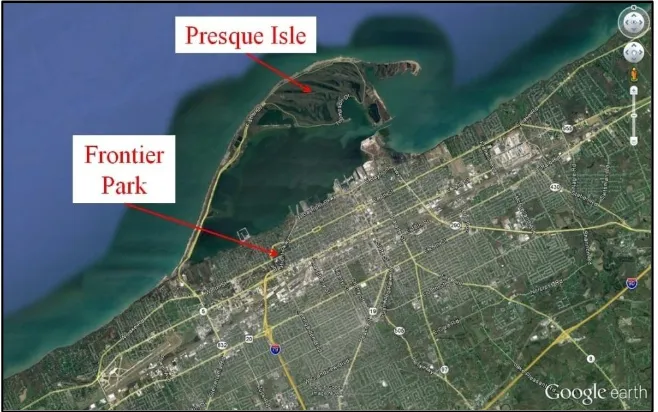
Figure 2: Frontier Park location (image modified from Google Earth).
Results of each survey are analyzed in regards to the shear-wave velocity structure of the subsurface and correlations between shear-wave velocity properties and geologic features at each location are made. Low shear-wave velocities would suggest lower material stiffness that may be attributed to higher water content and/or reduced compaction and thus a potential for greater erosion. Using MASW methods the general geologic structure of subsurface layers is investigated to determine if the thicknesses of subsurface layers change significantly between the locations.
Surface Wave Methods
In general, there are two types of surface waves most widely observed in seismic investigations and earthquake seismology; Rayleigh and Love waves (Dobrin and Savit, 1988). If a vertical seismic source, such as employed in these surveys, is used the type of surface waves generated are Rayleigh waves. Rayleigh wave particle motion has a vertical direction and is in most cases always generated in near-surface seismic reflection surveys and makes up a large percentage of each shot record.
In a layered medium wherein seismic velocity changes with depth surface waves have a dispersive property that is indicative of elastic moduli of near-surface earth materials. Short wavelengths penetrate shallower depths and longer wavelengths deeper depths. The propagation velocity for each wavelength, called phase velocity (Bath, 1973), depends primarily on the shear wave velocity of the medium over the penetration depth, therefore surface wave velocity is a good indicator of Vs and by analyzing the dispersion feature of ground roll, near-surface Vs profiles can be constructed.
Surface waves have long been used to study the subsurface and development of surface wave methods date back to the 1950s when the steady state method was first used (Van der Pol, 1951; Jones, 1955). Initial studies were based entirely on the Rayleigh wave fundamental mode assumption and all other types of waves including higher modes and body waves were ignored. These early methods eventually became known as the Continuous Surface Wave (CSW) method (Matthews et al., 1996).
A progression from the SASW method was the development of the multi-channel analysis of surface waves (Park et al., 1999; Xia et al., 1999; Ivanov et al., 2005; Miller et al., 2008). One of the main benefits of MASW is that it uses multi-channel acquisition. The focus of surface wave analysis has been the creation of a shear wave velocity profile. Performing an MASW investigation usually consists of acquiring surface waves on multi-channel seismic records; generation of a dispersion curve, which is a plot of frequency versus phase velocity, for each shot record; picking the fundamental-mode from each dispersion curve record; inverting the dispersion curves to obtain 1-D Vs profiles and finally creating a 2-D Vs profile of the subsurface from the 1-D Vs profiles. Spatial interpolation is used between subsequent 1-D Vs profiles and each 1-D Vs profile, located in the middle of the receiver spread, is used to acquire the corresponding record (Park, 2005).
The first documented use of the multi-channel approach for surface wave analysis dates back to the early 1980s when investigators in the Netherlands used a 24-channel acquisition system to deduce the shear wave velocity structure of tidal flats. Park et al. (1999) later highlighted the effectiveness of the multi-channel approach by detailing advantages of multi-channel acquisition and processing for geotechnical investigations. MASW is an attractive geophysical method because of its efficiency of investigating elastic properties of near-surface materials. In addition, it provides a way of getting subsurface information that may not be available from other methods. In regards to surface waves, the inclusion of waves considered as noise, such as body waves, direct waves, refracted waves, and air waves (Sanchez-Salinero et al., 1987), reflected waves (Sheu et al., 1988) and higher-modes (Gucunski and Woods, 1991); ground roll can be identified by its different coherency in arrival times on a multi-channel record.
Geology of the Bluffs
In some areas Middle Upper Devonian aged bedrock belonging to the Canadaway Formation, is exposed at the base (Sevan and Braun, 1997, Pennsylvania Department of Conservation and Natural Resources, 1990). The tills of the bluff area are made up of fine-grained material which overlies the Devonian shales. Overlying the glacial tills are lacustrine , strand, and alluvial deposits (Hapke et al., 2009 ) as a result of proglacial lakes.
Method
Erie Bluffs State Park
Data Acquisition The first survey conducted was located within EBSP (Figure 3).
Figure 3: Erie Bluffs State Park site location.
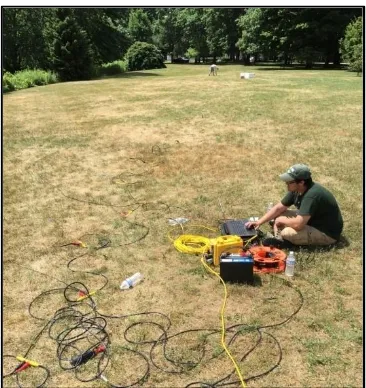
Recording time was 0.5 second with a sampling interval of 0.125 ms. A small sledge hammer and metal striking plate were used to generate the source signal (Figure 4). Figure 5 shows two of shot records that were acquired during the survey.
Figure 4: Field survey. Left) Sledge hammer being used as a seismic source, Right) Field crew setting up seismic surveying equipment.
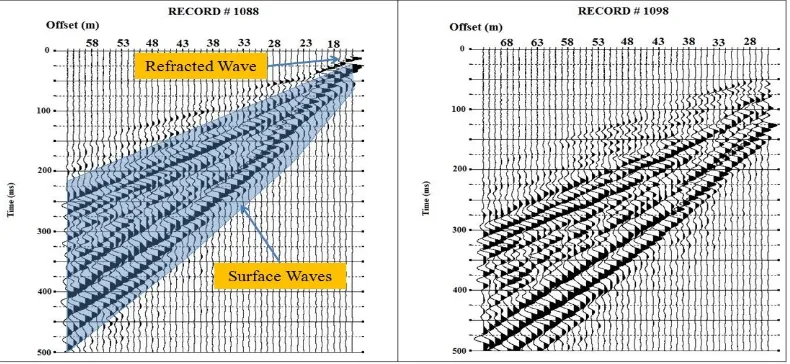
Figure 5: Seismic shot records from two separate locations displaying dispersive nature of surface waves which are used for the shear wave velocity
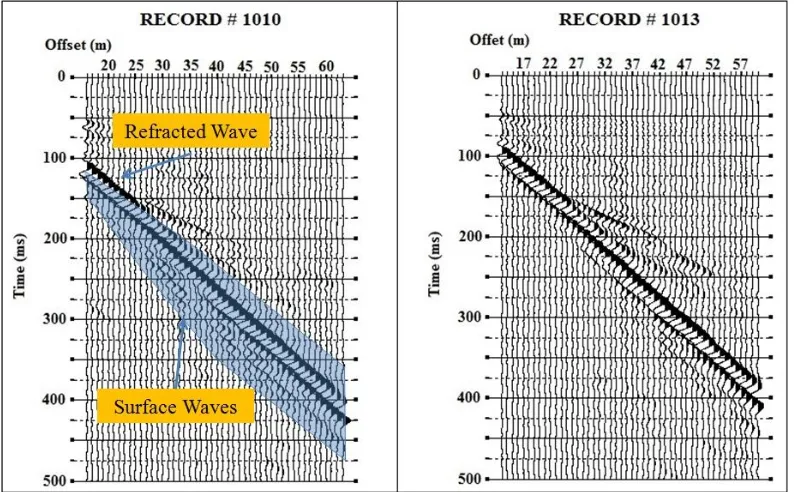
Each shot record contains several seismic wave modes such as the refracted and surface waves. The dispersive surface waves, as shown by their high amplitude, low frequency characteristics, are the waves of interest when performing an MASW survey.
Data Analysis Several dispersion curves and 1-D shear wave velocity profiles
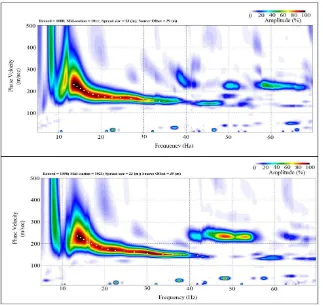
are shown as example records. Dispersion curves are graphical ways to represent phase velocity versus frequency and the fundamental mode (Figure 6) is picked on each dispersion curve for each positioning of the source. As can be seen on the dispersion curves, phase velocities range between ~150-350 m/sec with a frequency range of approximately 10-50 Hz.
Figure 6: Example dispersion curve picks. Dispersion curves are picked for each seismic shot record and the data from the picks then used in the inversion routine. Top) Dispersion curve generated from seismic shot record
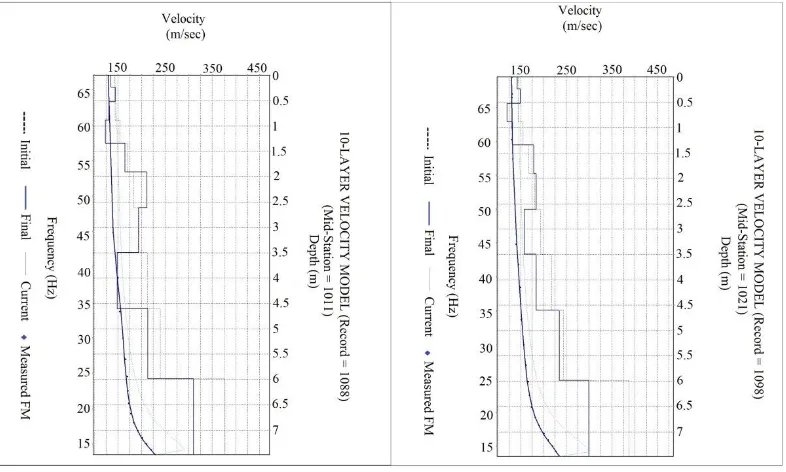
Several 1-D shear wave velocity profiles are also shown (Figure 7). The 1-D profiles can be useful as they indicate the shear wave velocity with depth at a given location along the receiver spread.
Figure 7: Example 1-D shear wave velocity profiles. Left) Velocity profile generated from seismic shot record and dispersion curve picks record 1088,
Right) Velocity profile generated from seismic shot record and dispersion curve picks record 1098.
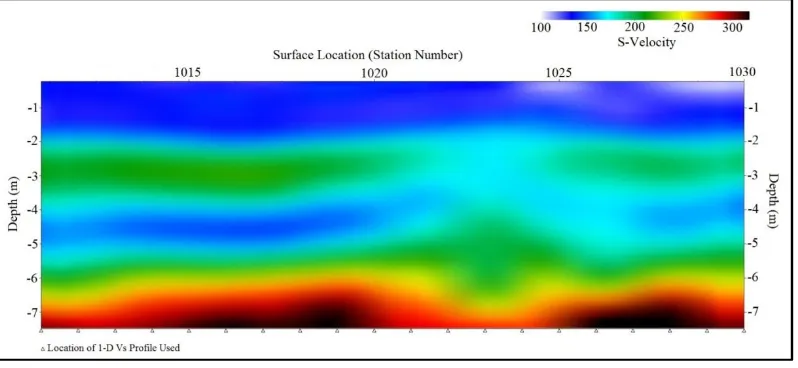
The final stage of processing is to generate a 2-D subsurface profile from the 1-D shear wave velocity profiles. The output is a color shaded shear wave velocity profile of the subsurface. While each step of processing contains useful information for interpretation the 2-D shear wave velocity profile is perhaps the most useful to the end user.
Figure 8 shows the shear wave velocity profiles of the subsurface along a 20.0 meter transect at the EBSP survey site.
Figure 8: Shear wave velocity profile (Vs) of the subsurface at the Erie Bluffs State Park survey location.
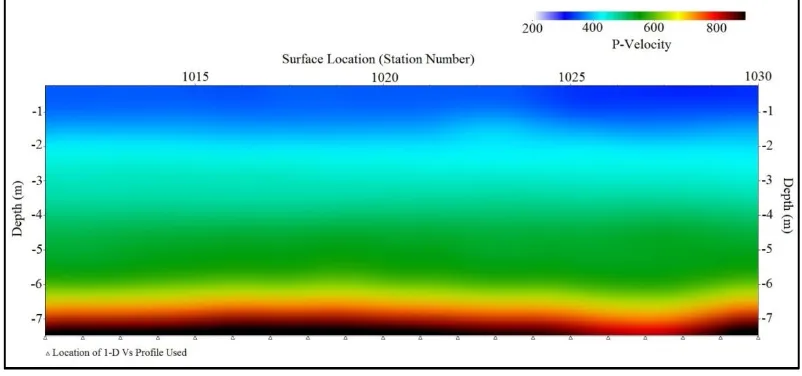
When acquiring surface waves primary waves are also recorded. Primary waves are a different type of wave mode generated with each seismic source location and have different properties than surface waves. While they have different properties they provide additional information in regards to the subsurface. The velocity of body waves also vary based upon material compaction. Figure 9 shows a 2-D primary wave velocity structure of the subsurface.
Figure 9: Primary wave velocity profile (Vp) of the subsurface at the Erie Bluffs State Park survey location.
From this image it can be seen that the various geologic layers of the subsurface are relatively flat and have an increase in velocity with depth. A seismic refraction analysis was also undertaken at this site to identify the depth of bedrock. The refraction analysis indicates that bedrock lies at approximately 7.5 meters which is in agreement with both the shear wave and primary wave profiles.
Erie Bluffs Frontier Park
Data Acquisition The second survey conducted was located at Frontier Park
which is located within the city of Erie, PA (Figure 10). This site was chosen as a location of investigation that would have lower erosion rates.
Figure 10: Erie Bluffs Frontier Park site location.
Figure 11: Seismic shot records from two separate locations displaying dispersive nature of surface waves which are used for the shear wave velocity
analysis. Left) Seismic shot record 1010, Right) Seismic shot record 1013.
Figure 12: Example dispersion curve picks. Dispersion curves are picked for each seismic shot record and the data from the picks then used in the inversion routine. Top) Dispersion curve generated from seismic shot record 1010, Bottom) Dispersion curve generated from seismic shot record 1013.
Data Analysis Several 1-D shear wave velocity profiles are also shown
Figure 13: Example 1-D shear wave velocity profiles. Left) Velocity profile generated from seismic shot record and dispersion curve picks record 1010,
Right) Velocity profile generated from seismic shot record and dispersion curve picks record 1013.
However, it can also be seen that while the shear wave velocity profiles have the same general profile the amount of velocity change between them is different. As an example, at approximately 2.0 meters both profiles decrease in velocity however one decrease by approximately 25 m/sec whiles the other decreases around 50 m/sec. Also at approximately 3.5 meters depth there is a significant decrease in one profile with only a slight decrease in the other profile.
Beneath this layer we find material with a lower velocity of approximately 175 m/sec which is then underlain by a layer with a velocity of approximately 125 m/sec.
Figure 14: Shear wave velocity profile (Vs) of the subsurface at the Erie Bluffs Frontier Park survey location.
It should be noted that the depth of investigation at this site is not as great as the EBSP location. The 2-D cross-section is interpreted as it was at the EBSP location, an unconsolidated layer of lacustrine sand from the surface to 5.0 meter depth. The layer ranging from 4.0-5.0 meters is interpreted to be water-saturated sand. In comparison to the EBSP location it should be noted that the layer at 4.0-5.0 meters does not extend across the entire surveyed area as it is interrupted by the higher velocity zone. The significance of the layer not being consistent across the area is that water movement may be impeded through this zone which may lead to a decrease in erosion.
Figure 15: Primary wave velocity profile (Vp) of the subsurface at the Erie Bluffs Frontier Park survey location.
The various geologic layers of the subsurface are relatively flat and have an increase in velocity with depth. A seismic refraction analysis was also undertaken at this site to identify the depth of bedrock. The refraction analysis indicates that bedrock lies at approximately 9.0 meters which is 1.5 meters deeper than at EBSP.
Discussion
The dispersion curves indicate conditions that are similar at both locations. Phase velocities at EBSP were found to be within the 150-350 m/sec range while at EBFP phase velocities ranged between 175-325 m/sec. These conditions indicate similar material properties within the subsurface. Frequency content of the subsurface at both locations was also similar. At EBSP frequency content fell within the 10-50 Hz range while at EBFP frequency content was within the 10-70 Hz range. The slightly higher frequency range at EBFP provides for an increase in the resolution of the shallow depths in the very near-surface.
At both locations the second and third layer have approximately the same shear wave velocity however we find that the upper layer at the EBFP location has a shear wave velocity that is approximately 50 m/sec greater than at the EBSP location. This indicates material with greater stiffness which can promote material that is not as likely to be weathered as easily. This may indicate areas where erosion is not as high and may be a method wherein MASW may be used to locate areas that may be susceptible to higher erosion rates.
At EBSP the low velocity layer ranging from 4.0-5.0 meters is interpreted to be water-saturated sand. There appears to be connectivity across the entire length of the water-saturated sand possibly allowing water to more easily move through this area and possible evidence for a path to transport meteoric water.
At EBFP the low velocity layer ranging from 4.0-5.0 meters is interpreted to be water-saturated sand. In comparison to the EBSP location shear-wave velocities indicate that this layer may restrict water movement leading to lower erosion rates.
The primary wave velocity structure at both sites is similar in that the geologic layers of the subsurface are relatively flat and have an increase in velocity with depth. However the primary wave velocity at the EBFP location is higher within the upper several meters. Primary wave velocities may provide some measure of erodability wherein higher primary wave velocities suggest greater material competence and lower erosion rates. Depth to bedrock also differed between the two locations at Erie Bluffs State Park bedrock lies at approximately 7.5 meters while at Erie Bluffs Frontier Park bedrock lies at approximately 9.0 meters. The depth to bedrock may also play a role in erosion rates. Areas with a greater bedrock depth may have lower erosion rates as there is more sediment to accommodate greater volumes of water within the subsurface.
References
Bath, M. (1973). Introduction to seismology, Birkhauser, 395 p.
Dobrin, M., B. & Savit, C., H. (1988), Introduction to Geophysical Prospecting, McGrawHill, 896 p.
Gucunski, N., & Woods, R. D. (1991), Use of Rayleigh modes in interpretation of SASW test, Proc., 2d Int’l. Conf. on Recent Advances in Geotechnical Earthquake Eng. and Soil Dynamics, St. Louis, Missouri, 1399-1408.
Hapke, C. J., Malone, Shamus & Kratzmann, Meredith (2009), National Assessment of Historical Shoreline Change: A Pilot Study of Historical Coastal Bluff Retreat in the Great Lakes, Erie, Pennsylvania, Open-File Report 2009–1042. Heisey, J.S., Stokoe II, K.H., & Meyer, A.H. (1982), Moduli of pavement systems
from Spectral
Analysis of Surface Waves, Transp. Res. Rec., v. 852, Washington D.C, p. 22-31.
Ivanov, J., Park, C., Miller, R., & Xia, J. (2005), Analyzing and Filtering Surface-Wave Energy By Muting Shot Gathers, Journal of Environmental and Engineering Geophysics, Pg. 307–322.
Jones, R. (1955), A vibration method for measuring the thickness of concrete road slabs in situ, Magazine of Concrete Research, v. 7, n. 20, p. 97-102.
Knuth, P.D., Burt, W., Flood, M., & Nagel, W. (1981), A geotechnical investigation of the coastal bluffs of Erie County, PA, Lake Erie Institute for Marine Science, Erie, Pa., 51 p.
Matthews, M.C., Hope,V.S. & Clayton, C.R.I. (1996), The use of surface waves in the determination of ground stiffness profiles. Proc. Instn. Civ. Engrs. Geotech. Engng., 119, April, 84-95.
Miller, Rick, Xia, Jianghai, Park, Choon B, & Ivanov, Julian M. (2008), The history of MASW,
The Leading Edge, Vol. 27, No. 4, P. 568-568.
Nazarian, S., K.H. Stokoe II, & W.R. Hudson (1983), Use of spectral analysis of surface waves method for determination of moduli and thicknesses of pavement systems,
Transportation Research Record, No. 930, p. 38-45.
Park, C. B., Miller, R. D., & Xia, J. (1999), Multichannel analysis of surface waves (MASW), Geophysics, 64, 800-808.
Pennsylvania Department of Conservation and Natural Resources (1990), Geologic map of Pennsylvania, Pennsylvania Department of Conservation and Natural Resources, Bureau of Topographic and Geologic Survey, Map 7, 1:2,000,000, accessed August 26, 2008.
Retrieved from http://www.dcnr.state.pa.us/topogeo/maps/map7.pdf
Sanchez-Salinero, I., Roesset, J. M., Shao, K. Y., Stokoe II, K. H., & Rix, G. J. (1987), Analytical evaluation of variables affecting surface wave testing of pavements, Transportation research record No. 1136, 86-95.
Sea Grant Pennsylvania (2000), Living on Pennsylvania’s Lake Erie Coast. Retrieved from
www.pserie.psu.edu/seagrant
Sevan, W.D. & Braun, D.D. (1997), Glacial deposits of Pennsylvania, Pennsylvania Department of Conservation and Natural Resources, Map 59, accessed August 26, 2008.
Retrieved from http://www.dcnr.state.pa.us/topogeo/maps/map13.pdf Sheu, J. C., Stokoe II, K. H., & Roesset, J. M. (1988), Effect of reflected waves in
SASW testing of pavements, Transportation research record No. 1196, 51-61. Van der Pol, C. (1951), Dynamic testing of road constructions, J. Appl. Chem., 1 July,
281–290.