Ka
-band Microwave Frequency Comb Doppler Reflectometer
System for the Large Helical Device
Tokihiko TOKUZAWA, Shigeru INAGAKI
1), Akira EJIRI
2), Ryota SOGA
3), Ichihiro YAMADA,
Shin KUBO, Mikiro YOSHINUMA, Katsumi IDA, Chihiro SUZUKI, Kenji TANAKA,
Tsuyoshi AKIYAMA, Naohiro KASUYA
1), Kimitaka ITOH, Kiyomasa WATANABE,
Hiroshi YAMADA, Kazuo KAWAHATA and LHD Experiment Group
National Institute for Fusion Science, 322-6 Oroshi-cho, Toki 509-5292, Japan 1)Research Institute for Applied Mechanics, Kyushu University, Kasuga 816-8580, Japan
2)Graduate School of Frontier Sciences, The University of Tokyo, Kashiwa 277-8561, Japan
3)Department of Energy Engineering and Science, Nagoya University, Furo-cho, Chikusa-ku, Nagoya 464-8601, Japan
(Received 9 July 2014/Accepted 8 September 2014)
Aka-band multi-channel Doppler reflectometer system was constructed for the Large Helical Device (LHD) using a comb frequency generator as a source. A filter bank system is utilized for precise quadrature phase detection, and preliminary back-scattered waves were obtained in LHD plasma experiments. In addition, a direct digital signal acquisition system was successfully demonstrated for providing a greater number of multi-channel measurements.
c
2014 The Japan Society of Plasma Science and Nuclear Fusion Research
Keywords: Doppler reflectometer, frequency comb, microwave, density fluctuation, poloidal velocity DOI: 10.1585/pfr.9.1402149
1. Introduction
Doppler reflectometry (also called Doppler back-scattering: DBS) is a unique technique when used in com-bination with the back-scattering method, which provides a wavenumber resolution, and reflectometry, which pro-vides a high-spatial resolution [1]. Doppler reflectome-try can measure the perpendicular velocity of electron density fluctuations v⊥, the radial electric field Er, and the perpendicular wavenumber spectrumS(k⊥) in magne-tized confinement plasmas. As a result, a number of sys-tems have been used in worldwide fusion plasma devices, such as tokamaks (Tuman-3M [2], ASDEX Upgrade [3–5], Tore Supra [6, 7], DIII-D [8, 9], JT-60U [10]) and heli-cal/stellarators (Wendelstein 7-AS [1,11], TJ-II [12], LHD [13]).
Recently, a multi-channel system operating over a broad frequency range has been demonstrated [9]. The sys-tem is utilized for measuring not only the spatial structure of the plasma parameters, but also the temporal relation-ship between two (or many) points in space. These mea-surements are quite helpful for evaluating plasma turbu-lence, transport, and confinement phenomena. For these reasons, a new multi-channel Doppler reflectometer has been developed for the Large Helical Device (LHD).
From a technical point of view, this novel multi-channel system is based on the previous development of a high-frequency and low phase-noise frequency comb gen-erator. A frequency comb itself is an influential mod-author’s e-mail: [email protected]
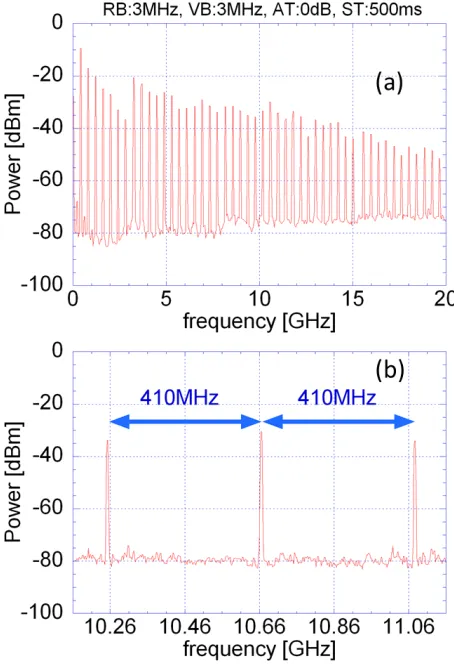
ern technology, for applications such as an optical laser comb [14], terahertz comb [15], and others. The present development for fusion plasma diagnostics is recognized as one of the applications of the frequency comb tech-nique. Figure 1 shows an example of the frequency spec-trum of the comb generator output. Here, a modulation fre-quency of 410 MHz is applied to the comb generator. Nu-merous comb frequency components can be observed up to 20 GHz, and their separation is easily controlled by the modulator. When the comb generator output is launched to the plasma and the cut-offcondition of each frequency is satisfied, each frequency component returns from its corre-sponding position. Therefore, a time resolved multi-point measurement, representing a spatio-temporal observation, has been made possible.
The principle of Doppler reflectometry is explained simply as follows. When a deliberately tilted probe wave beam is launched to a plasma, it is refracted according to the density gradient. As the wave propagates, the wavenumber decreases with the refractive index. When the wavenumber reaches a minimum, the beam is turned and reflected back. In addition, at the turning point, the wave is sensitive to fluctuations of the refractive index. If the fluctuation satisfies the Bragg condition, i.e.,k=−2ki
(wherekiis the local wave vector of the launching beam),
the scattered radiation will be returned. In addition, when the fluctuations move with a velocityu, the backscattered signal shows a Doppler frequency shift ωD = u · k = v⊥k⊥+vk+vrkr. Here, the subscriptsand r indicate the
c
2014 The Japan Society of Plasma
Plasma and Fusion Research: Regular Articles Volume 9, 1402149 (2014)
Fig. 1 Example of the frequency spectrum of the comb gener-ator output. Here, the comb genergener-ator is operated with a 410 MHz stable source modulation. (a) The entire fre-quency range and (b) an enlarged view around 10.5 GHz.
parallel and radial directions, respectively. It can usually be assumed thatk⊥ k andv⊥ < v, so that the second term (vk) is negligible in comparison with the first term (v⊥k⊥). If, in addition, the turbulence does not displace it-self radially, the third term vanishes andωD≈v⊥k⊥. Then,
the perpendicular velocityv⊥of the selected fluctuation can be calculated. The perpendicular velocity is a composition of the plasma backgroundE×BvelocityvE×Band the in-trinsic phase velocity of the density fluctuationsvph, and
this composition is given asv⊥=vE×B+vph. Ifvphis known
orvphvE×B(which is usually satisfied at the plasma edge
in magnetically confined devices), the radial electric field Er can be extracted from the measurement of the
perpen-dicular velocity throughEr =v⊥B, whereBis the absolute
value of the magnetic field [1, 3, 7].
In this paper, we describe the diagnostics system sta-tus in Sec. 2 and present an analysis of the system perfor-mance and preliminary experimental results in Sec. 3. The first trial conducted using direct signal acquisition is de-scribed in Sec. 4.
Fig. 2 Schematic of the ka-band microwave circuit for the Doppler reflectometer comprising a comb generator. A 710 MHz synthesized signal generator (SG) is used as a modulator. A 30 dB amplifier and an active multiplier provide theka-band probe wave. A 16.42 GHz local os-cillator (LO) is used for heterodyne detection. Two inter-mediatefrequency (IF) components, which are indicated as “Reference” and “Signal,” are fed to the receiver sec-tion described in Fig. 3.
2. Diagnostics System Design
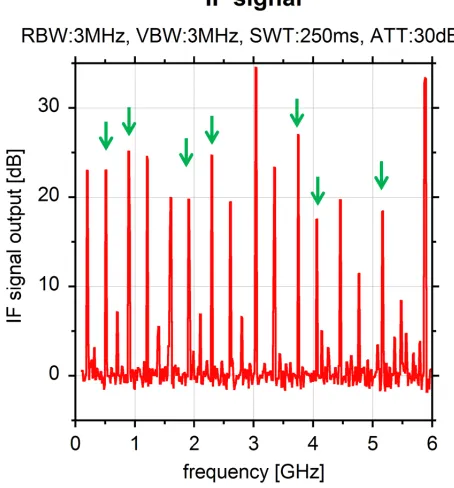
Theka-band microwave frequency comb Doppler re-flectometer system is described as follows. The system comprises two sections that consist of a microwave circuit shown in Fig. 2 and a receiver section shown in Fig. 3. A passive, nonlinear transmission line (NLTL: PSPL model 7112) modulated by a stable synthesizer is used as the fre-quency comb source. NLTLs have excellent low phase noise performance [16,17] and generate an array of equally spaced (presently, Δf = 0.71 GHz) frequencies with a slow decay in output power. The frequency range of the output is initially up to 20 GHz. The wave is amplified in the frequency range of 12 - 20 GHz. The wave fre-quency is subsequently doubled followed by a frefre-quency active multiplier in theka-band (26 - 40 GHz). In theka -band, the number of comb components is around 20 (i.e., 14 GHz/0.7 GHz). Therefore, 20 frequency components can be simultaneously launched to the plasma. The probe beam is launched and received by bistatic conical horn antennas with a lens, and these antennas can modify the launching angle to the plasma [18]. The antenna angle is slightly tilted toward the normal of the plasma surface in the horizontal cross section for Doppler reflectometry operation. The Doppler-shifted back-scattered signal is mixed with a local wave whose frequency is 32.84 GHz. Reduction of the frequency range of the intermediate fre-quency (IF) signal by tuning the local frefre-quency was suc-cessfully achieved. The IF signal has several frequency comb components, as shown in Fig. 4. Comb frequency components less than 6 GHz are clearly observed. The IF signal, denoted as “Signal,” is generated as shown in Fig. 2. A portion of the probe wave is divided and fed to mixer (Mixer 1) to form what is denoted as the “Reference” sig-nal in Fig. 2 for heterodyne detection.
Fig. 3 Schematic of the receiver section. Each IF signal (Ref-erence and Signal) is divided in to eight separate signals. The filter bank system comprises seven band pass filters (whose center frequencies are 0.53, 0.88, 1.95, 2.30, 3.70, 4.08, and 5.10 GHz) for quadrature signal detection. The output of IQ detection is fed to the 1 MHz data acquisi-tion system (ADC). Also, a poracquisi-tion of the 8-way output is fed to an electro-optical converter set (E/O and O/E) and transmitted via an optical fiber directly to the diagnostic room for direct signal acquisition.
Fig. 4 Frequency spectrum of the IF signal, which is the mi-crowave mixer output. The arrows indicate the utilized frequency components in the filter bank system.
Fig. 5 Example of a phasor plot (IQ-plot) of the 27.7 GHz fre-quency component.
section described in Fig. 3. The IF signal is divided into eight signals by an 8-way splitter. Currently, a seven-channel filter bank system is employed. The center fre-quencies of the band pass filter are 0.53, 0.88, 1.95, 2.30, 3.70, 4.08, and 5.10 GHz with a 200 MHz bandwidth. Each individual wave passing through the band pass filter is fed to an IQ mixer that outputs two signals with in-phase and quadrature-phase. As shown in Fig. 5, the IQ output is in the form of a circle when a linear phase variation arises. This provides information regarding the phase variation caused by plasma fluctuation. Finally, the data of the filter bank system are acquired by an analog to digital converter (ADC) system with a 1 MHz sampling rate and 16-bit reso-lution. In addition, we attempted to apply the direct signal acquisition system described below.
3. System Performance
Plasma and Fusion Research: Regular Articles Volume 9, 1402149 (2014)
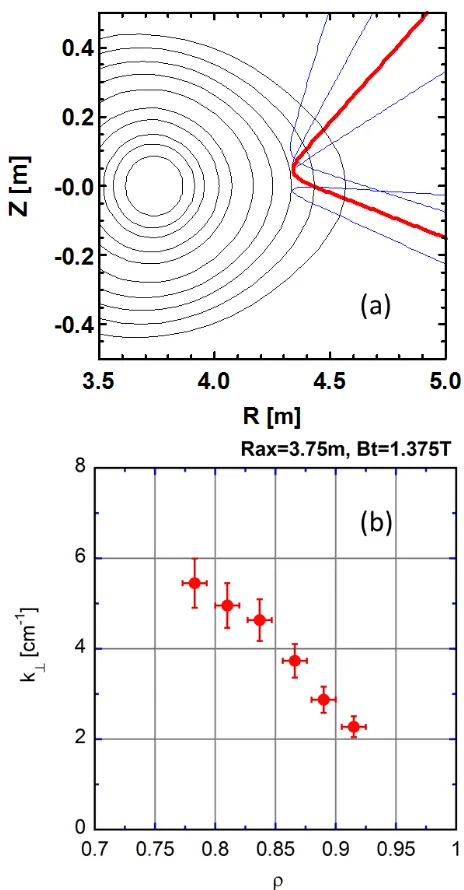
Fig. 6 (a) Example of the beam trace of a 36 GHz probe beam calculated by the LHDGAUSS code in the horizontal plasma cross section. Here, the red line shows the cen-ter ray and the beam width is expressed by the blue lines. (b) Example of the estimated wave numbers as a function of each scattered position.
Fig. 6(b), the radial dependence of the perpendicular wave numberk⊥is shown for the case of six launching frequen-cies from 28 to 38 GHz. Of course, when the antenna an-gle, the plasma condition, and/or the utilized frequency are changed in the experiments, the measured wave number exhibits a wide variety that can be as high as 15 cm−1.
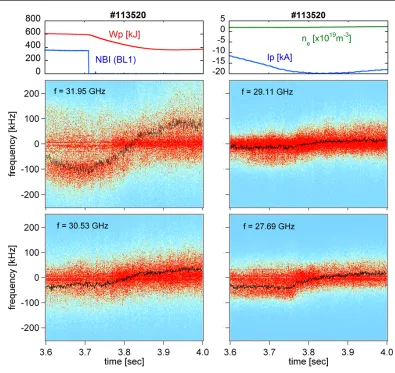
Preliminary LHD plasma measurements were per-formed. Figure 7 illustrates the temporal evolution of the Doppler frequency spectra around the interruption of tangential neutral beam injection (t-NBI). In this figure, the mean frequency, which is calculated by the simple spectrum weighted mean technique [3], is indicated by the
black line. This data is obtained under the condition that the magnetic axis position in the vacuum field is Rax =
3.60 m, and the magnetic field strength is Bt = −2.75 T.
During the time frame of interest, the perpendicular NBI sustains the plasma. Prior to the interruption of t-NBI, the electron density and the stored energy are kept nearly con-stant but the negative plasma current is increased. As can be seen, the most inner core channel of 31.95 GHz shows that the Doppler shifted frequency is decreasing toward the negative frequency direction during t-NBI. After t-NBI in-terruption, the Doppler frequency is increasingly turned. On the other hand, the outer channels show slightly de-layed responses. These frequency shifts correspond with the poloidal flow at each position because the density pro-file is nearly steady over this period. Poloidal flow and parallel flow are related to each other through the medium of the electric field. Similar fast response against tangen-tial NBI has also been observed in tokamaks [5, 8]. In ad-dition, the stored energy decreases just after the interrup-tion but the plasma current responds with a finite delay. It may be that the heating process is responding quickly to the power input, but the rotational torque is responding slowly. In addition, there are varieties of the Doppler shift frequency response at each channel. It may be shown that the poloidal flow has a fine structure. However, when the estimated Doppler shift peak frequency has a small value, it is often affected by the zero frequency components (that is, spurious carrier wave components) and the error of es-timation is relatively increased. Therefore, this diagnostics yields an interesting plasma feature.
4. Direct Signal Acquisition
Now, we describe the preliminary test results of di-rect signal acquisition in an LHD plasma experiment. The direct signal acquisition is one of the effective develop-ments for adding more channels to the multi-channel sys-tem because the current observation channel number is limited by the number of filter banks. The frequency comb reflectometer presently has around 20 frequency compo-nents. If the signal is acquired directly, it might obtain all of the frequency components, which provides much more spatio-temporal information. Another problem is the dis-tance of separation between the data acquisition and the microwave system that is installed in LHD experimental room, which is a distance of approximately 100 m. For a solution, we utilize optical fiber transmission with an electro-optical converter, whose effective frequency range is presently up to 3 GHz. The reduced IF frequency is also useful at this point. This additional system is illustrated in Fig. 3. Then, a high frequency sampling rate digital oscil-loscope (LeCroy: WaveMaster 820Zi-A [20]) is used for direct signal acquisition. Its bandwidth is 20 GHz and the sampling rate is 80 GS/s which is sufficient to demonstrate direct signal acquisition.
Fig. 7 Temporal evolution of complex frequency spectra as a response of neutral beam injection. The estimated frequency peak of the Doppler shift is inset with a black line indicative of the mean frequency. The stored energy (Wp), the line-averaged electron density (ne), and the plasma current (Ip) are also plotted (at top).
Fig. 8 Example of each frequency comb component scattered back from the corresponding layer in an LHD plasma. In this figure (oscilloscope capture), the frequency spectra are plotted overlaid one upon another. The horizontal axis indicates the frequency (1 MHz/div) and the vertical axis shows the power (10 dB/div).
obtained by the oscilloscope on-board analysis and display software. Here, 500µs of stored data is used for mak-ing this graph. The frequency combs are all overlayed in a single viewer. Using this tool, several Doppler shifted frequency comb components are observed simultaneously. Note that this capture is a rough analysis. We subsequently
Plasma and Fusion Research: Regular Articles Volume 9, 1402149 (2014)
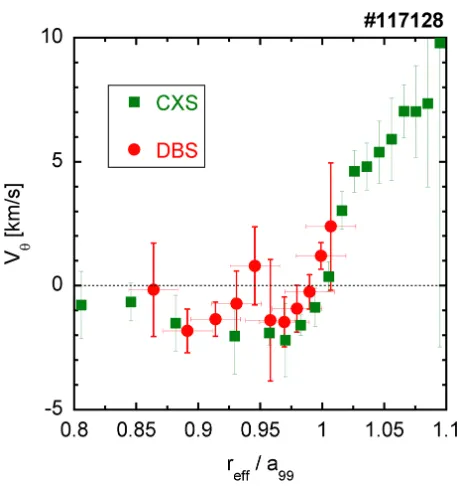
Fig. 9 Radial profiles of the poloidal velocity measured by the multi-channel Doppler reflectometer (DBS: red circles) and charge exchange spectroscopy (CXS: green squares).
(CXS) [21] data is also plotted and they are nearly in agree-ment. Therefore, it is determined that direct signal acqui-sition can be utilized.
Acknowledgments
The present study was supported in part by KAKENHI (Nos. 26630474, 25289342, 23244113, 23360414, 22360394, 22017007, and 21224014), by a Grant-in-Aid from the NIFS LHD project under the
aus-pices of the NIFS Collaboration Research Program, and by the collaboration programs of the RIAM of Kyushu Uni-versity and the Asada Science foundation. Additional sup-port was provided by Japan/U.S. Cooperation in Fusion Research and Development.
[1] M. Hirschet al., Plasma Phys. Control. Fusion43, 1641 (2001).
[2] V.V. Bulaninet al., Plasma Phys. Rep.26, 813 (2000). [3] G.D. Conwayet al., Plasma Phys. Control. Fusion46, 951
(2004).
[4] J. Schirmeret al., Plasma Phys. Control. Fusion49, 1019 (2007).
[5] G.D. Conwayet al., Nucl. Fusion46, S799 (2006). [6] P. Hennequinet al., Rev. Sci. Instrum.75, 3881 (2004). [7] P. Hennequinet al., Nucl. Fusion46, S771 (2006). [8] J.C. Hillesheimet al., Rev. Sci. Instrum.80, 083507 (2009). [9] W.A. Peebleset al., Rev. Sci. Instrum.81, 10D902 (2010). [10] N. Oyamaet al., Plasma Fusion Res.6, 1402014 (2011). [11] M. Hirschet al., Rev. Sci. Instrum.72, 324 (2001). [12] T. Happelet al., Rev. Sci. Instrum.80, 073502 (2009). [13] T. Tokuzawaet al., Rev. Sci. Instrum.83, 10E322 (2012). [14] J.L. Hall and T.W. Hänsch, in 2005 Nobel Prize in Physics. [15] T. Yasuiet al., Appl. Phys. Lett.87, 061101 (2005). [16] S.H. Pepper and K. Schoen, “Microwaves and RF”,
Oc-tober 2005, http://www.mwrf.com/articles/articleid/11224/ 11224.html
[17] Picosecond Pulse Labs, Boulder, CO, Microwave Journal, May 2006, http://www.picosecond.com/objects/
mwj_reprint.pdf
[18] Y. Yokotaet al., Rev. Sci. Instrum.79, 056106 (2008). [19] S. Kubo et al., “ECH Power Deposition Study in the
Collisonless Plasma of LHD” in Proceedings of 11th Int. Congress on Plasma Physics (July 2002, Sydney, Australia) p.133 (2002).